Differentiation in Arabidopsis
Angela Bruex1, Raghunandan M. Kainkaryam2, Yana Wieckowski1, Yeon Hee Kang3, Christine
Bernhardt1, Yang Xia1, Xiaohua Zheng1, Jean Y. Wang4, Myeong Min Lee3, Philip Benfey4, Peter J. Woolf2, John Schiefelbein1*
1Department of Molecular, Cellular, and Developmental Biology, University of Michigan, Ann Arbor, Michigan, United States of America,2Department of Chemical Engineering, University of Michigan, Ann Arbor, Michigan, United States of America,3Department of Biology, Yonsei University, Seoul, Korea,4Department of Biology and IGSP Center for Systems Biology, Duke University, Durham, North Carolina, United States of America
Abstract
The root epidermis of Arabidopsis provides an exceptional model for studying the molecular basis of cell fate and differentiation. To obtain a systems-level view of root epidermal cell differentiation, we used a genome-wide transcriptome approach to define and organize a large set of genes into a transcriptional regulatory network. Using cell fate mutants that produce only one of the two epidermal cell types, together with fluorescence-activated cell-sorting to preferentially analyze the root epidermis transcriptome, we identified 1,582 genes differentially expressed in the root-hair or non-hair cell types, including a set of 208 ‘‘core’’ root epidermal genes. The organization of the core genes into a network was accomplished by using 17 distinct root epidermis mutants and 2 hormone treatments to perturb the system and assess the effects on each gene’s transcript accumulation. In addition, temporal gene expression information from a developmental time series dataset and predicted gene associations derived from a Bayesian modeling approach were used to aid the positioning of genes within the network. Further, a detailed functional analysis of likely bHLH regulatory genes within the network, includingMYC1,bHLH54,bHLH66, andbHLH82, showed that three distinct subfamilies of bHLH proteins participate in root epidermis development in a stage-specific manner. The integration of genetic, genomic, and computational analyses provides a new view of the composition, architecture, and logic of the root epidermal transcriptional network, and it demonstrates the utility of a comprehensive systems approach for dissecting a complex regulatory network.
Citation:Bruex A, Kainkaryam RM, Wieckowski Y, Kang YH, Bernhardt C, et al. (2012) A Gene Regulatory Network for Root Epidermis Cell Differentiation in Arabidopsis. PLoS Genet 8(1): e1002446. doi:10.1371/journal.pgen.1002446
Editor:Dominique C. Bergmann, Stanford University, United States of America
ReceivedJuly 28, 2011;AcceptedOctober 28, 2011;PublishedJanuary 12, 2012
Copyright:ß2012 Bruex et al. This is an open-access article distributed under the terms of the Creative Commons Attribution License, which permits unrestricted use, distribution, and reproduction in any medium, provided the original author and source are credited.
Funding:This research was funded by a National Science Foundation AT2010 grant IOS 07234493 to JS, the Next-Generation BioGreen 21 Program (No. PJ008207), the Rural Development Administration, the Republic of Korea and a Korea Research Foundation Grant KRF-2009-013-C00047 to MML, and National Science Foundation AT2010 grants to PB. The funders had no role in study design, data collection and analysis, decision to publish, or preparation of the manuscript.
Competing Interests:The authors have declared that no competing interests exist. * E-mail: [email protected]
Introduction
A current goal in molecular biology research is to understand the organization and logic of complex gene regulatory networks. To this end, genome-scale approaches have been used to generate large datasets concerning the identity and expression of genes in time and space. Although there is great interest in using expression datasets to understand transcriptional regulation of gene pathways [1,2], we currently have only a rudimentary understanding of the way genes are organized into and coordinately function in complex networks to generate the flexibility and stability inherent in many biological processes.
The Arabidopsis root epidermis provides a potentially useful model for studying gene networks, due to its developmental simplicity and abundant molecular genetic resources [3,4,5]. The root epidermis is composed of a single layer of cells organized into rows (or files) whose entire developmental history has been defined from embryonic origin to mature cell types [6,7,8] (Figure 1). Continuous transverse divisions in the root meristematic region generate new epidermal cells that become progressively more differentiated as they age, ultimately becoming root hair cells or
TRIPTYCHON (TRY), and ENHANCER OF TRY AND CPC (ETC1), help specify the hair cell fate and mutations in them (alone or in combination) cause non-hair cells to develop in place of hair cells (‘‘hairless’’ mutants) [19,20,21]. Current models
suggest that TTG (a small WD-repeat protein [22]), GL3 and EGL3 (bHLH transcription factors [23,24,25]), and WER and MYB23 (MYB-type transcription factors [17,18]) act in a central transcriptional complex in the N cells to promote the non-hair cell fate. This central complex also mediates lateral inhibition by promoting transcription ofCPC,TRY, andETC1, which are small one-repeat MYB proteins able to move to adjacent H cells and inhibit WER/MYB23-GL3/EGL3-TTG complex formation [19,20,21,26,27,28,29,30,31,32,33]. In addition, the central com-plex represses expression of theGL3/EGL3bHLH genes, and as a result, bHLH proteins are thought to move from the H to the N cells [24]. The appropriate hair/non-hair cell-type pattern is proposed to be initiated by positional cues acting through the SCRAMBLED LRR receptor-like kinase to influence the relative abundance of the transcription complexes in the H and N cell positions [34,35,36].
The early-acting root epidermis transcription factors are thought to control the expression of numerous genes encoding transcriptional regulators, signaling molecules, enzymes, and structural proteins responsible for cell-type-specific morphogenetic and biochemical events. One of these genes, GLABRA2 (GL2), encodes a homeodomain-leucine-zipper (HD-Zip) transcription factor protein [37] required for non-hair cell differentiation [12,38]. The ROOT HAIR DEFECTIVE6 (RHD6) gene is likely to be negatively regulated by GL2, and it encodes a basic helix-loop-helix (bHLH) transcription factor that, together with a related bHLH protein (RSL1), is required for root-hair cell differentiation [39,40,41]. Later morphogenesis events in the epidermal cells are
Figure 1. Development of the Arabidopsis root epidermis.Low-magnification images of root tips from Arabidopsis seedling roots showing the series of developmental events that occur from undifferentiated cells (bottom) to mature cells (top). Left: The three major zones of developmental activities are indicated. Scale bar: 100mm. Right: A root expressing the non-hair cell markerGL2::GUSillustrates the file-specific pattern of developing hair cell files (unstained; indicated as ‘‘H’’) and non-hair cell files (blue-stained cells). Major epidermal differentiation events are indicated, together with a list of genes known to be involved in each event. Scale bar: 50mm.
doi:10.1371/journal.pgen.1002446.g001
Author Summary
A current challenge in the field of developmental biology is to define the composition and organization of gene networks that direct the pattern and differentiation of cells, tissues, and organs. In this study, we address this problem using Arabidopsis root epidermis development, a relatively simple model for studies of cell pattern formation and differentiation in plants. We used a tissue-specific cell sorting approach to define more than 1,500 genes whose transcripts differentially accumulate in the developing root epidermis. A series of transcriptome analyses were performed with 17 root epidermal mutants and 2 plant hormone treatments to dissect the regulatory relationships between 208 core genes. In addition, gene expression information from a developmental time series dataset was used to organize genes temporally. The results provide insight into the composition, organization, and logic of a developmental gene regulatory network. Furthermore, this work demonstrates the utility of an integrated analysis in gene regulatory network construc-tion using genetic, genomic, and computaconstruc-tional approach-es.
A Gene Regulatory Network for the Root Epidermis
influenced by proteins controlling cell wall biosynthesis, cytoskel-etal activities, and production/trafficking of extracellular materi-als, such as COW1, COBL9, IRE1, LRX1, and the MRH proteins (reviewed in [5,15]) (Figure 1). Root hair cell differenti-ation is also influenced by the plant hormones auxin and ethylene, which promote hair initiation and morphogenesis, although the precise molecular basis is unclear [40,42,43].
To expand our understanding of the composition, organization, and function of the gene network that governs root epidermis differentiation, we conducted a large-scale comparative transcrip-tome analysis using root epidermis mutants and plant hormone treatments. We reasoned that perturbing the network with specific mutations and treatments would elicit transcriptional changes that could be used to dissect the network and define the relative positions of the member genes. Further, we combined this approach with temporal gene expression information from a developmental time series dataset as well as the molecular genetic analyses of selected newly identified transcription factor genes. Together, the results provide new insights into the gene regulatory network controlling root epidermis development, including the kinds of component genes, their organization into distinct transcriptional branches, and their response to external factors. These results provide a resource for future studies and demon-strate the utility of a mutant-based transcriptome analysis for dissecting the architecture of a regulatory network.
Results
Identification of Genes in the Root Epidermal Cell Differentiation Pathway
As a first step toward generating a gene regulatory network for root epidermis development, we defined a collection of genes involved in this process. Given that the WER/MYB23, GL3/ EGL3, TTG, and CPC/TRY are the earliest-known transcrip-tional regulators of the root-hair/non-hair cell fates, we conducted a microarray-based comparison of lines homozygous for mutations in these to identify genes under their transcriptional control and preferentially expressed in one or the other cell type (Figure 2A). Three of the mutant lines produce excessive root-hair cells (‘‘hairy lines’’;wer myb23,gl3 egl3, andttg) and one line produces only non-hair cells (‘non-hairless line’’; cpc try) (Figure S1C; Table S1). We reasoned that employing multiple independent hairy mutant lines would maximize the robustness of our analysis by eliminating potential false positives caused by effects on processes unrelated to epidermis development.
To focus on gene expression in the developing root epidermis, theWER::GFPtransgene [17] was incorporated into each of the four mutant backgrounds and WER::GFP-expressing cells and their RNA were obtained via a fluorescence-activated cell sorting (FACS) approach [44,45]. TheWER::GFPmarker was selected for this purpose because (1) WER acts at the top of the epidermal specification hierarchy and its spatial expression is not significantly affected by alterations in other components in the network (Figure S2), (2)WER::GFPis expressed in all stages of differentiating root epidermal cells, from the initial cells through the final differenti-ation zone [17], and (3) WER::GFP is expressed in both differentiating hair and non-hair cell types, although it is preferentially expressed in the non-hair cells [17] (Figure S2).
Triplicate microarray experiments were conducted, using ATH1 Affymetrix arrays, for each of the four lines (wer myb23, gl3 egl3, ttg, and cpc try) at each of two different facilities (at the University of Michigan and at Duke University) to maximize recovery of genotype-dependent transcript differences (six biolog-ical replicates for each genotype; 24 total microarrays). A total of
1,582 genes exhibited a significant difference in transcript abundance (q,0.01) between the hairy and hairless mutant lines in at least one of the two comparisons (Michigan or Duke; Figure 2A; Table S2). The proteins encoded by these genes are overrepresented (p,0.05) in gene ontology (GO) classes consistent with root epidermis activities, including the general categories of cell wall biosynthesis, cellular secretion, and expansion, as well as the specific processes of root hair cell differentiation, epidermal cell fate specification, and root hair elongation (Table S3).
To focus on a smaller set of genes strongly influenced by these transcriptional regulators, we subjected the 1,582 genes to a secondary filter, requiring at least 2.0-fold change in transcript level in each individual comparison between the hairless line (cpc try) and the three hairy lines (wer myb23,gl3 egl3,ttg) and in the same direction in both the Duke and Michigan data (a total of six comparisons). We identified 208 genes that satisfied these criteria (referred to as ‘‘core root epidermal genes’’); including 154 genes with transcripts more abundant in each of the three hairy lines (referred to as ‘‘hair genes’’), and 54 genes with transcripts more abundant in the cpc try line (referred to as ‘‘non-hair genes’’) (Figure 2; Table S4).
Validation of this root epidermal gene set was provided by data from several independent (non-microarray based) sources. First, this 208 gene set includes all six genes that had previously been shown to be transcriptionally regulated by one or more of the WER/MYB23, GL3/EGL3, TTG, or CPC/TRY transcription factors in the root epidermis:GL2[12,46],ETC1[47,48],RHD6 [41], PRP3 [49], TTG2 [50], and EXP7 [51]. Also, this list included eight additional genes that have been functionally linked to the process of root epidermis development, via mutational or misexpression studies (COBL9, COW1, IRE1, LRX1, MRH1, MRH2, MRH3, MRH6; Table S4). In addition, GO analyses demonstrated that genes associated with root epidermis-related categories, such as ‘‘root hair cell differentiation’’, ‘‘cell tip growth’’, root epidermal cell differentiation’’, and ‘‘trichoblast differentiation’’ are significantly overrepresented (p,0.05) in the 208 gene set (Figure 2B). Finally, a high proportion of genes from this gene set (34/208) contains the consensus sequence for a putative ‘‘root hair element’’ (RHE; [52]) within 1 kb of their predicted translation start sites (Table S4).
Analysis of New Transcription Factor Genes in the Root Epidermis Pathway
Using GO analysis and Arabidopsis genome annotation information, 14 of the 208 core root epidermal genes were predicted to encode transcription factors (Table S4; Figure 2A). At the time of this analysis, only five of these 14 were known to be associated with root epidermal development (TRY, ETC1, GL2, TTG2, andRHD6; Table S4). Among the nine others, four encode bHLH transcription factors preferentially expressed in root hair cells:MYC1,bHLH54,bHLH66, andbHLH82(Table 1; Figure 2C; Table S4). Given the importance of other bHLH proteins in the transcriptional control of root epidermis development (e.g.GL3, EGL3, andRHD6), we selected these four genes for detailed study, and multiple homozygous insertion mutants were identified and analyzed for each gene (Table S1; Figure 3).
A Gene Regulatory Network for the Root Epidermis
accumulation in the developing hair cells (Figure 2; Table 1). To examine this further, we generated aMYC1::GFPtranscriptional reporter fusion and discovered that MYC1::GFP plants exhibit preferential GFP accumulation in the differentiating root hair cells (Figure 3E). Further, MYC1::GFP expression is present in all epidermal cells in the wer mutant, is nearly absent in the cpc mutant, and is unaltered in the gl2 mutant (Figure 3E). These results confirm the microarray results and indicate thatMYC1is preferentially transcribed in the developing hair cells, is negatively regulated by WER, and is positively regulated by CPC. Because these features ofMYC1are similar toGL3andEGL3[23,24], we analyzed possible genetic interactions between these bHLH genes. We discovered thatmyc1-1is able to enhance the effect of thegl3-1 and the egl3-1mutations on ectopic root hair formation (Figure S3), suggesting that the MYC1 bHLH protein acts redundantly with GL3 and EGL3 in root epidermal patterning.
bHLH54. In contrast tomyc1, the major effect of thebhlh54-1 mutant is a reduction in the frequency of root-hair cells (and a corresponding increase in non-hair cells), relative to the wild type (Figure 3A, 3C). This suggests that bHLH54 is required for specification of the hair cell fate and/or for root hair initiation.
bHLH66. Thebhlh66-1mutant exhibits a normal pattern of root epidermal cell types, but its root hairs possess an abnormal morphology (Figure 3). In particular, a high frequency (approximately 50%) of the hairs form branches (Figure 3B, 3D), implying a role forbHLH66in regulating root hair elongation.
bHLH82. Thebhlh82-1mutant possessed significantly shorter hairs than the wild type (Figure 3A, 3F), indicating thatbHLH82is necessary for sustaining root hair elongation. However, no defect in hair branching or cell type pattern formation was observed (Figure 3).
bHLH84, bHLH85, and bHLH69. The MYC1, bHLH54, bHLH66, andbHLH82genes are members of three subfamilies of bHLHs in Arabidopsis, designated IIIf, VIIIc, and XI [53] (Table 1). We considered the possibility that other members of these bHLH gene subfamilies that are not represented on the ATH1 microarray chip might also be involved in root epidermis development. Indeed, one bHLH gene not represented on the ATH1 chip,AT5G37800(also known asRSL1andbHLH86; [53]) a member of the bHLH VIIIc subfamily (Table 1), had previously been shown to be involved in root hair formation by acting partially redundantly withRHD6[41]. To assess other bHLHs in these subfamilies not represented on the ATH1 chip, we analyzed T-DNA insertion lines for the two remaining genes from bHLH subfamily VIIIc (AT2G14760=bHLH84 and AT4G33880= bHLH85) and the one gene in bHLH subfamily XI not represented on the ATH1 chip (AT4G30980=bHLH69). We discovered that each of these three bHLH mutant lines has defects in root hair formation (Figure 3). Specifically, each exhibits a significant increase in the percentage of branched root hairs (Figure 3D), and the bhlh84-1 and bhlh85-1 mutants showed a significant reduction in root hair length. This suggests that these Figure 2. Identification of genes in the root epidermis differentiation pathway.(A) Flow chart of the steps used to define 154 root-hair cell genes and 54 non-hair cell genes used to build the root epidermal gene network. (B) List of gene ontology (GO) categories that are significantly (p,0.05) overrepresented among the core 208 root epidermal genes. (C) Hierarchical clustering of the 208 core root epidermal genes, based on their relative transcript accumulation in Affymetrix ATH1 microarrays usingWER::GFP-expressing cells from three replicates of thewer myb23,gl3 egl3,ttg, andcpc trymutants. Red = high transcript level; Blue = low transcript level. The order of microarray samples along the x-axis is as follows: Columns 1– 3,cpc try(Duke); Columns 4–6,cpc try(Mich); Columns 7–9,wer myb23(Duke); Columns 10–12,gl3 egl3(Duke); Columns 13–15,ttg(Duke), Column 16,gl3 egl3(Mich); Column 17,wer myb23(Mich); Columns 18–19,gl3 egl3(Mich); Columns 20–22,ttg(Mich); Columns 23–24,wer myb23(Mich). On the right side, specific gene names represent the genes analyzed in the mutant microarrays or genes previously known to be regulated by the WER/ MYB23-GL3/EGL3-TTG pathway.
doi:10.1371/journal.pgen.1002446.g002
Table 1.Three subfamilies of bHLH genes in Arabidopsis involved in root epidermis development.
bHLH Sub-family* AGI Gene ID bHLH Gene Name
Relative Transcript Accumulation in Root Epidermis Cell Types** (ATH1 signal from hairy / non-hairy lines)
Michigan Dataset Duke Dataset
IIIf AT1G63650 EGL3 3.8 (0.1) 7.4 (26)
IIIf AT4G00480 MYC1 30 (,0.1) 12.5 (2)
IIIf AT4G09820 TT8 1.1 (65) 1.0 (79)
IIIf AT5G41315 GL3 Not represented on ATH1 chip
VIIIc AT1G27740 bHLH54 37 (,0.1) 11.7 (,0.1)
VIIIc AT1G66470 RHD6 37 (,0.1) 10.3 (1.2)
VIIIc AT2G14760 bHLH84 Not represented on ATH1 chip
VIIIc AT4G33880 bHLH85 Not represented on ATH1 chip
VIIIc AT5G37800 bHLH86 Not represented on ATH1 chip
XI AT1G03040 bHLH7 0.8 (22) 0.7 (4.8)
XI AT2G24260 bHLH66 15.7 (,0.1) 7.7 (,0.1)
XI AT4G02590 bHLH59 0.5 (2.2) 0.8 (3.8)
XI AT4G30980 bHLH69 Not represented on ATH1 chip
XI AT5G58010 bHLH82 49 (,0.1) 10 (1.5)
A Gene Regulatory Network for the Root Epidermis
three bHLH genes are also necessary for appropriate root hair elongation.
Taken together, the presence of mutant phenotypes for each of these bHLH genes indicates broad participation of members of the bHLH subfamilies IIIf, VIIIc, and XI in regulating transcriptional events during many stages of root epidermis development.
Transcriptome Analysis of Mutants Affecting Root Epidermis Development
To further analyze the 208 root epidermal genes and their organization in a transcriptional regulatory network, we assessed their transcript profiles in lines containing knockout mutations for genes acting at later stages of root epidermal development. A total of 13 diverse root epidermal mutants were selected for this purpose, and theWER::GFPmarker was incorporated into each mutant background to assess the root epidermis transcriptome.
Transcription Factor Gene Knockouts. We first analyzed the effect of mutations in transcription factor genes that are essential for root epidermis development, and thereby most likely to affect transcript accumulation of genes in this network.
TheRHD6bHLH gene is known to be required for root hair initiation, to be preferentially expressed in developing hair cells, and to be positively regulated by CPC and negatively regulated by TTG, WER, and GL2 [39,41](Figure 4; Figure S1). We compared transcript levels for the 208 root epidermal genes in rhd6versus wild type, by analyzing RNA from sorted cells marked with WER::GFP. As expected, most (126) of the 154 root-hair gene transcripts are negatively affected in the developing root epidermis of the rhd6 mutant (FC.2.0; Figure 4B), including LRX1 and PRP3which had previously been shown to be RHD6 dependent [49,54]. Among the 28 root-hair gene transcripts that are not substantially altered in the rhd6 root epidermis, a significance analysis of microarrays (SAM) comparison between therhd6and cpc try datasets showed that 24 of these display a significant difference in transcript abundance (FC.2.0; q,0.02), indicating that RHD6 does not regulate transcription of all of the hair cell differentiation genes. Unexpectedly, therhd6mutation also altered transcript accumulation for 17 of the non-hair genes (Figure 4B). Sixteen of these 17 genes exhibit increased transcript levels inrhd6, relative to wild-type (FC.2.0), yet 14 of the 16 do not significantly differ between rhd6 and cpc try (FC,2.0, q.0.1). This indicates that the role of RHD6 in promoting root hair formation is not limited to inducing root-hair cell differentiation genes, but it also acts (directly or indirectly) to inhibit transcription of non-hair genes.
TheGL2homeobox gene is also likely to represent a key node in the root epidermis network, because it is essential for non-hair cell differentiation [12] and it is positively regulated by the WER/ MYB23-GL3/EGL3-TTG regulatory complex via direct binding by WER to its promoter [30]. Although non-hair cells are replaced by root-hair cells in thegl2mutants (Figure S1, Figure 4A) [12], these ectopic hair cells still display some characteristics of non-hair
cells, indicating aspects of non-hair cell differentiation are GL2-independent [10,12,23]. Our transcriptome analysis showed that gl2alters most of the 208 core epidermal genes in a similar manner as thewer myb23,gl3 egl3, andttgmutants (204/208 genes exhibit FC.2 in gl2versus cpc try; Figure 4). This is consistent with the view thatGL2plays a major role in non-hair cell transcriptional regulation. As an independent test of the effect of GL2 on one of these genes, we used RT-PCR to analyze theMYB30RNA level in wild-type and gl2 mutant roots. In support of the microarray results, a reduction in MYB30 RNA was observed in the gl2 background (Figure S4). In contrast to the large fraction of genes exhibiting a similar response togl2,wer myb23,gl3 egl3, andttg, one cluster of six non-hair genes exhibits higher transcript levels ingl2, relative tower myb23,gl3 egl3andttg(labeled ‘‘GL2 independent’’ in Figure 4B), and this is supported by a three-way SAM (for each gene, FC.1.3 for gl2versus wer myb23, gl3 egl3, andttg). Thus, these six genes likely represent a group of GL2-independent non-hair cell genes that are positively regulated by WER/MYB23, GL3/EGL3, and TTG, but not by GL2.
In addition torhd6andgl2, we selected two of the new bHLH transcription factor gene mutants (myc1andbhlh66) forWER::GFP -based transcriptome analysis. In the root epidermal tissue of each of these mutants, we identified a relatively small number of significant transcript alterations among the 208 core epidermal genes, including 16 genes affected inmyc1and 10 genes affected in bhlh66(FC.2.0; q,0.05) (Figure 4C; Figure S5; Table 2; Table S5; Table S6), which implies that each of these genes affects only a small portion of the root epidermal network and/or that they act in a partially redundant manner with other regulators. Many of these significantly affected genes are non-hair genes (8/16 formyc1 and 8/10 forbhlh66), which is consistent with the phenotypic effect ofmyc1on non-hair cell fate (Figure 3) and indicates that, despite its expression in root-hair cells, bHLH66 has a role in regulating non-hair genes.
Non-Transcription-Factor Gene Knockouts within the Root Epidermal Network. To further probe the gene regulatory pathway, we conducted WER::GFP-based FACS and transcriptome analyses with seven mutants defective in non-transcription-factor genes in the 208-gene network. We reasoned that this group of genes (includingCOBL9,COW1,IRE1, LRX1, MRH1,MRH2, andMRH3) may directly or indirectly affect gene transcription in the root hair cells because they encode potential regulatory proteins, such as kinases, phosphatases, or membrane proteins (Table S1; Table S4), they are expressed preferentially in root hair cells (Figure 2), and they cause abnormal root hair growth when mutated (Figure 4A; Figure S1). Our results showed that most of these mutants affect a small number of root epidermal gene transcripts (Figure 4C; Figure S5; Table 2; Table S5) suggesting a minor role for these in transcriptional regulation. The exception was themrh3 mutant, which significantly affected 40 root epidermal genes (including a decrease in 28 root-hair expressed gene transcripts), implying that the MRH3-encoded Figure 3. Analysis of bHLH transcription factor genes involved in root epidermis development.(A) Low magnification view of roots from wild-type and homozygous bHLH mutants. Scale bar: 200mm. (B) High magnification view of individual root hairs from wild-type and each mutant.
Scale bar: 30mm. (C) Cell-type pattern analysis, showing the fraction of root-hair cells and non-hair cells that lie in the H and N cell positions,
respectively, of the root epidermis. Mutants which differ significantly from the wild type (p,0.05) are indicated with an asterisk. Some columns lack error bars because all values were identical. (D) Analysis of root hair branching. Mutants which display a significantly greater proportion of branched root hairs than the wild type (p,0.005) are indicated with an asterisk. (E) Expression of theMYC1::GFPtranscriptional reporter fusion in the root epidermis of wild-type and mutants. The location of H-cell files is designated by ‘‘H’’. Scale bar: 20mm. (F) Root hair length in wild-type and bHLH
mutants. The length of full-grown root hairs was measured and the number of hairs in each 50mm class was determined for each mutant line (white
bars) and compared to the wild type (gray bars). Each of the six mutants shown here displayed a significantly different distribution of root hair lengths from wild type (p,0.005). ThebHLH69mutant did not exhibit a significant difference in root hair length distribution and is not shown. In panels (C), (D), and (F), error bars indicate standard deviation.
A Gene Regulatory Network for the Root Epidermis
phosphatase is more closely linked to transcriptional regulation. Using GO analysis, we found that the genes affected in these seven mutants tend to be associated with cell wall biosynthesis (Table S6), which is consistent with their hair morphogenesis defects.
Non-Transcription Factor Gene Knockouts Outside the Network. Mutations in some genes not included among the 208 core genes are known to cause defects in root epidermis development. We used mutants affecting two well-characterized genes of this type, RHD2 and CSLD3, to conduct WER::GFP FACS-based transcript profiling. RHD2 encodes a protein with NADPH oxidase activity that influences accumulation of reactive oxygen species necessary for normal root hair tip growth [55,56] (Figure S1 and Figure 4A). We found that, relative to the wild type, therhd2 mutant significantly alters the root epidermal transcript level of 23 of the 208 core genes (Figure 4C; Figure S5; Table S5) and these are overrepresented in the GO classes related to cell wall biosynthesis (Table S6). The CSLD3 gene encodes a cellulose synthase-related protein andcsld3mutants exhibit a reduction in epidermal cell growth and hair bursting (Figure S1 and Figure 4A), likely due to weakened cell wall structure [57,58]. We observed a large number of gene transcripts affected in thecsld3mutant (86/ 208; Figure 4C; Figure S5; Table S5), perhaps due to a general indirect effect of cell bursting on root hair RNA levels. Consistent with this, a majority of the affected genes are root hair genes and affect GO categories related to cell wall and cell expansion (Table S6).
Comparing our overall results from the nine non-transcription factor (downstream) mutant microarrays, we noticed an excep-tional group of six root-hair genes that are affected in a majority ($6) of these mutants. In particular, the transcript level for each of these six genes (AT1G34510, AT2G20520, AT4G28850, AT5G22410, AT5G57530, and AT5G57540) was significantly reduced in thecobl9,ire1,lrx1,mrh3,rhd2, andcsld3mutants. It may
be that transcription of this group of genes, which encode three cell-wall modifying xyloglucan endotransglucosylase/hydrolases, a fascilin-like arabinogalactan cell wall protein, and two peroxidases involved in oxidative stress response, is particularly sensitive to root hair growth disruption.
Transcriptome Analysis of Plant Hormones Affecting Root Epidermis Development
The differentiation of root hair cells is promoted by the plant hormones auxin and ethylene, although the molecular mechanism is unclear [4,42,51,59,60]. The most robust effect of these hormones is observed in therhd6mutant background, where the block in root hair formation caused by rhd6 is overcome by addition of 1-amino-cyclopropane-1-carboxylic acid (ACC; an ethylene precursor) or indole-3-acetic acid (IAA; an auxin) to the growth medium, implying that these hormones activate the hair differentiation network at some point downstream or independent of RHD6 [39,40] (Figure 5A, 5B). Here we exploited this robust effect of auxin and ethylene in the rhd6 background to further probe the organization of the root epidermal regulatory network. We discovered that treatment ofrhd6 WER::GFPseedlings with 10mM IAA or 1mM ACC elicited similar transcriptional effects on the 208 genes during root epidermis development, with more than 90% of the genes affected by one treatment also affected by the other (FC.2.0) (Figure 5C) and the relative effect on each gene was similar in each treatment (Figure 5D). This suggests that these two hormone treatments act in a similar molecular manner to induce root hair formation in therhd6mutant, and accordingly, we considered the results of these two treatments together for this study. Among the 90 genes affected by both IAA and ACC treatments, all are root hair genes and all of them exhibited an increase in transcript abundance (Figure 5E), which strongly indicates that these hormones exert their effect on root hair
Table 2.Core root epidermis genes significantly affected in mutant lines.*
Mutant Root Hair Genes Repressed Root Hair Genes Induced Non-Hair Genes Repressed Non-Hair Genes Induced
bhlh66 2 0 4 4
cobl9 13 2 6 3
cow1 2 6 0 5
csld3 70 0 7 9
ire1 8 0 3 4
lrx1 13 0 3 2
mrh1 1 0 1 1
mrh2 1 0 0 1
mrh3 28 1 2 9
myc1 2 6 4 4
rhd2 17 1 1 4
*Significant genes display FC.2 and q,0.05. A list of the gene IDs is given in Table S5. doi:10.1371/journal.pgen.1002446.t002
Figure 4. Effect of mutations on expression of the 208 core root epidermal genes.(A) Low magnification view of roots from wild-type and homozygous root epidermis mutants. Scale bar: 250mm. (B) Hierarchical clustering of the 208 core root epidermal genes, based on their relative
transcript accumulation in Affymetrix ATH1 microarrays usingWER::GFP-expressing cells from three replicates of (left to right) thecpc try,rhd6,gl2,ttg,
gl3 egl3,wer myb23mutants and the wild type Columbia. Red = high transcript level; Blue = low transcript level. Asterisks indicate genes significantly affected in the rhd6 mutant background. (C) Hierarchical clustering of the 208 core root epidermal genes, based on their relative transcript accumulation (averaged from three replicates) in Affymetrix ATH1 microarrays usingWER::GFP-expressing cells from (left to right)cpc try,rhd6,csld3,
mrh3,gl2,gl3 egl3,ttg,lrx1,cobl9,rhd2,ire,mrh1,mrh2,wild type,cow1,myc1,bhlh66, andwer myb23. Red = high transcript level; Blue = low transcript level. Heirarchical clustering of the complete set of three replicates for each line is presented as Figure S5.
A Gene Regulatory Network for the Root Epidermis
formation (at least in the rhd6 background) through promoting transcription of genes normally expressed in root hair cells.
Visualizing and Modeling the Transcriptome Data To obtain a large-scale view of the relationships among the mutations/treatments across the 208 gene set, we applied multidimensional scaling (MDS) to reduce the high-dimensional gene expression patterns to a two-dimensional representation (Figure S6). This visualization highlights two qualitatively different groups of gene expression patterns. One pattern includes therhd6, rhd6+MS, andcpc trymutants, which are all phenotypically hairless lines and located farthest from the wild type toward the right in Figure S6. The second pattern, less well isolated, includes thegl2, gl3 egl3,ttg, andwer myb23mutants, which all produce excess root-hair cells, and these cluster in the upper left corner in Figure S6.
This plot helps validate the transcriptome data as a large-scale reflection of the root epidermis phenotypes in these lines.
Next, we used a computational modeling strategy to obtain another view of the transcriptional relationships between the 208 core genes from the microarray data. A Bayesian network approach was applied, which exploits conditional independence relationships in gene expression levels measured under various conditions to generate a directed acyclic graph of nodes that best predict downstream nodes [61,62]. An advantage of our dataset for this approach was the use of the 17 knock-out mutants, because they served to fix the direction of parent-to-offspring nodes in the Bayesian-derived relationships. Further, we added two phenotypic nodes to this analysis, representing the characters of ‘‘root hair length’’ and ‘‘root hair branching’’, so that the gene(s) that best predict each of these characters could be identified. To enable this
Figure 6. Bayesian modeling from root epidermal transcriptome data. Consensus Bayesian network showing the connections (edges) between 219 possible nodes (208 core root epidermal genes, 7 genes used in microarray mutants, 2 hormone treatments, and 2 root hair phenotypes) that appear in at least 40% of the 42,000 high-scoring networks from among more than 109total networks analyzed using microarray transcript data from 66 datasets. The directionality of the edges is indicated by arrowheads and by the hierarchy (the higher-positioned node predicts the lower node). Nodes represent core root-hair genes (green fill), core non-hair genes (orange fill), other genes or factors not in the 208 gene list (yellow fill), gene knockouts used for transcriptome analysis (thick outline), genes encoding predicted transcription factors (red-colored outline), and genes encoding predicted cell wall proteins (purple-colored outline). Note that this consensus model illustrates less than 219 nodes because some nodes did not appear in any frequently occurring edges.
doi:10.1371/journal.pgen.1002446.g006
Figure 5. Molecular genetic analysis of root-hair differentiation induced by auxin and ethylene.(A) Roots ofrhd6seedlings grown for three days on unsupplemented (MS) media, and then transferred to either MS, MS+10 nM IAA, or MS+1mM ACC and grown for two additional days.
Arrows indicate the position of root tip at time of transfer. Scale bar: 200mm (B) Quantitative analysis of root epidermal cell specification inrhd6
seedlings grown for three days on unsupplemented (MS) media, and then transferred to either MS, MS+10 nM IAA, or MS+1mM ACC and grown for
two additional days. The root-hair and non-hair cell types were determined from the portion of the root produced in the last two days. (C) Core root epidermal genes significantly affected (.2-fold change;,0.5% FDR) by transfer ofrhd6 WER::GFPseedlings to either MS+10 nM IAA, or MS+1mM
ACC (relative to transfer to MS). After two days of seedling growth on the transferred media, root epidermal cells were collected by GFP-based cell sorting and the RNA used for ATH1 microarray analysis. (D) Plot of the fold-change for the 90 root epidermal genes induced by IAA and by ACC following transfer ofrhd6 WER::GFPseedlings to either MS+10 nM IAA, or MS+1mM ACC. (E) Hierarchical clustering of 208 core root epidermal genes
based on their transcript levels on ATH1 chips (triplicate biological replicates) using RNA from developing root epidermal cells inrhd6 WER::GFP
seedlings grown for three days on unsupplemented (MS) media, and then transferred to either MS, MS+10 nM IAA, or MS+1mM ACC and grown for
additional analysis, we conducted a detailed phenotypic charac-terization of root hair length and degree of root hair branching in each of the wild type and mutant lines (Figure S1, Figure 3D and 3F, and Figure S7; Table S7).
Given the large number of nodes in our network (.200), the analysis of all possible Bayesian networks was not computationally practical. As an alternative, we scored a limited number of candidate networks (approximately 109), identified specific edges common among the highest scoring 42,000 networks, and used these to generate a composite Bayesian network that links the individual high-scoring edges (Figure 6). The resulting network predicts transcriptional relationships between particular gene pairs, including ones with known regulatory interactions and groups of similar genes, such as cell wall genes (outlined in purple in Figure 6). In particular, this analysis was useful in defining the relationship between nodes of different types. Specifically, the resulting model identified AT1G16360 expression as the best predictor of root hair length (via an inverse correlation). Because AT1G16360 encodes a LEM3/CDC50-like protein related to regulators of polarized secretory activity in yeast [63], this gene may normally act to inhibit root hair tip growth. With respect to the root hair branching character, the composite Bayesian network identified two root-hair genes,bHLH66andAT4G13390(encoding a proline-rich extensin-like wall protein), as the best predictors of the degree of root hair branching (in an inverse correlation). This suggests a role for these genes in the maintenance of unidirectional tip growth during root hair formation, and it shows how a modeling approach of this type can generate insights not apparent from simple transcript profile comparisons.
Relative Developmental Timing of Root Epidermal Gene Expression
To assist the organization of the genes in the epidermal network, we analyzed the relative developmental timing of transcript accumulation for each of the 208 core root epidermal genes. In a previous study, gene transcript levels along the length of the Arabidopsis root tip were profiled by microdissection of two independent roots into 12 sections (approximately 3–5 cells per section) [64]. Using these temporal transcriptome datasets, we defined the developmental profiles for the 208 core genes and used hierarchical clustering to place each within a group, based on the timing of their maximal transcript accumulation (Figure 7). This analysis revealed six major zones of temporal gene activity (named Zone 1–6) for root epidermis development, and it was validated by comparing previously determined non-microarray-based expres-sion profiles for known genes (e.g.GL2, RHD6, PRP3). Interest-ingly, we noticed that a relatively large number (22) of the genes in Zones 1 or 2 (35) are non-hair genes, whereas the root hair genes tend to be located in Zones 4 and 5 (Figure 7), which may reflect the importance of defining the non-hair cell fate at an early stage.
Construction of a Gene Regulatory Network
The root epidermal transcript information obtained from the mutants, hormone treatments, and developmental zone analysis were integrated with known molecular genetic information to construct a gene regulatory network (Figure 8, Tables S8 and S9). This structure was built principally from transcriptional effects (i.e. genes exhibiting the same dependence relationships in knockout or hormone experiments were grouped), and developmental timing information was used to resolve discordant results or to predict likely transcriptional relationships. This depiction emphasizes that, rather than a simple linear pathway, root epidermis differentiation
is controlled by branching transcriptional pathways that act coordinately to generate the two cell types.
Discussion
The Organization and Logic of the Root Epidermis Gene Regulatory Network
During the past twenty years, traditional molecular genetic analyses have led to the identification and functional character-ization of many individual genes that influence root epidermis development in Arabidopsis, making it one of the best character-ized cell specification and differentiation processes [65]. Here we exploited these available resources and conducted a comprehen-sive genome-wide analysis to expand our understanding of the genes involved in this process and to assemble them into a transcriptional regulatory network (Figure 8). The results from this study provide a new view of the composition of the root epidermis gene network, the organization of genes within the network, and the role of plant hormones in modulating root hair formation.
First, this work significantly expands our knowledge of the genes that participate in root epidermis development. Less than one-half of the 1582 genes identified in our basic transcript profiling analysis had been previously associated with root epidermis development in any other genetic or genomic screens. Comparing our 208 core root epidermal genes with other microarray-based root epidermis gene sets [52,64,66,67,68] shows that our gene set includes a greater fraction of genes expressed at early develop-mental stages as well as non-hair cell genes (Figure S8; Table S10). This likely reflects the ability of our WER::GFP-based FACS method to acquire both types of epidermal cells at all stages of differentiation, as opposed to other approaches that focus on the root hair cell type and at later stages of development.
A general observation from our gene list and the resulting network is that the differentiating non-hair cells and hair cells exhibit distinct gene expression patterns (Figure 8). This is particularly evident in the several instances of gene family member-specific expression; for example, each cell type expresses distinct expansin genes (EXPA10in non-hair cells vsEXPA7and EXPA18 in hair cells) and arabinogalactan cell wall proteins (AGP13in non-hair cells vsAGP3in hair cells). This observation suggests that non-hair cells should not be considered as merely developmentally-arrested hair cells or hair cells that lack a root hair, rather, they arise from a specific gene expression program.
We have also uncovered fundamental features of the organiza-tion of the root epidermis network. As expected from their strong mutant phenotypes, the RHD6 and GL2 transcription factors act at pivotal positions in the network, positively regulating a large fraction of genes involved in root hair and non-hair cell differentiation, respectively. However, they do not control all of the genes associated with each of these processes, which leads to multiple branches in the epidermal gene network (Figure 8). In particular, our finding of GL2-dependent and GL2-independent branches of non-hair cell differentiation is consistent with prior speculation, principally derived from observations thatgl2mutants do not completely convert non-hair cells to hair cells [12,17,69]. An unexpected feature of RHD6 and GL2 action in this network is their transcriptional repression of genes associated with the alternate cell types; the rhd6 mutant alters some non-hair cell transcripts and the gl2 mutant alters some hair cell transcripts (Figure 8). The strong inverse association between AT1G16360 expression (aLEM3/CDC50related non-hair gene in Cluster M) and root hair length in our Bayesian network analysis (Figure 6) provides further support for the importance of RHD6-mediated inhibition of non-hair genes in the differentiating hair cells. A Gene Regulatory Network for the Root Epidermis
Together, these findings suggest a previously unrecognized level of coordinated gene regulation that may be important to ensure robust adoption/differentiation of distinct cell types.
Another general feature of the root epidermal network relates to the lack of evidence for transcriptional feedback from the downstream genes to the early acting transcriptional regulators. Specifically, none of the nine downstream mutants (cobl9, cow1, csld3, ire1, lrx1, mrh1, mrh2, mrh3, rhd2) significantly alter the transcript level of any of the GL2,RHD6,MYC1,TTG2,ETC1, orTRYgenes. This suggests that,
once cell fate is established by the early regulators, there is little feedback regulation (at least at the transcriptional level) by genes acting at late stages. Interestingly, we did discover an exceptional group of six root-hair genes whose transcripts are significantly affected by at least six of the nine downstream gene mutants we examined (shown as Cluster N in Figure 8). Given the robust transcriptional response of these genes to perturbations in root hair morphogenesis genes, they may define a core group of root hair genes that are particularly sensitive to root hair growth abnormalities. Figure 7. Developmental time-course of transcript accumulation for the 208 core root epidermal genes.(A) Heirarchical clustering of the 208 core root epidermal genes according to transcript accumulation in transverse sections along the longitudinal axis of wild-type Arabidopsis root tips. Clusters of genes with similar developmental expression profiles define six major developmental zones. The root section data were obtained from two independent roots [64], and the 12 sections from each root (numbered 1–12) are organized according to their developmental position in this figure from left to right (along the x-axis). The 208 genes are highlighted in green (for root-hair genes) or yellow (for non-hair genes). (B) The approximate location of cells along the root axis of the zones showing maximal transcript accumulation for the six major clusters of root epidermal genes shown in (A). The position of the bars along the root axis was estimated from the data in panel (A) and reference [64]. doi:10.1371/journal.pgen.1002446.g007
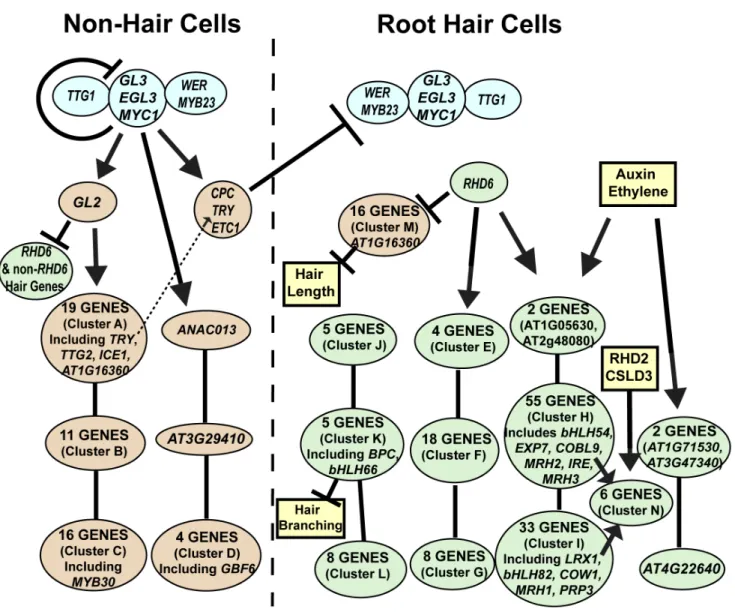
Figure 8. Model of the root epidermal gene network.The predicted transcriptional relationships are shown for the 154 core root hair genes (green), the 54 core non-hair genes (orange), the early acting transcription factors (blue), and other factors not formally part of the network (yellow). The location of genes along the y axis of the figure indicates the relative timing of maximal gene expression during root epidermis development. Genes or gene clusters connected by lines without arrowheads represent genes at a common transcriptional regulatory position but differing in their temporal expression (Zones 1/2, 3/4, and 5/6, from top to bottom). The lists of specific genes in each cluster (A–N) are provided in Table S8, and the GO classes overrepresented in each cluster is given in Table S9.
doi:10.1371/journal.pgen.1002446.g008
A Gene Regulatory Network for the Root Epidermis
Our analysis of auxin and ethylene treatments provides insight into the molecular basis for their well-known ability to promote root hair formation [39,42,43,51]. We discovered substantial overlap in the root epidermal genes affected by these two distinct hormones (.90% overlap), which suggests a common molecular response of the root epidermal network to each of these, perhaps due to the known linkage between auxin and ethylene biosynthesis in roots (reviewed in [70]). Interestingly, we find that these hormones exclusively affected root hair genes, demonstrating the sensitivity of the root-hair cell type to auxin/ethylene. Given that auxin/ethylene largely affect RHD6-dependent genes (Figure 8), it is possible that RHD6 makes root hair cells more sensitive to these hormones, which might explain why a high exogenous concen-tration of these hormones induces hair initiation inrhd6. Further, it is notable that all of these hormone-responsive genes act downstream of the early transcriptional regulators (Figure 8), which provides support for the view that these plant hormones do not drive cell fate decisions, but they modify the cell differentiation processes that are initially directed by the early regulators.
A Suite of bHLH Genes Regulates Root Epidermis Development
Among our collection of root epidermal genes, we have shown that a set of bHLH genes participate in distinct phases of root epidermis development. Specifically, we identified genes in three subfamilies of the Arabidopsis bHLH family (subfamilies IIIf, VIIIc, and XI [53]) that are required for epidermal cell fate and/ or root hair cell differentiation.
With respect to the bHLH subfamily IIIf, we discovered a new role for one of its members, MYC1, in the specification of root epidermal cells. The ectopic hair formation in themyc1 mutant indicates that MYC1 is required to specify the non-hair cell fate. Our expression and promoter-reporter analyses show thatMYC1is expressed in the differentiating hair cells and is negatively regulated by WER and positively regulated by CPC/TRY. These characteristics are similar to theGL3andEGL3genes, two other known genes in the subfamily IIIf [23,24], and we discovered that myc1 can enhance the effect of gl3 or egl3 on root epidermal patterning. Furthermore, a prior study showed that, like the GL3 and EGL3 proteins, MYC1 can interact with WER and other R2R3 MYB proteins in yeast [71]. Altogether, these findings suggest that MYC1 acts redundantly with GL3 and EGL3 to direct the non-hair cell fate via its expression in the hair cell, and possible movement to the non-hair cells, which may be important for mutual support of neighbor cell fates for robust cell pattern formation [72]. Interestingly, GL3, EGL3, and MYC1 also regulate trichome spacing, though in this process, they are expressed in the same cells (trichomes) that they help to specify [73].
For the bHLH subfamily VIIIc, which includes the root hair initiation gene RHD6, we identified bHLH54, bHLH84, and bHLH85 as additional genes required for normal root hair formation. Mutations affecting any one of these cause abnormal root hair morphogenesis, suggesting that these genes regulate at least a subset of hair genes. Although we cannot placebHLH84 andbHLH85within our network (because they are not represented on the microarray chip), thebHLH54gene appears to encode a relatively late-acting transcriptional regulator of hair cell differen-tiation (Figure 8). Our findings are consistent with recent work suggesting bHLH54/RSL4is a regulator of root hair elongation, because it generates longer hairs when overexpressed [66]. Furthermore, transcription from bHLH54 and bHLH85 (also known as RSL2/AT4G33880) was shown to be controlled by RHD6 and the RHD6-related RSL1 [66].
In the bHLH subfamily XI, we discovered that bHLH66, bHLH69, andbHLH82 are each involved in root hair formation. ThebHLH66gene is particularly interesting because its expression is RHD6-independent, and it may therefore control its own branch of the hair differentiation process. Furthermore, this bHLH66-dependent pathway appears to have a strong connection to root hair branching, because our Bayesian network analysis showedbHLH66expression is the strongest (negative) predictor of hair branching. Interesting, thebHLH66,bHLH69, andbHLH82 bHLH genes were found to be functionally similar to a Lotus japonicus bHLH (called Ljrhl1) that is required for root hair formation [74]. Furthermore, multiple mutants containing at least two of these three caused defects in root hair elongation in Arabidopsis, although single mutants of each of these lacked a visible phenotype [74]. Our ability to observe mutant phenotypes for these single mutant lines in this study may be due to our more quantitative analysis of root hair development (Figure 3).
It is notable that members of the bHLH superfamily are now known to participate at many stages of epidermis development, not only at the early stages of cell specification and hair initiation as previously known. The apparent evolution of the root epidermis differentiation pathway to utilize many different bHLH transcrip-tion factors is similar to recent findings in Arabidopsis stomatal development, where a series of bHLHs coordinate cell state transitions during guard cell specification and differentiation [75]. Although the specific bHLH genes employed in these two systems are distinct, the general similarity in the use of bHLHs in root and leaf epidermal development suggests that the sequential action of bHLH proteins to trigger specific cell differentiation events may represent a common strategy for regulating the progression of plant cell differentiation.
Lessons from the Construction of the Arabidopsis Root Epidermal Gene Network
There are many challenges in the construction of gene regulatory networks. One challenge is to ensure that the correct genes are included as members of the network. In our case, we used two strategies to constrain our gene set to help ensure the included genes are involved in root epidermis cell differentiation. First, we used RNA fromWER::GFPmarked cells via a FACS-based method, which limited the number of cells to those in the developing epidermis and lateral root cap. Although the WER::GFPmarker is preferentially expressed in the differentiating non-hair cells, it is significantly expressed in the differentiating hair cells as well [17], and our ability to robustly identify previously defined root-hair cell genes in our datasets suggest that GFP accumulation in the root hair cells is sufficient for capture using our cell sorting approach. Further, we required that all of the included genes be regulated by the known early cell fate transcription factors, by demanding significant differential tran-script accumulation in all three non-hair fate mutants (wer myb23, gl3 egl3, andttg) relative to the hair fate mutant (cpc try) in two independent labs. Still, it is likely that some genes involved in root epidermal differentiation are not included in our network, due to non-transcriptional regulation, transcript instability during proto-plast isolation, or the absence of the gene from the ATH1 gene chip. Indeed, we showed that three genes (bHLH69,bHLH84, and bHLH85) not represented on the ATH1 chip are involved in root epidermis development.
define the regulatory relationships between the genes. One advantage of this approach is its likely low level of false positives; that is, if a gene’s transcript is significantly altered in a given mutant background, it is very likely to be a (direct or indirect) target. In contrast, indirect methods to assess effects on gene transcription (e.g. promoter binding assays or genome-wide ChIP methods) have been reported to yield a high proportion of false positives ([76,77]. A drawback of the reliance on a mutant-based approach is genetic redundancy, because the presence of a redundantly acting gene prevents the full effect of a mutated gene to be observed. We have some indication that this was problematic in our analysis; the likely redundancy between MYC1 and the GL3/EGL3genes probably prevented a complete understanding of the role of MYC1 by analyzingmyc1-related transcript changes.
A strategy we used to reduce the complexity of the network construction problem was to incorporate temporal gene expression data into the analysis. The principle behind this strategy is that, if expression of gene X generally precedes expression of gene Y during development, then an edge from gene X to gene Y is assumed to be more likely. As a specific example in support of this strategy, we know from biological experiments that the maximal RNA levels forWER,GL3, andEGL3occur earlier [17,23] than forRHD6[41] which itself is earlier than the maximal RNA level forPRP3[49], and, indeed, this gene order is consistent with the positions of these genes in the network hierarchy (Figure 8).
The root epidermis system appears to provide a relatively simple gene network that may serve as a model for the construction and analysis of more complex networks in Arabidopsis. In principle, the general approach used here, to define the components and organization of a network via genetic and hormonal perturbation, and incorporating temporal gene expression data, may be generally applicable for other developmental or metabolic networks in Arabidopsis.
Materials and Methods
Plant Material and Growth Conditions
Information concerning theArabidopsis thalianamutant lines used in this study is listed in Table S1. Mutant and transgenic T-DNA lines were obtained from the Arabidopsis Biological Resource Center (ABRC) at Ohio State University. The WER::GFP construct and transgenic line have been previously reported [17]. The sameWER::GFPtransgene was incorporated into each of the mutant lines by crossing with a specific WER::GFP transgenic line, which contains a single transgene on chromosome five. The bHLH gene designations used here follows the naming convention initially established for this gene family [78]. At least two independent mutants were analyzed for each gene; one each was selected for detailed characterization and is presented here. Each insertion mutant line was verified as homozygous using PCR with primers specific for each gene.
Seeds were surface-sterilized, incubated for two days at 4uC, and sown on MS media solidified with 0.6% agarose under sterile conditions as previously reported [56]. Seedling roots were analyzed for phenotypic characters or used for gene expression analyses after four or five days of growth at 22uC under continuous illumination. Plants were grown to maturity under a photoperiod of 14 hours of light (22uC) and 10 hours of dark (18uC).
Root Epidermis Analysis
The characterization of root epidermal pattern, root hair length, and root hair branching in the wild-type and mutant lines essentially followed established protocols [36,47,69]. Briefly, to characterize the distribution of root-hair cells and non-hair cells,
10 cells in the H position and 10 cells in the N position were assessed in each of 15–20 4-day-old seedling roots for each line. Root hair length was determined by measuring 10 individual hairs from the mature region of each of 30–40 4-day-old seedling roots. Photographs of roots, and a length standard, were used to make measurements using the Scion Image software (www.scioncorp. com). For the analysis of root hair branching, 50 root hairs were examined per root in each of 9 seedlings (450 total hairs). If a root hair possessed a branch, no matter its length or location, it was classified as a branched hair. Each of these analyses was carried out three independent times to minimize the impact of environmental variation.
Confocal Microscopy
To examine GFP accumulation in seedling roots, 4- or 5-day old seedlings were counterstained with propidium iodide for 5 min and examined with a Zeiss LSM510 Meta confocal microscope with excitation at 488 nm and detection with a 500–530 nm band-path filter for GFP, and with excitation at 543 nm and detection with a 560 nm long-path filter for propidium iodide [17].
Gene Constructs and Plant Transformation
To assess the expression pattern ofMYC1, an ER-tagged version of the GFP coding region (mGFP5-ER) was inserted between a 2.7 kb 59flanking genomic DNA fragment ofMYC1and the NOS terminator sequence [79]. Plant transformation was performed by the floral dip method as previously described [80] using the plasmid pCB302 as the binary vector [81].
Reverse Transcriptase PCR
Total RNA was isolated using TRIzol reagent (Invitrogen, Inc.) from the roots of 4-day-old wild-type (Columbia) andgl2mutant seedlings. The RNA was treated with RQ1 DNase (Promega, Inc.), and 2mg RNA was used for cDNA synthesis with Superscript II-reverse transcriptase (Invitrogen, Inc.) and an oligo (dT)12–18 primer (Invitrogen, Inc.). Equal amounts of cDNA were subjected to standard PCR reactions using primers specific for ACTIN4(forward: 59-GCCGATGGTGAGGATATTCAT-39; re-verse: 59-CATACCCCTCGTAGATTGGC-39) andMYB30 (for-ward: 59-ACCAAGAGGGGTCAGCAAATTTCTC-39; reverse: 59-CATGTTCTGTGAAATTGCCTCTTTTG-39) and using a variable number of cycles to establish linear range of product.
Microarray and Bioinformatics Analyses
Three biological replicates were conducted for each plant line used for microarray gene expression analysis. The four founda-tional lines (wer myb23, ttg, gl3 egl3, andcpc try) were analyzed at both the University of Michigan and Duke University (total of six biological replicates for each line). RNA for the microarrays were obtained from protoplasts derived from differentiating root epidermal cells using a fluorescence-based cell sorting procedure essentially as previously described [45,82]. Briefly, for each replicate, root tips from approximately 1000WER::GFP -express-ing seedl-express-ings were pooled, then subjected to cell wall degrad-express-ing enzymes and GFP-based cell sorting on a BD FACS machine. RNA was extracted using the Qiagen RNeasy Micro Kit and amplified using the Affymetrix Small Sample Labeling Protocol VII and its quality was verified by capillary electrophoresis using a Bioanalyzer 2100 (Agilent). Sample preparation for cDNA preparation, hybridization, and detection to the Arabidopsis ATH1 GeneChip were according to Affymetrix (Santa Clara, CA) protocols. GeneChips were scanned using the Affymetrix 3000 7G GeneChip Scanner with Autoloader. Raw images (CEL A Gene Regulatory Network for the Root Epidermis
format) were generated with Affymetrix GeneChip Operating Software.
The probeset summaries from the Affymetrix ATH1 Arabi-dopsis microarray data were computed using the RMA (Robust Multichip Average) method with quantile normalization [83]. Custom probeset definitions were used for data preprocessing [84]. All values subsequently analyzed were log2scale expression levels. The multi-way significance analysis of microarrays (SAM) test was arranged to consider thecpc trydataset as one (hairless) class and thegl3 egl3,wer myb23, andttgdatasets as another (hairy) class [85]. Scores were analyzed in terms of False Discovery Rate (FDR) q-values [86]. For comparison of microarray datasets from individual genotypes, gene transcript levels were considered to be significantly different at a 5% FDR level and/or p,0.01.
Hierarchical clustering of the genes and samples was performed using the GenePattern suite of tools [87,88]. GO term enrichment analysis was performed using an online tool at: http://amigo. geneontoloty.org/cgi-bin/amigo/term_enrichment with the TAIR GO annotations (http://www.arabidopsis.org/tools/bulk/go/in dex.jsp) and application of Fisher’s exact test (http://en.wikipedia. org/wiki/Fisher’s_exact_test). Multidimensional scaling (MDS) of the triplicate sets of microarray data was performed using the MATLAB Statistics Toolbox (http://www.mathworks.com/help/ toolbox/stats/mdscale.html) using data from the 208 core root epidermal genes.
Bayesian Network Analysis
The Bayesian network analysis was performed using the Pebl software environment datasets (http://jmlr.csail.mit.edu/papers/ v10/shah09a.html) [89,90]. All of the microarray datasets from wild-type and knockout mutants (n = 66) were used to define interactions in a 219 node network, which included the 208 core root epidermal genes, 7 genes representing knockout mutants but not part of the core genes, 2 hormone treatments (ACC and IAA), and 2 morphological characters (hair length and degree of hair branching). The gene expression data was discretized to three states (low, medium, and high), the hormone and branching nodes were discretized into two states, and the hair length node was discretized into four states. The genes (nodes) that were knocked out in a particular sample were made explicit to the network learner. The phenotype nodes were constrained to be ‘‘child’’ nodes and the hormone treatments as ‘‘parent’’ nodes in the network; the remaining nodes were unconstrained. A combination of ‘‘greedy’’ and ‘‘simulated annealing’’ (SA) learners was used to learn the network structure from local environments. Several thousand hours of computation on an Apple G5 machine were used to examine more than 109random networks and find edges appearing in at least 40% of the 42,000 highest scoring networks. This required percentage was chosen because a higher percentage led to a large number of small networks, whereas a lower percentage led to a highly connected network. The connections in the final networks were identified using a consensus approach across all the top scoring networks.
The integrated regulatory network (presented in Figure 8) was primarily generated from the transcriptome perturbation exper-iments (using mutants and hormone treatments) and the temporal expression data (using sections along the longitudinal axis of the root). Gene clusters were defined by genes that shared a common transcriptional regulatory position (based on their response in the perturbation experiments) and a common zone of temporal expression. To simplify this model, only three developmental zones were used, by combining genes expressed in zones 1 and 2, zones 3 and 4, and zones 5 and 6 (as defined in Figure 7). The lists of specific genes in each cluster (A–N) are provided in Table S8,
and the GO classes overrepresented in each cluster is given in Table S9.
Microarray Data Accession Numbers
The microarray-based data generated in this study has been deposited in the Gene Expression Omnibus (http://www.ncbi. nim.nih.gov/geo/) under the series record GSE30547 and include accession numbers GSM757819 through GSM757893 containing data from 75 individual samples.
Supporting Information
Figure S1 Phenotypic characterization of Arabidopsis mutant lines used for microarray gene expression analysis. (A) Images of individual root hairs from wild-type and mutant lines. The hairless cpc tryandrhd6mutants are not included. Bar = 20mm. (B) Percent of branched root hairs produced in mutant roots. For each line, 450–800 root hairs were examined. Mutants marked with an asterisk exhibited a significantly greater fraction of branched hairs than the wild type (p,0.005). The hairlesscpc trymutant was not analyzed. (C) Pattern of root epidermal cell types in the wild-type and mutant lines. The percent of root-hair cells (gray bars) and the percent of non-hair cells (open bars) located in the H cell position and the N cell position are indicated. The bHLH66 line is not included in panels B and C, because these data are presented in Figure 3.
(TIF)
Figure S2 Expression of the WER::GFPtransgene in the root epidermis of the Arabidopsis wild-type and mutant lines used in this study. Confocal microscope images at a median longitudinal view (left) and at an epidermal surface view (right) show that each of these exhibit a similar level and pattern of GFP accumulation. All images are at the same magnification. Bar = 50mm.
(TIF)
Figure S3 Cell type pattern in the root epidermis of bHLH mutants. The percent root hair cells and non-hair cells in the H and the N cell files was determined. Asterisks indicate lines with statistically significant differences (p,0.05).
(TIF)
Figure S4 Effect ofgl2onMYB30RNA accumulation. RT-PCR was used to assess the relative level ofMYB30RNA in the seedling root of WT and gl2 mutants. ACTIN4 was used as a loading control (left lanes) and control samples lacking reverse transcrip-tase were also analyzed (right lanes). This image is a representative result from three separate trials.
(TIF)
Figure S5 Heirarchical clustering of 208 core root epidermal genes from three replicates of ATH1 microarray assays for each of 18 mutant and wild-type lines (54 chips total). This represents an expansion of the data presented in Figure 4C, which depicts the mean expression values. The specific microarray sample numbers are indicated with the genotypes.
(TIF)
Figure S6 Multidimensional scaling analysis of the 21 micro-array datasets. Transcript accumulation data for the 208 core epidermal genes was analyzed from the 21 mutants, wild-type, and hormone treated lines. For each dataset, the round symbols indicate each of the three replicates and the square symbol represents the mean of the three replicates.