ORIGINAL ARTICLE
Salt Tolerance Evaluation in Cotton (Gossypium
hirsutum L.) Using RAPD Marker
Basel Saleh
Department of Molecular Biology and Biotechnology, AECS, P.O. Box 6091, Damascus, Syria
*E-Mail:
[email protected]
Received September 3, 2015
The aim of this study was to evaluate four upland cotton (Gossypium hirsutum L.) [Niab78
(N78), Deir-Ezzor22 (DE22), Deltapine50 (DP50) and Aleppo118 (A118)] varieties towards
salt stress (0 and 200 mM NaCl) for 7 weeks based on RAPD marker. Our data showed that
the highest total polymorphic bands identified by the 26 RAPD tested primers were 150
bands generated by N78 variety, while the lowest ones were recorded for DP50 (29 bands).
Otherwise, unique (negative and positive) markers characterized the two tolerant varieties
(N78 and DE22) were 22 and 29 markers, respectively. Our data indicated that the highest
polymorphism level was detected in N78 variety (68.5%) followed by DE22 (60.9%), whereas,
the lowest one was recorded for DP50 (21.3%). Our data obtained herein indicates that
RAPD marker provided molecular markers for salinity tolerance screening in early stage in
genetic improvement programs.
Cotton is an economically important plant grown
world-wide as a principal source of staple fiber and
vegetable oil. A great deal of effort has been made to
improve cotton cultivation and characteristics by
breeders. Cotton is one of the major fiber crops in
Syria, with a cultivated area amount to 125,000
hectares, and a production of 470,000 tons of seed
cotton and lint production is estimated at 160,000
tons. Yarn spinning capacity is estimated at 180,000
tons (USDA 2011). Salinity tolerance is a complex
trait that involves physiological, biochemical, cellular
and genetic strategies. At present, out of 1.5 billion
hectares of cultivated land around the world, about 77
million hectares (5%) is affected by excess salt
content (Moradi et al., 2011). The effect of high salt
concentration on plant physiology has been
mentioned in many reports e.g. in cotton (Dojan et al.,
2012; Saleh 2011, 2013). Random Amplified
Polymorphic DNA (RAPD) technique previously
developed (Williams et al., 1990) is a sensitive, fast
and simple method to indicate wide range of DNA
damage types. Many investigations detected
variations in gain or loss of DNA bands following salt
exposure, these losses or gains can be considered as
an indicator for DNA changes (Kurup et al., 2009;
Daffalla et al., 2011; Dojan et al., 2012, Khan et al.,
2013; Abdel-Hamid 2014). Different PCR-based
marker systems are currently available for monitoring
DNA damages induced by an abiotic stress such as
salt stress e.g. QTL marker in rice (Hu et al., 2012),
RAPD technique in rice (Mansuri et al., 2012), RAPD
in wheat (Triticum aestivum L.) (El-Amin et al., 2011),
SSR in wheat (Shahzad et al., 2012), and ITS and
ETS markers in Acacia sp. (Joseph et al., 2013).
Moreover, SDS-PAGE, isozymes and RAPD markers
were employed to detect DNA damages induced by
heat stress in cotton (Mohamed and Abdel-Hamid
2013).
In the current study, RAPD marker system was
employed to provide genetic diversity information for 4
cotton varieties cultivated in Syria. These varieties
were selected based on their differences in the level of
salinity tolerance (Saleh 2011). The data gained from
this investigation may provide useful information for
selecting appropriate varieties in breeding program
for improving salt tolerance of elite varieties based on
genetic variations in salt tolerance levels.
MATERIALS AND METHODS
Plant materials and growth conditions
Two local varieties have been selected on the
basis of their wide range of tolerance towards salinity;
Deir-Ezzor22 (DE22) as salt-tolerant and Aleppo118
(A118) as salt-sensitive variety (Saleh 2011). These
two varieties were examined compared with two
introduced cotton varieties, Niab78 (N78) (known as
tolerant) and Deltapine50 (DP50) (known as
salt-sensitive) under 0 and 200 mM NaCl for 7 weeks.
Seeds of upland cotton (G. hirsutum L.) N78, DE22,
DP50 and A118 varieties were provided by the
General Commission for Scientific Agricultural
Research of Syria (GCSAR), Damascus-Syria. Seeds
were soaked in distilled H2O for 24 h and then planted
in pots filled with a 1/3:2/3 (v/v) mixture of perlite:peat
mosse. Germination was carried out in a greenhouse
humidity of 80%. Seedlings were allowed to grow in a
greenhouse under controlled conditions (temperature
of 25°C, 12 h photoperiod and relative humidity of 80
%). Seedlings were irrigated with tap water for one
week before the initiation of NaCl treatment. Salt
stress application was carried out by adding NaCl
(200 mM) to the water. Plants were irrigated twice a
week by water with or without salt. All solutions were
changed twice a week. The same environmental
conditions were maintained during the experiment.
The experiment (five replicates by treatment) was
carried out in the greenhouse for 7 weeks.
DNA isolation
Plant genomic DNA was extracted from (bulk of 5
plants/ variety) young leaves including the control and
stressed plants (200 mM NaCl) for the four tested
cotton varieties by a CTAB (cetyltrimethylammonium
bromide) protocol as described by Doyle and Doyle
(1987) with minor modifications. Leaves tissue (150
mg) were ground in liquid nitrogen, the powder was
transferred to a 2 mL Eppendorf tube, mixed with 900
μL of extraction buffer (100 mM Tris-HCl, pH 8.0, 1.4
M NaCl, 20 mM EDTA, 0.0018 ml β-mercaptoethanol,
2% CTAB), and incubated at 65 °C for 20 min. DNA
was extracted with one volume of a
chloroform:isoamyl alcohol mix (24:1, v/v) and
centrifuged at 12,000 g for 10 min at 4 °C. The
aqueous phase was transferred to a fresh tube, and
the DNA was precipitated with an equal volume of
cold isopropanol and kept at -20 °C for 10 min. Then
centrifuged at 12,000 g for 10 min at 4 °C, the
supernatant was discarded, DNA was then spooled
out and washed with 1 M ammonium acetate and
100% ethanol. The cleaned DNA pellet was air dried
and dissolved in 100 μL of 0.1x TE buffer (1 mM
Tris-HCl, 0.1 mM EDTA, pH 8.0). After addition of 5 μL of
RNase (10 mg/ mL), and incubation for 30 min at 37
°C. DNA concentration was quantified by DNA
Fluorimeter at 260/280 nm and adjusted to final
concentration of 10 ng/ μL. DNA was stored at -80 °C
until needed.
RAPD assay
Twenty-three RAPD primers belonging to Operon
Technologies Inc. USA and three primers from UBC
(University of British Columbia) were tested for
detection DNA changes in stressed plants and their
respective control for 4 cotton varieties. RAPD marker
was performed as described by Williams et al. (1990)
with a minor modification. PCR amplification reaction
was carried out in 25 μL reaction volume containing
1xPCR buffer, 2 mM MgCl2, 0.25 mM dNTPs
(Fermentas, USA), 25 pmol primer, 1.5 U of Taq DNA
polymerase and 30 ng template DNA. PCR
amplification was performed in a T-gradient thermal
cycler (Bio-Rad, Hercules, USA). It was programmed
to 42 cycles after an initial denaturation cycle for 4 min
at 94 °C. Each cycle consisted of a denaturation step
1 min at 94 °C, an annealing step for 2 min at 35 °C,
and an extension step at 72 °C for to 2 min, followed
by extension cycle for 7 min at 72 °C in the final cycle.
The PCR products were separated on a 1.5%
ethidium bromide- stained agarose gel (Bio-Rad,
USA) in 0.5xTBE buffer. Electrophoresis was
performed for 3 h at 85V and visualized with a UV
transilluminator. Band sizes were determined by
(Fermentas, USA).
RESULTS
A set of 26 random10-mer primers was used for
detecting the DNA changes among four cotton
varieties under salt stress application compared to
their respective control. RAPD fragment sizes ranged
from 200-3000 bp. The generated variant bands
characteristics for each variety for the four varieties
were summarized in Table 1. Otherwise, unique
(negative and positive) markers characterized the two
tolerant varieties were summarized in Table 2.
Moreover, total number of bands amplified, number of
polymorphic bands and proportion of polymorphic
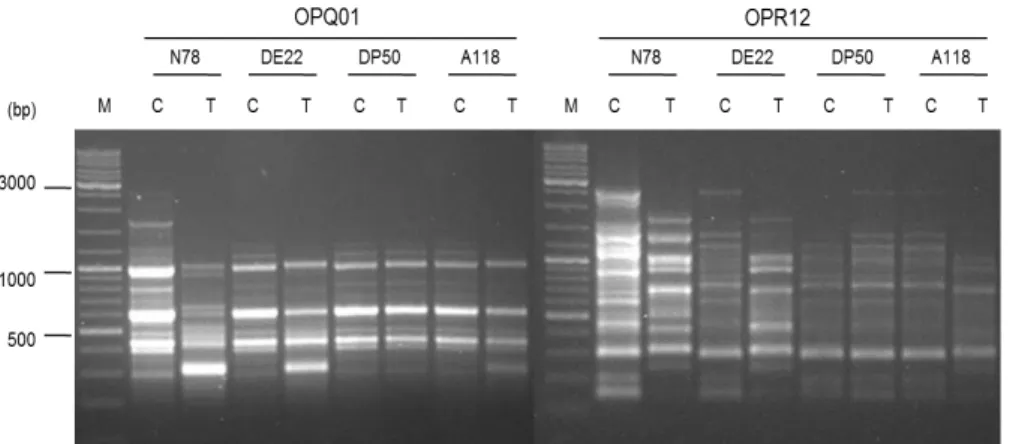
bands (P%) were presented in Table 3. Fig. 1 shows
the amplification products using OPQ01 and OPR12
RAPD primers with template DNA from the four
varieties under control and saline conditions (200 mM
NaCl).
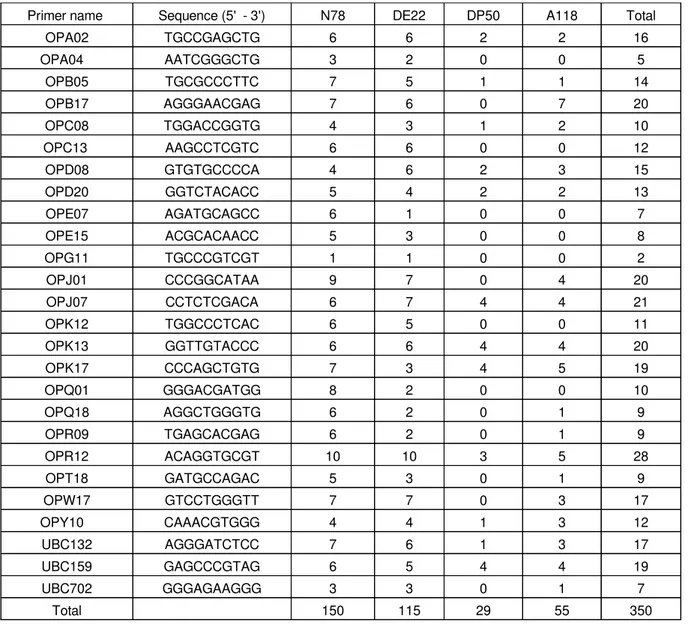
Table 1.
Number of variant bands identified by 26 RAPD primers for the four tested cotton varieties
under 200 mM NaCl compared to their respective control
Primer name Sequence (5' - 3') N78 DE22 DP50 A118 Total
OPA02 TGCCGAGCTG 6 6 2 2 16
OPA04 AATCGGGCTG 3 2 0 0 5
OPB05 TGCGCCCTTC 7 5 1 1 14
OPB17 AGGGAACGAG 7 6 0 7 20
OPC08 TGGACCGGTG 4 3 1 2 10
OPC13 AAGCCTCGTC 6 6 0 0 12
OPD08 GTGTGCCCCA 4 6 2 3 15
OPD20 GGTCTACACC 5 4 2 2 13
OPE07 AGATGCAGCC 6 1 0 0 7
OPE15 ACGCACAACC 5 3 0 0 8
OPG11 TGCCCGTCGT 1 1 0 0 2
OPJ01 CCCGGCATAA 9 7 0 4 20
OPJ07 CCTCTCGACA 6 7 4 4 21
OPK12 TGGCCCTCAC 6 5 0 0 11
OPK13 GGTTGTACCC 6 6 4 4 20
OPK17 CCCAGCTGTG 7 3 4 5 19
OPQ01 GGGACGATGG 8 2 0 0 10
OPQ18 AGGCTGGGTG 6 2 0 1 9
OPR09 TGAGCACGAG 6 2 0 1 9
OPR12 ACAGGTGCGT 10 10 3 5 28
OPT18 GATGCCAGAC 5 3 0 1 9
OPW17 GTCCTGGGTT 7 7 0 3 17
OPY10 CAAACGTGGG 4 4 1 3 12
UBC132 AGGGATCTCC 7 6 1 3 17
UBC159 GAGCCCGTAG 6 5 4 4 19
UBC702 GGGAGAAGGG 3 3 0 1 7
Table 2.
Unique (negative and positive) markers identified by 26 RAPD primers in salt-tolerant (N78 and
D22) varieties under 200 mM NaCl
Primer name Sequence (5' - 3') Unique negative marker (number and size)
Unique positive marker (number and size) OPA02 TGCCGAGCTG (2) 650 & 2500 (1) 600 OPA04 AATCGGGCTG 0 (2) 400 & 500
OPB05 TGCGCCCTTC (2) 450 & 2000 (2) 500 & 1100
OPB17 AGGGAACGAG (1) 1800 0
OPC08 TGGACCGGTG 0 0
OPC13 AAGCCTCGTC (1) 1000 (3) 300, 1100 & 1350 OPD08 GTGTGCCCCA (1) 450 (1) 1350
OPD20 GGTCTACACC 0 0
OPE07 AGATGCAGCC (1) 1800 0
OPE15 ACGCACAACC 0 (1) 1500
OPG11 TGCCCGTCGT 0 (1) 600
OPJ01 CCCGGCATAA (3) 400, 600 & 850 (4) 350, 500, 950 & 1800 OPJ07 CCTCTCGACA (2) 500 & 1600 (1) 1200 OPK12 TGGCCCTCAC (2) 900 & 1350 0
OPK13 GGTTGTACCC (1) 1100 (4) 450, 750, 1200 & 1350
OPK17 CCCAGCTGTG (1) 1850 0
OPQ01 GGGACGATGG (1) 1100 0
OPQ18 AGGCTGGGTG 0 (1) 1600
OPR09 TGAGCACGAG 0 0
OPR12 ACAGGTGCGT (1) 2250 (1) 1800
OPT18 GATGCCAGAC 0 0
OPW17 GTCCTGGGTT 0 (3) 450, 500 & 800 OPY10 CAAACGTGGG (1) 3000 (2) 400 & 2500
UBC132 AGGGATCTCC (1) 3000 0
UBC159 GAGCCCGTAG 0 (1) 700
UBC702 GGGAGAAGGG (1) 800 (1) 2500
Total 22 29
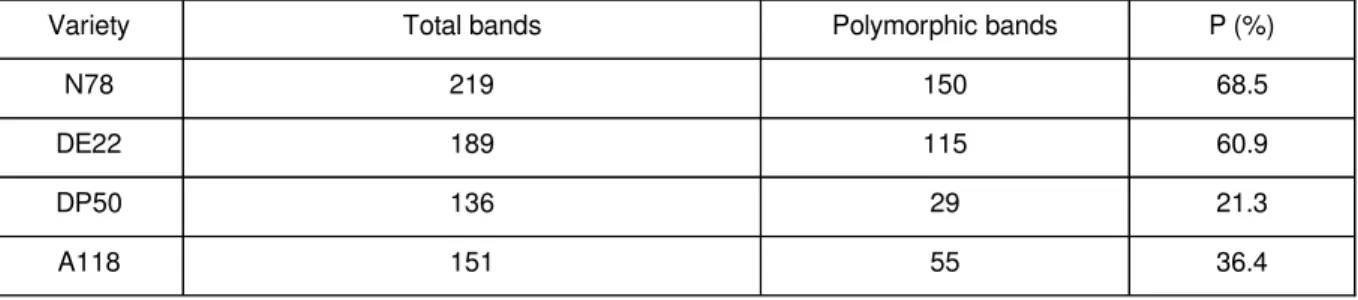
Table 3.
Total number of bands amplified, number of polymorphic bands and proportion of polymorphic
bands (P%)
Variety Total bands Polymorphic bands P (%)
N78 219 150 68.5
DE22 189 115 60.9
DP50 136 29 21.3
Figure 1
. RAPD profiles generated by OPQ01 and OPR12 primers into the four tested cotton varieties
showing DNA changes induced by NaCl application, C: Control, T: Treated plants. M: 1 kb
DNA Ladder Mix, ready to use
DISCUSSION
DNA alterations induced by NaCl stress application
in 4 cotton varieties were evaluated using 26 RAPD
primers. A total of 350 different fragments were
produced with an average of 13.5 bands/primer under
saline conditions as compared to their respective
control. It was obvious noting that OPR12 primer
showed more polymorphism (28) than any other
tested primers (Table 1). The highest polymorphic
identified bands were recorded for N78 and DE22
(salt-tolerant variety) (150 and 115 bands,
respectively), whereas, the lowest ones were recorded
for DP50 and A118 (salt-sensitive variety) (29 and 55
bands, respectively) (Table 1). Our data showed that
OPJ01 primer yielded the highest negative (3) and
positive (4) markers number compared to the other
tested primers. PCR amplification with 26 RAPD
primers showedthat the salt-tolerant varieties (N78 &
DE22) characterized by 22 negative and 29 positive
unique markers compared to the other tested varieties
(Table 2). For unique negative markers, as shown in
Table 2, bands were ranged between 0 (OPA04,
OPC08, OPD20, OPE15, OPG11, OPQ18, OPR09,
OPT18, OPW17 and UBC59) and 2 (OPA02, OPB05,
OPJ07 and OPK12). Whereas, the highest number (3)
was yielded by OPJ01 (Table 2). While, in the case of
unique positive markers, bands were ranged between
0 (OPB17, OPC08, OPD20, OPE7, OPK12, OPK17,
OPQ01, OPR09, OPT18 and UBC132) and 3
(OPC13 and OPW17). Whereas, the highest number
(4) was yielded by OPJ01 and OPK13 (Table 2). It
was noticed that, N78 variety was identified as having
the highest polymorphic bands (150) among the
tested varieties while, the lowest one was recorded for
DP50 (29).
Recently, Abdel-Hamid (2014) tested 6 RAPD
primers for screening markers linked to salinity
tolerance in two barley (Hordeum vulgaris L.) cultivars
salt-tolerant and two salt-sensitive cultivars. Where,
salt stress application was performed by plants
exposure to 9000 ppm NaCl for 40 days after planting.
The later study revealed unique positive markers in
the two salt-tolerant with 970 bp (OPA10), 420 bp
(OPB14), 2100 bp (OPD20) and 640 bp (OPZ11).
number of bands and polymorphism level identified by
RAPD marker (219 bands and P% of 68.5%) was
recorded for N78 variety, while the lowest one was
recorded for DP50 (136 bands) with P% of 21.3%
(Table 3).
Abdel-Hamid (2014) applied 6 RAPD primers for
screening salinity tolerance in 4 barley (H. vulgaris L.)
cultivars differed in their salinity tolerance level;
exposed to 9000 ppm NaCl for 40 days after planting.
The later study mentioned that total number of bands
varied between 5 (OPB08 and OPB14) and 13
(OPD20) with a total of 48 bands. Whereas, P%
values ranged between 37.5 (OPA10) and 100%
(OPB08) with an average of 59%.
Different physiological indices (e.g. fresh and dry
weight, leaf K+
/Na+
ratio and protein pattern
expression) as selection criteria, have been previously
investigated in cotton under salt stress (Saleh 2011,
2013). Our data presented herein are in agreement
with the physiological characteristics previously
exhibited by the examined varieties (N78, DE22,
DP50 and A118) where the former two varieties were
superior to the latter (Saleh 2011, 2013). The
amplified fragments which proved to be specific for
the relatively high salinity tolerant N78 and DE22
varieties, may serve as markers for early
evaluation/screening for salinity tolerance in cotton.
Dojan et al. (2012) reported the potential of RAPD
marker for detection DNA damages induced by NaCl
in cotton. The previous investigation stated that RAPD
analysis could be considered as useful biomarker
assay for observing environmental stresses such as
high salinity in cotton. Whereas, Mohamed and
Abdel-Hamid (2013) reported the effect of heat stress (40
°C) on four cotton genotypes at molecular and
biochemical levels. The later investigation indicated
that, heat treatment caused variation in number,
intensity of protein SDS-PAGE and isozymes activities
bands. Moreover, variation in RAPD profile has been
also detected in all cotton tested genotypes using five
RAPD primers. Whereas, Shahzad et al. (2012)
reported the response of wheat landrace genotypes
towards salt tolerance at vegetative stage based upon
morphological and molecular markers. The later study
mentioned that different selected criteria including the
number of tillers / plant, root length, root fresh and dry
weights, and shoot fresh and dry weights were
associated with salt tolerance. Moreover, SSR
technique showed high genetic variability among
tested wheat genotypes. Where, 12 SSR markers
were found to be associated with salt tolerance.
Moreover, Hu et al. (2012) investigate rice salt
tolerance based on genetics and molecular
approaches. This study allowed identifying more than
70 QTLs controlling the salt related traits of Na+
/K+
contents. While, Joseph et al. (2013) applied two DNA
markers (ITS and ETS) for evaluate 4 species of
Acacia sp towards salinity tolerance and thereby, the
salt tolerant genotypes could be used in the future for
reclamation of saline affected regions. Whereas,
Kurup et al. (2009) used RAPD marker to identify
salinity tolerant in four date palms (Phoenix dactylifera
L.) varieties based on analysis of morphological and
physiological parameters. While, El-Zaeem (2012)
used RAPD technique to identify three genotypes of
tilapia (O. aureus) and their diallel interspecific
hybridization for their salinity tolerance. Likewise,
RAPD marker has the potential to be applied in
environmental pollution detection’s; e.g. Gupta and
Sarin (2009) applied same marker to detect pollution
by cadmium (Cd) in aquatic plants Hydrilla verticillata
and Ceratophyllum demersum. Zhou et al. (2011) also
used RAPD bands for indicating DNA damage in
Euplotes vannus (Protozoa, Ciliophora) induced by
nitrofurazone in marine ciliates. Moreover, Aly (2012)
used the same marker for genotoxic effects detection
of Cd stress on Egyptian clover and Sudan grass
plants. Indeed, Saleh (2013) reported that salt
application induced changes in protein pattern
including decrease, increase or induction of some
polypeptides bands. The later investigation indicated
also that the estimated total dry weight (TDW),
membrane stability index (MSI) and salt tolerance
index (STI) were higher in N78 and DE22 compared
to other tested varieties (DP50 and A118). In addition,
according to GCSAR, DE22 exhibited good
technological traits. It was considered as the highest
local variety in gin turnout percentage and the most
temperature tolerant at vegetative stage compared to
the other cotton varieties. El-Amin et al. (2011)
reported the impact of salt stress on agronomical and
molecular traits in six wheat (T. aestivum L.) cultivars.
The later study revealed the RAPD potential with high
variation among the six cultivars using six RAPD
primers. Indeed, the closer cultivars genetically
grouped in the same cluster had the same trend in
their response to salt stress. Whereas, Mansuri et al.
(2012), reported the rice tolerant genotyping of 21
genotypes at different growth stages using RAPD
marker and some physiological parameters as a
useful tool for rice salinity tolerance screening. The
previous study showed that Na+ and Na+/K+ ratio were
lower in salt-tolerant genotypes than the sensitive
ones in young seedling stage. Moreover, UBC251 and
UBC244 RAPD primers showed genetic variation in
the RAPD pattern among the tested genotypes.
Where, about 1100 pb and 800 bp RAPD bands size
yielded by UBC251 and UBC244, respectively,
allowed to somewhat to discriminate the 21 rice
genotypes tested. According to our results, N78 and
DE22 varieties showed a better protection mechanism
against salinity damage than the other two tested
varieties. All over, the highest polymorphic bands
identified into N78 and DE22 varieties could be
attributed to the fact that genome was much changed
and getting recombinant, translated new proteins.
These protein could be play a major role in protection
mechanism against salt stress damages.
Accumulation of these proteins is a common response
to salt stress (Kong-ngern et al., 2005; Metwali et al.,
2011; Saleh 2013).
The present study showed the capability of RAPD
technique as a useful tool for assessment of DNA
alterations in cotton varieties under saline conditions.
Furthermore, it allows somewhat to differentiate
between cotton salt-tolerant and salt-sensitive
varieties. Overall, RAPD technique has proven an
important approach for detecting of DNA changes
under salt stress. Consequently, the identified unique
makers observed in N78 and DE22 (salt-tolerant
Similar findings were recently reported by
Abdel-Hamid (2014) in barley who stated that observed
induced DNA changes by salt stress could be
associated with some genes involved in barley salinity
tolerance. Thereby, N78 and DE22 varieties could be
considered as appreciated and promised selected
varieties that may be introduced in breeding program
for enhancing salinity tolerance in cotton.
REFERENCES
Abdel-Hamid, A.M.E. (2014) Physiological and
molecular markers for salinity tolerance in four
barley cultivars. Euro. Sci. J., 10: 252-272.
Aly, A.A. (2012) Application of DNA (RAPD) and
ultrastructure to detect the effect of cadmium
stress in Egyptian clover and Sudan grass
plantlets. J. Stress. Physiol. Biochem., 8:
241-257.
Daffalla, H.M., Habeballa, R.S., Elhadi, E.A. and
Khalafalla, M.M. (2011) Random amplified
polymorphic DNA (RAPD) marker associated
with salt tolerance during seeds germination and
growth of gelected Acacia senegal provenances.
Afr. J. Biotechnol., 10: 5820-5830.
Dojan, I., Kekec, G., Ozyigit, I.I., Sackali, M.M. (2012)
Salinity induced changes in cotton (Gossypium
hirsutum L.). Pak. J. Bot., 44: 21-25.
Doyle, J.J. and Doyle, J.L. (1987) A rapid DNA
isolation procedure for small quantities of fresh
leaf tissue. Phytochem. Bull., 19: 11–15.
El-Amin, H.K.A, Hamza, N.A. and Abuali, A.I. (2011)
Molecular and agronomical assessment of six
wheat (Triticum aestivum L.) cultivars under
salt-stress conditions. Int. J. Agric. Res., 6: 163-171.
El-Ezaeem, S.Y. (2012) Identification of different
selected genotypes of salinity resistance of each
of full-sib Nile tilapia, Blue tilapia and their diallel
interspecific hybridization using random
amplified polymorphic DNA fingerprinting. Afr. J.
Biotechnol., 11: 8645-8652.
Gupta, M. and Sarin, N.B. (2009) Heavy metal
induced DNA changes in aquatic macrophytes:
Random amplified polymorphic DNA analysis
and identification of sequence characterized
amplified region marker. J. Environ. Sci., 21:
686–690.
Hu, S., Tao, H., Qian, Q. and Guo, L. (2012) Genetics
and molecular breeding for salt-tolerance in rice.
Rice. Gen. Genet., 3: 39-49.
Joseph, S., Murphy, D.J., Miller, J.T. and Bhave, M.
(2013) Application of molecular markers for
identification of potential salt tolerant plant
species for use in agroforestry and saline land
reclamation. APCBEE Procedia.,5: 514 – 519.
Khan, F., Hakeem, K.R., Siddiqi, T.O. and Ahmad, A.
(2013) RAPD markers associated with salt
tolerance in soybean genotypes under salt
stress. Appl. Biochem. Biotechnol., 170:
257-272.
Kong-ngern, K., Daduang, S., Wongham, C., Bunnag,
S., Kosittrakun, M. and Theerakulpisut, P. (2005)
Protein profiles in response to salt stress in leaf
sheaths of rice seedlings. ScienceAsia., 31:
403-408.
El-Heawiety, A.Y., Aly, M.A.M. and Alhadrami, G.
(2009) Morpho-physiological evaluation and
RAPD markers-assisted characterization of date
palm (Phoenix dactylifera L.) varieties for salinity
tolerance. J. Food. Agr. Environ., 7: 503-507.
Mansuri, S.M., Jelodar, N.B. and Bagheri, N. (2012)
Evaluation of rice genotypes to salt stress in
different growth stages via phenotypic and
random amplified polymorphic DNA (RAPD)
marker assisted selection. Afr. J. Biotechnol., 11:
9362-9372.
Metwali, E.M.R., Eid, M.H. and Bayoumi, T.Y. (2011)
Agronomical traits and biochemical genetic
markers associated with salt tolerance in wheat
cultivars (Triticum aestivum L.). Aust. J. Basic.
Appl. Sci., 5: 174-183.
Mohamed, H.I. and Abdel-Hamid, A.M.E. (2013)
Molecular and biochemical studies for heat
tolerance on four cotton genotypes. Rom.
Biotech. Lett., 18: 8823- 8831.
Moradi, A,, Tahmourespour, A., Hoodaji, M. and
Khorsandi, F. (2011) Effect of salinity on free
living - diazotroph and total bacterial populations
of two saline soils. Afr. J. Microbiol. Res., 5:
144-148.
Saleh, B. (2011) Effect of salt stress (NaCl) on
biomass and K+/Na+ ratio in cotton. J. Stress.
Physiol. Biochem., 7: 05-14.
Saleh, B. (2013) Water status and protein pattern
changes towards salt stress in cotton. J. Stress.
Physiol. Biochem., 9: 113-123.
Shahzad, A., Ahmad, M., Iqbal, M., Ahmed, I. and Ali,
G.M. (2012) Evaluation of wheat landrace
genotypes for salinity tolerance at vegetative
stage by using morphological and molecular
markers. Gen. Mol. Res., 11: 679-692.
USDA (2011) Syria cotton and products annual cotton
report, GAIN Report, (www.fas.usda.gov).
Williams, J.G.K., Kubelik, A.R., Livak, K.J., Rafalski,
A.J. and Tingey, S.V. (1990) DNA
polymorphisms amplified by arbitrary primers are
useful as genetic markers. Nucleic. Acids. Res.,
18: 6531-6535.
Zhou, L., Li, J., Lin, X. and Al-Rasheid, K.A.S. (2011)
Use of RAPD to detect DNA damage induced by
nitrofurazone in marine ciliate Euplotes vannus
(Protozoa, Ciliophora). Aquat. Toxicol., 103: