Original Text Copyright © 2013 by Saleh
ORIGINAL ARTICLE
Evaluation of some upland cotton (Gossypium hirsutum L.)
varieties for salinity tolerance screening
Basel Saleh
Department of Molecular Biology and Biotechnology, AECS, P.O. Box 6091, Damascus, Syria
Fax: 0096311-6112289
E-Mail:
[email protected]Received February 5, 2013
This investigation aimed to evaluate five upland cotton (Gossypium hirsutum L.) (Aleppo118, Aleppo33/1, Aleppo90, Raqqa5, and Deir-Ezzor22)varieties based on physiological indices and genetic variation using AFLP marker. These varieties were evaluated under control and saline conditions (50, 100 & 200 mM NaCl) for 56 days. Various physiological indices were detected in this investigation. In this respect, Deir-Ezzor22 variety differed by showing high salt tolerance relative to the other tested varieties. Otherwise, PCR amplification with 7 AFLP PCs primer combinations revealedthat Deir-Ezzor22 variety characterized by 15 unique positive markers compared to the other tested varieties. Based on physiological study and AFLP technique, it can be concluded that genetic variation detected by AFLP marker supported the physiological indices among the tested cotton varieties. These varieties present considerable interest for genetic studies and plant improvement.
Key words: AFLP marker, Cotton, Physiological parameters, Salt stress
Cotton is an economically important plant
grown world-wide as a principal source of staple
fiber and vegetable oil. A great deal of effort has
been made to improve cotton cultivation and
characteristics by breeders. Cotton is one of the
major fiber crops in Syria, with a cultivated area
amount to 125,000 hectares, and a production of
470,000 tons of seed cotton and lint production is
estimated at 160,000 tons. Yarn spinning capacity is
estimated at 180,000 tons (USDA 2011). Salinity
tolerance is a complex trait that involves
physiological, biochemical, cellular and genetic
strategies. At present, out of 1.5 billion hectares of
cultivated land around the world, about
77 million hectares (5 %) is affected by excess
salt content (Moradi et al., 2011). Many researches
focused on understanding these mechanisms that
could improve plant breeding program for salinity
tolerance. Recently, research have been
devoted to understand the physiological
mechanisms underlying the ability of plants
salinity stress (Saleh 2011a, b & 2012). The
genetic relationship among cotton genotypes has
been extensively investigated studied based on
PCR-based markers e.g. AFLPs (Hussein et al., 2007,
Badigannavar et al., 2010), and RAPD (Hussein et
al., 2007, Chaudhary et al., 2010). Amplified Fragment Length Polymorphism (AFLP) is an
efficient reproducible technique which combines
the reability of RFLP and the power of PCR
technique (Vos et al., 1995).
The determination of variability at molecular
level by using molecular markers techniques is of a
great importance for the continuation of
germplasm and plant breeding. The genetic
alterations produced by NaCl application was
detected by AFLP marker. Due to the physiological
damages caused by NaCl treatment, polymorphism
observed between plants treated with NaCl
compared to their control respective.
Many PCR-based markers have been
successfully used to monitor genetic variations in
different plant crops. Among others RAPD marker
has been extensively applied in plant breeding
program, such as in date palm (Phoenix dactylifera
L.) (Kurup et al., 2009), aquatic plants Hydrilla
verticillata and Ceratophyllum demersum (Gupta
and Sarin 2009), in Euplotes vannus (Protozoa,
Ciliophora) (Zhou et al., 2011) and in fish full-sib
Nile tilapia (Oreochromis niloticus), Blue tilapia
(Oreochromis aureus) and their diallel interspecific
hybridization (El-Zaeem 2012). Previously, RAPD
technique has been successfully used to detect
genetic instability in bacteria, plants, invertebrate
and vertebrate animals (Savva 1998, Atienzar et al.,
2000).
Most variability/taxonomic affinity studies in
cotton focused mainly on morphology, physiology
and nuclear DNA diversity. While, create of genetic
variation in cotton induced by NaCl stress
application has received little attention. On the
other hand, only few studies evaluated the
biomarkers assays for cotton salinity tolerance
screening. The major aim of the General
Commission for Scientific Agricultural Research,
Damascus, Syria (GCSAR) programs was to increase
cotton yield and to develop line quality, increase
protein and oil contents of seeds, select the most
adapted ones under local environmental conditions
which could be integrated in a hybridization and
breeding program and improve biotic and abiotic
stress tolerance.
Thereby, this study aimed to evaluate genetic
variation induced by salt treatment (NaCl) using
physiological indices and molecular markers (AFLP)
for salinity tolerance screening in cotton varieties.
MATERIALS AND METHODS
Plant Materials and Growth Conditions
Seeds of five upland cotton (G. hirsutum. L)
[Aleppo118 (A118), Aleppo33/1 (A33/1), Aleppo90
(A90), Raqqa5 (Raq5), and Deir-Ezzor22 (DE22)]
varieties were provided by the General Commission
for Scientific Agricultural Research, Damascus, Syria
(GCSAR) (Table 1). Seeds were soaked in distilled
H2O for 24 h and then planted in pots filled with a
1/3:2/3 (v/v) mixture of perlite / peat moss.
Germination was carried out in a greenhouse at
temperature of 18◦C, 12 h photoperiod, and relative
humidity of 80%. Seedlings were grown in a
greenhouse under controlled conditions
(temperature of 25◦C, 12 h photoperiod, and
relative humidity of 80%). Seedlings were watered
for 1 week with 0.1 Hoagland’s nutrient solution
(Hoagland and Arnon 1950) before the intiation of
NaCl treatment. The seedlings were subjected to
to the nutrient solution. The same environmental
conditions were maintained during salt treatment.
All solutions were changed twice a week. The
experiment (five replicates by treatment) was
carried out in the greenhouse for 56 days.
Investigated Parameters
The parameters investigated for this work were
seedling height (HT), leaf number (LN), leaf area
(LA), chlorophyll SPAD, leaf Chl a and b, and
osmotic potential under control and saline
conditions. Plant height and leaf number were
measured and counted at the end of the
experiment. The experiment was terminated 56
days after salt application. Leaf area of detached
leaves from all five varieties under control and
saline conditions were measured using an area
meter AM100 (ADC, Bioscientific) instrument and
expressed as cm2 per plant. The osmotic potential
was measured using a micro-osmometer
(Osmometter) apparatus. Chlorophyll SPAD reading
were determined using Minolta Chlorophyll
Meter-SPAD 502 (Spectrum Technologies Inc., Ill.).
Chlorophyll a and b content were calculated
according to Arnon (1949).
Plants were uprooted carefully and washed
properly with tap water. Then, they were separated
into roots and leaves for mineral analysis. Fresh
weight of leaves and roots was recorded for each
variety under control and stress conditions. Leaves
and roots fractions were oven-dried at 70◦C for 48
h, weighed, crushed in a hammer-mill and stored at
room temperature. Nutrient analyses were carried
out on dried leaves and roots. Samples were ground
and 0.5 g of a fine powder was burnt at 400◦C for 4
h. The resulting ashes were dissolved in 100 ml of
0.5 N concentrated nitric acid. Determination of Na+
and K+ was carried out using flame photometer
procedure, while that for Ca2+ and Mg2+ cations
using calibration by EDTA methods. While, chloride
concentration was determined using an Ion
Selective Crystal Membrane Electrode Cl- (ISE
6.0502.120 Metrohm- Switzerland). For all cations
and ions, their content was expressed in mg/g of
dry material.
Total DNA isolation
Plant genomic DNA was extracted from (bulk of
5 plants/ variety) young leaves including the control
(unstressed plants) for the five cotton varieties
tested by a CTAB (cetyltrimethylammonium
bromide) protocol as described by Doyle and Doyle
(1987) with minor modifications. DNA
concentration was quantified by DNA Fluorimeter
at 260/280 nm and adjusted to final concentration
of 10 ng/ μl. DNA was stored at -80 °C until needed.
AFLP assay
AFLP analyses were performed according to Vos
et al., (1985) with a minor modification. Template DNA preparation of 130 ng were restricted with 0.1
U/μl MseI/Tru91 and 0.1 U/μl PstI/EcoR1 (Promega)
(a rare 6-base cutter) and ligated to MseI/Tru91
adaptor (0.25 pmol/μl) and PstI/EcoR1 adaptor
(0.25 pmol/μl), 0.2 mM rATp and 0.065 U/μl T4
DNA over night at 37°C, in a total volume of 20 μl.
An inactivation of restriction endonuclease has
been done by incubating the mixture at 70°C for 15
min. After checking for complete digestion, the
digested DNA was stored at 4°C until required.
Pre-amplification of DNA fragments was performed
using non selective primer combination in a total
volume of 50 μl. Pre-amplification reaction was
carried out as following: 5 μl of ligated DNA, 0.3
μmol of each primers PstI/EcoR1 and MseI/Tru91
(MWV, Germany), 1.25 mM MgCl2, 0.3 mM dNTP
(Promega) and 0.05 U of Taq DNA polymerase
programmed for the first 12 cycles, the thermal
profile was 94°C for 30 s, 65°C (−0,7°C/cycle) for 30
s, and 72°C for 60 s. For the last 23 cycles, the
annealing temperature (aT°) was set to 56°C for 30
sec, and 72°C for 1 min. Pre-amplification products
were then diluted 50-folds in double-distilled H2O,
and used as templates for selective amplification.
Selective amplification of the pre-amplified DNA
was carried out using various selective primer
combinations. This last amplification was
performed in 25 μl reaction volume containing 5 μl
of diluted DNA pre-amplified, 10X PCR buffer
without MgCl2, 0.5 ng of PstI/EcoR1 selective
primer, 1.5 ng of MseI/Tru91 selective primer, 1.5
mM of MgCl2, 0.2 mM dNTP and 0.04 U of Taq DNA
polymerase. PCR reactions for selective
amplification were performed in a thermal cycler
programmed as following: 94°C for 30 sec, 65°C
(−0,7°C/cycle) for 30 sec and 72°C for 1 min for the
first 14 cycles. For the last 24 cycles, the annealing
temperature (aT°) was set to 56°C for 30 sec, and
72°C for 1 min. Amplification products were
separated on a 6% polyacrylamide (acrylamide :
bisacrylamide 19 : 1) / 8 M urea sequencing gel
(SequaGel® XR, National Diagnostics, Inc.) at 120 W
for 2 h in 1X TBE buffer (0.09 M Tris-borate and
0.002 M EDTA), and detected by silver staining
according to the manufacturer’s instructions
(Sigma). Band sizes were determined by
comparison with a 1kb DNA ladder size standard.
Statistical Analysis
All statistical analyses were performed using
Statview 4.5 statistical package (Abacus 1996) at
the 5% significance level (P = 0.05). Data were
subjected to analysis of variance (ANOVA) for the
determination of differences in means between
tested plants of each concentration of NaCl applied.
Differences between means were tested for
significance by Fisher’s least significant difference
(PLSD) test.
AFLP analysis
To match more loci at the genomic level, seven
AFLP PCs primer combinations were tested for
detecting the polymorphism among the five cotton
varieties. Data was scored manually as (1) for the
presence and (0) for the absence of a DNA band for
each locus in each variety tested.
RESULTS
Physiological indicators
Our investigation demonstrated genotypic
variation in salt tolerance present among tested
cotton varieties based upon various examined
physiological indices. Analysis of variances of data
for the different investigated parameters for the
five cotton varieties tested in this study was
summarize in table 2. Overall, salt stress application
negatively affected various indicators detected in
this investigation, except for Deir-Ezzor22, where
there was an increase in LA with increasing salinity
levels (Saleh 2012).
Analysis of variance indicated that the effect of
NaCl levels on the major tested indicators in all
varieties tested was highly significant (P < 0.001),
except for some other indicators such as, leaf K+
/Na+, leaf and root Ca2+ and Mg2+ content (Table 2).
While, the significant effect (P < 0.001) of variety on
the major tested indicators in all varieties tested
was less noticeable (Table 2). Whereas, a low
significant effect was recorded for the interaction
between variety and treatment (Table 2). These
results were in agreement with Saleh 2011a, 2011b
& 2012.
Table 3 shows the physiological indicators
estimated for the five cotton tested varieties in this
salt tolerant variety compared to the other tested
varieties. This observation was in accordance with
Saleh 2011a, 2011b & 2012 investigations.
Otherwise, according to GCSAR, DE22 exhibited a
good technological traits. It was considered as the
highest local variety in gin turnout percentage and
the most temperature tolerant at vegetative stage
compared to the other cotton varieties.
AFLP Markers
The current study based on AFLP fingerprinting
permitted the discrimination among the five cotton
tested varieties. The findings presented herein
allowed to somewhat to distinguishes between
DE22 (salt tolerant) variety and other tested ones
through revealing species-specific markers.
AFLP fingerprinting revealed that some of DNA
fragments may characterize gene(s) coding for
specific traits such as salinity or/and drought
tolerance. Our data stated that different observed
fragments in DE22 (salt-tolerant( variety may
provide a marker for salinity tolerance. Our findings
revealed that DE22 variety characterized by 15
unique positive markers compared to the other
tested varieties using 7 AFLP PCs primer
combinations (Table 4).
Table 1. Descriptive of 5 certificated cotton varieties used in this study
Variety
Agro-ecological
zone
Yield (kg /ha) Upon certification
Certification
year Origin
Aleppo118 Aleppo - Idleb 6252 2004 Hybrid (Syrian var. Aleppo40 x American var.
BW 76-31)
Aleppo1/33 Hama - Homs 5166 1987 Created from selected line Acala SG-4
Aleppo90 Hassakeh 5130 1977 Hybrid ( Russian var. Tashkand-3 x American
var. Deltapine 70)
Raqqa5 Raqqa 4840 1988 Created from selected Russian var.
Tashkand-3
Deir Ezzor22 Deir Ezzor 5420 1988 Created from selected American var.
Deltapine 41 Source: General Commission for Agricultural Research Damascus – Duma, Syria (GCSAR).
Table 2. Analysis of variances (mean squares) of data for the five cotton varieties after 56 days growth at 0, 50, 100 and 200 mM NaCl
S.O.V df HT LN LA SPAD502 Chl a Chl b Osmotic
potential Biomass
V 4 209.565* 1.765ns 393.091* 382.702* 162.622* 33.716* 3.52* 3.391*
T 3 314.067* 15.2* 1266.859* 743.988* 407.982* 71.454* 5.794* 11.428*
V x T 12 23.892ns 7.358* 369.299* 56.463* 21.888* 4.179* 0.339* 1.189*
S.O.V df FWL FWR DWL DWR Leaf K+/Na+ Leaf
Mg2+
/Na+ Na
+ Leaf Na+ Root
V 4 5.758* 1.047* 0.611* 0.138ns 42.666* 375.017* 772.723* 24.807*
T 3 7.793* 5.099* 0.667* 0.496* 89.958* 289.57* 2172.101* 162.353*
V x T 12 0.653ns
0.102ns
0.077ns
0.095ns
32.271* 267.264* 234.631ns
4.572ns
S.O.V df K+ Leaf K+ Root Cl- Leaf Cl- Root Ca2+ Leaf Ca2+ Root Mg2+ Leaf Mg2+ Root
V 4 109.774* 2.532ns 845.552ns 13.397ns 4621.245* 72.706* 2080.578* 262.644*
T 3 16.65ns 0.14ns 9783.503* 99.62* 247.233ns 0.677ns 9.462ns 19.167ns
V x T 12 15.111ns 1.264ns 281.123ns 6.536ns 268.878ns 0.388ns 148.749ns 9.739ns
Table 3. Physiological traits investigated into the five cotton varieties used in this study
Index A118 A33/1 A90 Raq5 DE22
HT 3 3 2 1 2
LN 2 2 1 2 1
LA 3 3 3 2 1
SPAD502 2 3 2 1 1
Chl a 2 2 3 2 2
Chl b 2 2 3 2 2
Osmotic potential 3 3 2 1 1
Biomass 3 3 3 1 1
FWL 3 3 3 3 1
FWR 3 3 3 3 1
DWL 2 3 3 2 1
DWR 2 2 3 3 1
Leaf K+ /Na+
3 3 2 1 1
Leaf Mg2+ /Na+
3 3 3 1 1
Na+
Leaf 3 3 3 2 1
Na+
Root 3 3 3 2 1
K+ Leaf 1 1 1 1 1
K+ Root 1 1 1 1 1
Cl- Leaf 3 3 3 2 1
Cl
Root 2 2 2 2 1
Ca2+
Leaf 2 2 2 2 1
Ca2+
Root 2 2 1 2 1
Mg2+
Leaf 2 2 1 1 1
Mg2+ Root 2 2 2 2 1
1: Tolerant 2: Moderate 3: Sensitive
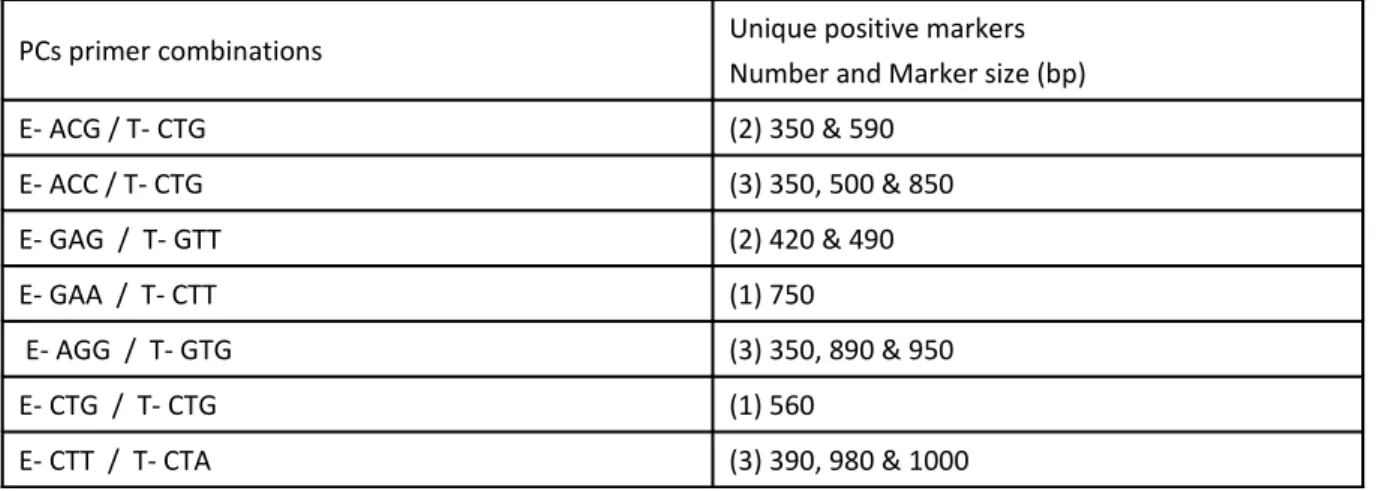
Table 4. Number and marker size (bp) of unique positive markers identified into DE22 variety using 7 AFLP PCs primer combinations
PCs primer combinations Unique positive markers
Number and Marker size (bp)
E- ACG / T- CTG (2) 350 & 590
E- ACC / T- CTG (3) 350, 500 & 850
E- GAG / T- GTT (2) 420 & 490
E- GAA / T- CTT (1) 750
E- AGG / T- GTG (3) 350, 890 & 950
E- CTG / T- CTG (1) 560
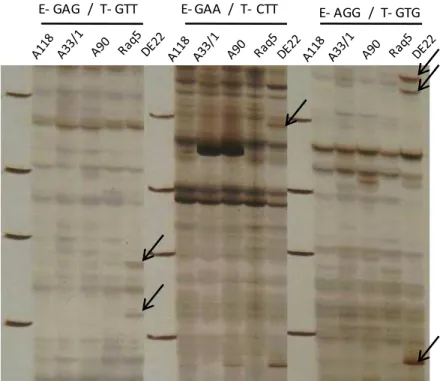
E- GAG / T- GTT E- GAA / T- CTT E- AGG / T- GTG
Figure 1: AFLP banding profiles generated by E-GAG/T-GTT, E-GAA/T-CTT and E-AGG/T-GTG AFLP PCs into the five tested cotton varieties. Arrows indicate new bands identified as a positive unique marker in DE22
As shown in Table 4, fragments were ranged
between 1 (E- GAA/ T- CTT and E- CTG/ T- CTG AFLP
PCs combinations) and 2 (E- GAG/ T- GTT and E-
ACG/ T- CTG AFLP PCs combinations). While, the
highest number (3) was yielded by (E- ACC/ T- CTG,
E- AGG/ T- GTG and E- CTT/ T- CTA AFLP PCs
combinations). These data are in accordance with
physiological tested indices obtained herein.
Regarding the degree of relatedness among the
varieties tested upon UPGMA clustering method,
DE22 was too genetically distinct from the other
tested varieties (unpublished) using AFLP markers..
Our results demonstrated that variant bands
observed in amplification products for DE22 variety
were revealed by different AFLP PCs combination
primers compared to other tested varieties. As
shown in Figure 1, DNA polymorphism yielded by
using the E-GAG/T-GTT, E-GAA/T-CTT and
E-AGG/T-GTG AFLP PCs combination primers in the five
tested varieties.
Kurup et al., (2009) used RAPD marker to
evaluate morpho-physiological traits
characterization of date palm (Phoenix dactylifera
L.) varieties for salinity tolerance. The previous
investigation mentioned that DNA fragments
amplified of about 1200, 1400 and 1600 bp could
be used as a marker for salinity tolerance in date
palm.
Gupta and Sarin (2009) stated that the DNA
polymorphisms detected by RAPD analysis can be
applied as a suitable biomarker assay for the
detection of genotoxic effects of heavy metal
contamination on aquatic plants Hydrilla verticillata
and Ceratophyllum demersum. Zhou et al., (2011)
also used RAPD bands for indicating DNA damage in
Euplotes vannus (Protozoa, Ciliophora) induced by nitrofurazone in marine ciliates. Recently, El-Zaeem
successfully used as a rapid and easy way for
identification of the different selected genotypes of
salinity resistance fish full-sib Nile tilapia
(Oreochromis niloticus), Blue tilapia (Oreochromis
aureus) and their diallel interspecific hybridization.
Banding patterns generated by AFLP fingerprinting
could be used as biomarker to identify salinity
tolerance gene(s). Based upon the current results,
AFLP marker could be used as potential markers for
early identification of cotton tolerance to salt
stress.
In conclusion, the physiological evaluated
indicators in the current study could be considered
as useful parameters for screening salt tolerance
among different cotton varieties cultivated in Syria.
Thereby, cotton varieties that could be considered
as salt tolerant will help boost plant production in
salt-affected regions. Other wise, it is possible that
the variant bands observed in amplification
products for DE22 variety may be linked to salinity
tolerance gene(s).
Overall, It can be concluded that physiological
indices could reflect genetic variations among the
tested cotton varieties.
ACKNOWLEDGMENTS
We thank Dr. I. Othman (Director General of
AECS) and Dr. N. Mirali (Head of Molecular Biology
and Biotechnology Department in AECS) for their
support, and also the Plant Biotechnology group for
technical assistance.
REFERENCES
Abacus Concept (1996) Statview 4.5 Statistical
Program Abacus Concepts Corporation,
Berkeley, CA, USA.
Arnon, D. I. (1949) Copper enzymes in isolated
chloroplasts: Polyphenoloxidase in Beta
vulgaris. Plant. Physiol., 24: 1–15.
Atienzar, F.A., Conradi, M., Evenden, A.J., Jha, A.N.
and Depledge, M.H. (1999) Qualitative
assessment of genotoxicity using random
amplified polymorphic DNA: comparison of
genomic template stability with key fitness
parameters in Daphnia magna expose to
benzo [a] pyrene. Environ. Toxicol. & Chem.,
18: 2275-2282.
Badigannavar, A., Myers, G., Agcenter, L.S.U. and
Baton-Rouge, L.A. (2010) Genetic analysis of
AFLP markers associated with seed quality
traits in Upland cotton (Gossypium hirsutum).
2010 Beltwide Cotton Conferences, New
Orleans, Louisiana, January 4-7. Nat. Cotton
Counc. Am., Memphis, TN.
Chaudhary, L., Sindhu, A., Kumar, R. and Saini, M.
(2010) Estimation of genetic divergence among
some cotton varieties by RAPD analysis. J.
Plant. Breed. Crop. Sci., 2(3): 39–43.
Doyle, J.J. and Doyle J.L. 1987. A rapid DNA isolation
procedure for small quantities of fresh leaf
tissue. Phytoch. Bull., 19: 11–15.
El-Zaeem, S.Y. (2012) Identification of different
selected genotypes of salinity resistance of
each of full-sib Nile tilapia, Blue tilapia and
their diallel interspecific hybridization using
random amplified polymorphic DNA
fingerprinting. Afr. J. Biotech., 11(35):
8645-8652.
Gupta, M. and Sarin, N.B. (2009) Heavy metal
induced DNA changes in aquatic macrophytes:
Random amplified polymorphic DNA analysis
and identification of sequence characterized
amplified region marker. J. Environ. Sci., 21:
686–690.
Hoagland, D.R. and Arnon, D.I. (1950). The water
Circular 347, College of Agriculture, University
of California, Berkeley; College Agriculture
circular No. 347.
Hussein, E.H.A., Marwa, H.A., Hussein, O.M.H. and
Adawy, S.S. (2007) Molecular characterization
of cotton genotypes using PCR-based markers.
J. Appl. Sci. Res., 3(10): 1156–1169.
Kurup, S.S., Hedar, Y.S., Al Dhaheri, M.A.,
El-Heawiety, A.Y., Aly, M.A.M. and Alhadrami, G.
(2009) Morpho-physiological evaluation and
RAPD markers-assisted characterization of
date palm (Phoenix dactylifera L.) varieties for
salinity tolerance. J. Food. Agric. & Environ., 7
(3&4) : 303-507.
Moradi, A., Tahmourespour, A., Hoodaji, M. and
Khorsandi, F. (2011). Effect of salinity on free
living - diazotroph and total bacterial
populations of two saline soils. Afr. J. Microb.
Res., 5 (2): 144-148.
Saleh, B. (2011a) Effect of salt stress (NaCl) on
biomass and K+/Na+ ratio in cotton. J. Stress.
Physiol. & Biochem., 7 (4): 05-14.
Saleh, B. (2011b) Ion partitioning and Mg2+/Na+
ratio under salt stress application in cotton. J.
Stress. Physiol. & Biochem., 7 (4): 292-300.
Saleh, B. (2012) Effect of salt stress on growth and
chlorophyll content of some cultivated cotton
varieties grown in Syria.Comm. Soil. Sci. Plant. Anal., 43 (15): 1976 - 1983.
Savva, D. (1998) Use of DNA fingerprinting to detect
genotoxic effects. Ecotoxic. Environ. Saf.,
41:103-106.
Vos, P., Hogers, R., Bleeker, M., Reijans, M., van de
Lee, T., Hornes, M., Frijters, A., Pot, J.,
Peleman, J., Kulper, M. and Jabeau, M. (1995)
AFLP: a new technique for DNA fingerprinting.
Nucl. Acid Res., 23: 4407–4414.
Zhou, L., Li, J., Lin, X. and Al-Rasheid, K.A.S. (2011)
Use of RAPD to detect DNA damage induced by
nitrofurazone in marine ciliate Euplotes vannus
(Protozoa, Ciliophora). Aquat. Toxicol., 103: