Mice Affect Its FT-IR Characteristics
Benedicto de Campos Vidal", Fla´via Gerelli Ghiraldini, Maria Luiza S. Mello*"
Department of Structural and Functional Biology, Institute of Biology, University of Campinas (Unicamp), Campinas, Sa˜o Paulo, Brazil
Abstract
Background:Lower levels of cytosine methylation have been found in the liver cell DNA from non-obese diabetic (NOD) mice under hyperglycemic conditions. Because the Fourier transform-infrared (FT-IR) profiles of dry DNA samples are differently affected by DNA base composition, single-stranded form and histone binding, it is expected that the methylation status in the DNA could also affect its FT-IR profile.
Methodology/Principal Findings: The DNA FT-IR signatures obtained from the liver cell nuclei of hyperglycemic and normoglycemic NOD mice of the same age were compared. Dried DNA samples were examined in an IR microspectroscope equipped with an all-reflecting objective (ARO) and adequate software.
Conclusions/Significance: Changes in DNA cytosine methylation levels induced by hyperglycemia in mouse liver cells produced changes in the respective DNA FT-IR profiles, revealing modifications to the vibrational intensities and frequencies of several chemical markers, includingnas–CH3stretching vibrations in the 5-methylcytosine methyl group. A smaller band area reflecting lower energy absorbed in the DNA was found in the hyperglycemic mice and assumed to be related to the lower levels of –CH3groups. Other spectral differences were found at 1700–1500 cm21and in the fingerprint region, and a
slight change in the DNA conformation at the lower DNA methylation levels was suggested for the hyperglycemic mice. The changes that affect cytosine methylation levels certainly affect the DNA-protein interactions and, consequently, gene expression in liver cells from the hyperglycemic NOD mice.
Citation:Vidal BdC, Ghiraldini FG, Mello MLS (2014) Changes in Liver Cell DNA Methylation Status in Diabetic Mice Affect Its FT-IR Characteristics. PLoS ONE 9(7): e102295. doi:10.1371/journal.pone.0102295
Editor:Heidar-Ali Tajmir-Riahi, University of Quebect at Trois-Rivieres, Canada ReceivedApril 1, 2014;AcceptedJune 16, 2014;PublishedJuly 14, 2014
Copyright:ß2014 Vidal et al. This is an open-access article distributed under the terms of the Creative Commons Attribution License, which permits unrestricted use, distribution, and reproduction in any medium, provided the original author and source are credited.
Data Availability:The authors confirm that all data underlying the findings are fully available without restriction. All relevant data are within the paper. Funding:This work was supported by grant no. 201050015-6 from the Sa˜o Paulo State Research Foundation (FAPESP) and grants no. 301943/2009-5 and 475261/2012-7 from the Brazilian National Council for Research and Development (CNPq). The funders had no role in study design, data collection and analysis, decision to publish, or preparation of the manuscript.
Competing Interests:The authors have declared that no competing interests exist. * Email: mlsmello@unicamp.br
"These authors are joint senior authors on this work.
Introduction
Non-obese diabetic (NOD) mice are a useful experimental model in which an expressive amount of females spontaneously develop a form of autoimmune diabetes that closely resembles human diabetes [1]. In NOD mice, a combination of apparently normal alleles at numerous recessive loci is associated with insulin-dependent diabetes. Each of these alleles contributes a small degree of susceptibility to the disease [1,2]. In the NOD hyperglycemic mouse liver, gene expression-profiles and cellular metabolism are also affected [3–6].
Lower cytosine methylation levels have been found in DNA from liver cells in NOD mice under hyperglycemic conditions when the bulk genome is considered [7]. This epigenetic change may be associated with increased chromatin accessibility to MNase digestion and decreased chromatin compactness in hyperglycemic NOD mice [8]. Because Fourier transform-infrared (FT-IR) profiles of dry DNA samples are affected differently by certain DNA characteristics, such as base composition, single-stranded-ness and histone binding [9], the methylation status of DNA from NOD mice is expected to affect the DNA IR profile. The
FT-IR notation indicates that a Fourier transform algorithm is necessary to convert the raw data into a spectrum, which is performed using modern technology for IR microspectroscopy, wherein a beam of IR light is passed through a sample at all wavenumbers, thus revealing specific absorption peaks.
The effects of methylation on the backbone structure of DNA sequence models in solution at different levels of methylation have been investigated with FT-IR, wherein the spectral regions that are sensitive to the base-sugar conformation were emphasized [10]. Dry synthetic oligonucleotide samples with different meth-ylation patterns were studied using FT-IR in the 1700–800 cm21
spectral range and Raman spectroscopy, which revealed gradual changes as a function of differing methylation content [11]. However, FT-IR data have not been collected from dry DNA samples at different levels of methylation and analyzed in the 3600–2800 cm21
spectral range, which is sensitive to –NH and – NH2 group stretching vibrations [12–16], nas and ns C-H
stretching vibrations in the 5-methylcytosine methyl group [14,17], and general -CH3 and –CH2 groups [12,17–19] and
In the present study, differences in the FT-IR signatures of liver DNA previously demonstrated with different methylated cytosine levels [7] were investigated in NOD mice that were of the same age and under normoglycemic as well as hyperglycemic condi-tions.
Results
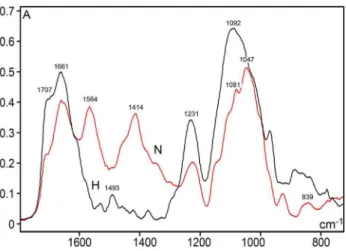
A comparison of the FT-IR profiles between hyperglycemic and normoglycemic mice revealed differences in the spectral range from 3600–2800 cm21, 1700–1500 cm21 and 1450–700 cm21 (the fingerprint region) (Fig. 1). The most elevated peak, especially assigned to –NH and –NH2group stretching vibrations [12–16],
and also possibly to DNA hydrogen bonding [12], occurred at 3384 cm21 for normoglycemic mice and at
,3366 cm21 for
hyperglycemic mice. The absorbance intensity at ,2987–
2849 cm21
, which was assigned to thenasandnsC-H stretching vibrations in 5-methylcytosine methyl groups [14], was more elevated in the DNA spectral profile from hyperglycemic mice and was confirmed using the second-derivative for this spectral window (Fig. 2). In addition, the area under this band peak was.2-fold smaller for hyperglycemic mouse DNA compared with normo-glycemic mouse DNA (Table 1). Such a DNA band peak for normoglycemic mice was resolved into nine components after peak fitting using the FT-IR equipment software (sensitivity: low) (Fig. 3A); the most prominent peak was estimated at 2931 cm21
. In the hyperglycemic mouse DNA, the band peak was resolved into 12 components (Fig. 3B); the most prominent peak was estimated at,2944 cm21.
A shoulder at 1707 cm21 and a peak at 1661 cm21 were notably more elevated in the DNA spectrum for the hyperglycemic mice (Figs. 1 and 4). When the second-derivative was determined for the 1800–730 cm21spectral window, the peak corresponding to 1661 cm21 shifted to 1650 cm21 for hyperglycemic mouse DNA (Fig. 5).
The absorbance intensity at,1564 cm21decreased with lower
methylation (Figs. 1, 4). A small peak at 1493 cm21
was only evident in the DNA from the hyperglycemic NOD mouse liver cells, but an absorption peak at 1294 cm21was not clearly evident in the DNA from either the normoglycemic or hyperglycemic mice (Figs. 4 and 5). Studies have reported that peaks at the 1493 and
1294 cm21
frequencies are contributed by cytosine only [20] or by both cytosine and guanine [21] (or the band at 1492 cm21
is specifically assigned to cytosine and guanine [22]).
In the spectral regions related to PO22antisymmetric (1220–
1226 cm21) and symmetric (1090–1080 cm21) stretching, pentose ring vibrations and the main S-type sugar markers [10,21], the vibrational intensities increased with the decreasing methylation observed in the hyperglycemic mice (Figs. 4 and 5). The peak that corresponds to the vibration intensity of the antisymmetric stretching in the DNA PO22groups was lower than the groups’
symmetric stretching in both normoglycemic and hyperglycemic NOD mice, which has been extensively reported for several other material types. The second derivative fitted to the IR profile
revealed that the frequencies related to the DNA PO22
antisymmetric stretching in the normoglycemic and hyperglycemic mice slightly differ (1222 cm21
and 1230 cm21
, respectively (Fig. 5). For the PO22symmetric stretching frequency, the DNA
from the normoglycemic mice exhibited a peak at,1081 cm21
(Figs. 4 and 5), and the DNA peak from the hyperglycemic mice appeared at 1092 cm21
in the original profile (Fig. 4), but was resolved from second-derivative spectra at,1100 cm21(Fig. 5).
An elevated peak at 1047 cm21and a low peak at 839 cm21 were evident in the normoglycemic mouse DNA spectral profile (Figs. 4 and 5). At the spectral region with frequencies
,900 cm21, absorptivity was more intense for the hyperglycemic mouse DNA.
Discussion
The findings herein reveal that the hyperglycemia-induce changes in the methylation status of DNA from mouse liver cells produced differences in the corresponding DNA FT-IR profiles obtained using microspectroscopic procedures. Further, the vibrational intensities and frequencies of several chemical markers are modified, includingnasandnsC-H stretching vibrations from 5-methylcytosine methyl groups of [14,17]. Based on reports that the area under an absorption band peak in IR spectroscopy is related to the absorbed energy [16,18,23], this study showing a smaller band area for the hyperglycemic NOD mouse DNA –CH3
groups suggests a lower abundance of cytosine methylation in the liver cell nuclei of these mice, which is consistent with a report by Damasceno et al. [7]. The different number of peaks and the position of the most prominent peak resulting from the peak-fitting Figure 1. FT-IR spectral profiles for the liver DNA from NOD
mice.Normoglycemic mice (N), red line; hyperglycemic mice (H), black
line; spectral range: 3600–700 cm21
. X axis, wavenumbers in cm21
; Y axis, absorbances (A).
doi:10.1371/journal.pone.0102295.g001
Figure 2. Savitzky-Golay’s second-derivative spectra for the
liver DNA from NOD mice.Detail for the IR spectral window in the
3100–2800 cm21range. Normoglycemic mice (N), red line; hyperglyce-mic hyperglyce-mice (H), black line; X axis, wavenumbers in cm21; Y axis, second
derivative. Software: Grams/AI 8.0; 2nd derivative degree: 2, points: 31. doi:10.1371/journal.pone.0102295.g002
procedure indicate changes in the chemical environment energy levels due to changing DNA methylation levels, which occur with increasing glycemia levels in NOD mice.
The literature has assigned a band peak such as that exhibited
by the NOD mouse DNA FT-IR signature in the ,2987–
2849 cm21
spectral range to thenasof –CH3and –CH2groups, especially in proteins [9,19]. However, in the present case this peak is assumed to be primarily due tonasandnsC-H vibrations in the 5-methylcytosine –CH3 group [14,17]. A peak in this IR
spectral region, although not as evident as in the presently studied NOD mouse DNA samples, has also been observed in commer-cially available, protein-free pure DNA samples, examined with an all-reflecting objective (ARO) [16]. In addition, the 260/280 nm absorbance ratio obtained using a spectrophotometer and the protocol for isolating DNA from the NOD mouse liver indicates that protein contaminants were not present in these samples [24]. For DNA analysis in the lower frequency FT-IR region, it may be considered that ARO may be not as adequate as an ATR objective [16]. Additionally, most DNA vibrational group data from the literature that was used for comparison are from samples in solution environments. However, when studying the DNA spectral profiles for the hyperglycemic and normoglycemic mice, results obtained at lower FT-IR frequencies were consistent with data reported in the literature. For example, the shoulder at 1707 cm21
, which is especially evident in the DNA spectral profile of the hyperglycemic mice, may be due to a guanine band shifted from 1717 cm21
[21,22]. The absorptivity at this spectral region may also indicates that the DNA samples analyzed here were not denatured [13,20,25,26].
The peak at ,1661 cm21 in the normoglycemic mouse DNA
shifted to 1650 cm21
in the second-derivative spectra for the hyperglycemic NOD mouse DNA has been attributed to thymine [20–22] as well as an adenine peak [20,22], also observed in an unpublished study by one of us (BCV). A peak in this spectral region has been observed in FT-IR spectral profiles from AT-biased DNA samples studied using an ARO [16]. In the NOD mouse liver cell DNA spectral profile, this peak may be due to pericentromeric heterochromatin satellite DNA, which contains AT-rich sequences [27]. On the other hand, according to Banyay and Gra¨slund [10], the upshift of cytosinenC2= O (Fig. 6) from 1652 to 1656 cm21may be ‘‘assigned to vibrational effects due to the presence of a 5-methyl group in cytosine’’. The downshift detected herein from,1661 to
1650 cm21with decreasing DNA methylation in the hyperglycemic
NOD mice may be supported by this proposition [10].
The band peak at 1493 cm21, which is a more evident DNA peak in the hyperglycemic mice and is presumably assigned to cytosine only [16], may have resulted from an increase in unmethylated cytosine molecules for this DNA [7].
According to Taillandier and coworkers [apud20], the PO22
antisymmetric stretch frequency (1225 cm21
) is more sensitive to the DNA molecule geometry than the symmetric stretch (1088 cm21). In the present investigation, a frequency change that affected the PO22vibrations from DNA with lower cytosine
methylation involved symmetric rather than antisymmetric stretching. The DNA from hyperglycemic and normoglycemic mouse livers were obtained using the same protocol and examined under the same ambient relative humidity. Thus, if conformational changes were introduced in the DNA molecule, they were due to methylation status changes that result from the different mouse
Figure 3. FT-IR spectral profiles after peak fitting for the liver DNA from NOD mice.Normoglycemic mice, A; hyperglycemic mice, B.
Spectral range: 2990–2850 cm21. Software: Grams/AI 8.0; function: Gaussian; sensitivity: low.
doi:10.1371/journal.pone.0102295.g003
Table 1.Numerical statistics for the FT-IR –CH3band peak in the DNA from NOD mouse liver cell nuclei.
NOD mouse states DNA –CH3band Normoglycemic/hyperglycemic –CH3area ratio Band center of mass
Peak (cm21
) Area units cm21
Normoglycemic 2931 7.47 2.69 2924
Hyperglycemic 2945 2.78 2930
Wavenumber edges: 2987 and 2849 cm21. Software: Grams; function: Gaussian; sensitivity: low.
glycemic conditions [7]. According to Franklin and Gosling’s report [28], at the relative humidity in which the DNA samples were examined (,75%), the DNA would acquire an A-conformation. However, at least in crystal structures, reports describe a transition between B-DNA and A-DNA that progresses through 13 confor-mational steps [29,30] and demonstrated that methylated DNA sequences form standard A-DNA only if allowed to crystallize for a long period of time (2–3 months) [31]. DNA structures containing 5-methylcytosine would present local perturbations and even acquire a conformation with eccentric double helix characteristics that is neither B-DNA nor A-DNA (E-DNA); B-DNA transition to A-DNA would go through this intermediate DNA conformation [30,31]. One study reported that a DNA molecule with both B-DNA and A-DNA was induced by cytosine methylation [29].
The absorptivity in the spectral region lower than,959 cm21,
which was more prominent for DNA from hyperglycemic mouse liver cell nuclei, is most likely associated with DNA O-P-O bending [32], indicating a less rigid DNA conformation with decreasing DNA methylation. Cytosine methylation has been reported to restrict DNA backbone bending and flexibility [33]. Interestingly, in hepatocyte nuclei from hyperglycemic NOD mice, chromatin becomes more unraveled compared with the normoglycemic controls [8].
The 900–790 cm21spectral region is also sensitive to the sugar
conformation [10]. The peak at 839 cm21in the normoglycemic
mouse DNA that apparently shifted to 836 cm21 in the
hyperglycemic mouse DNA may be related to changes in the sugar ring vibrations induced by lower cytosine methylation [10] and higher glycemic conditions.
In conclusion, changes in the NOD mouse liver cell cytosine methylation levels under hyperglycemic conditions, which alter DNA structures and chemical environment, were reflected in the corresponding FT-IR DNA signatures. The changes that affect cytosine methylation levels certainly interfere with DNA-protein interactions and, consequently, gene expression [10,34,35], which is expected for NOD hyperglycemic mouse liver cells [6].
Materials and Methods
Animals
Female NOD/Unib adult mice were obtained from the Multidisciplinary Center of Biological Investigation at the
University of Campinas. The animals were reared under standard controlled conditions, fed extruded chow (Nuvital, Colombo, Brazil) and received waterad libitum. Their glycemia levels were measured through blood samples obtained by caudal puncture and subjected to weekly analyses by an automatic Accu-Check Active Performa glucose meter (Roche Diagnostic do Brasil, Jaguare´, Brazil) up to 24 h before they were killed. Glycemia levels within the range 90–100 mg/dL (5.00–5.55 mmol/L) were considered normal; glycemia levels .500 mg/dL (27.5 mmol/L) indicate severe hyperglycemia. The normoglycemic mice used as controls were matched by age to the hyperglycemic animals. The protocol Figure 4. FT-IR spectral profiles for the liver DNA from NOD
mice.Detail of the IR spectral window in the 1800–730 cm21range.
Normoglycemic mice (N), red line; hyperglycemic mice (H), black line. X axis, wavenumbers in cm21; Y axis, absorbances (A).
doi:10.1371/journal.pone.0102295.g004
Figure 5. Savitzky-Golay’s second-derivative spectra for the
liver DNA from NOD mice.Detail for the IR spectral window in the
1750–800 cm21range. Normoglycemic mice (N), red line;
hyperglyce-mic hyperglyce-mice (H), black line; X axis, wavenumbers in cm21; Y axis, second
derivative. Software: Grams/AI 8.0; 2nd derivative degree: 2, points: 31. doi:10.1371/journal.pone.0102295.g005
Figure 6. Molecular structure of cytosine (A) and 5-methylcyt-osine (B).
doi:10.1371/journal.pone.0102295.g006
involving animal care and use as well as chromatin analysis was performed in compliance with the Brazilian College of Animal Experimentation and approved (protocol no. 1608-1) by the Committee for Ethics in Animal Use of the University of Campinas (Brazil).
Sample Preparation
A modified phenol-chloroform method [24] was used for DNA extraction from the isolated liver nuclei. Briefly, for each group, materials from three animals were assembled into one sample. Approximately 400 mg of DNA quantified by UV
spectropho-Figure 7. Optical anisotropy aspects of the DNA samples extracted for FT-IR analysis.Birefringence images are shown for the liver DNA
from normoglycemic (A,B) and hyperglycemic (C-E) mice. Birefringence brilliance in the outer region of DNA drops dried on slides in A and D was compensated in B and E, respectively (arrows). The bars equal 100mm.
tometry were extracted twice with phenol-chloroform-isoamyl alcohol (25:24:1) and centrifuged at 14,000 rpm for 5 min at 4uC. The supernatant was then extracted once with chloroform-isoamyl alcohol (24:1) and precipitated with 4 M sodium acetate at pH 5.0 in 2 volumes of absolute ethanol at 220uC overnight. Next, the samples were centrifuged at 14,000 rpm for 20 min at 4uC and washed in 70% ethanol. The 260/280 nm absorbance ratio (,1.8)
was obtained for the samples using the Thermo Scientific NanoDrop 2000 spectrophotometer (Wilmington, DW, USA) and indicates pure DNA according to the manufacturer. The extracted DNA was resuspended in a 0.9% NaCl solution and stored at220uC until use. Next, it was washed in 80% ethanol to remove NaCl crystals, air dried and spread on gold-covered glass slides for FT-IR analyses. The phenol-chloroform protocol used does not affect DNA methylation patterns [36]. DNA samples that were prepared using the same protocol as for FT-IR but were spread on glass slides were examined for optical anisotropy in an Olympus BX51 polarization microscope (Tokyo, Japan). Birefrin-gence with a negative sign demonstrated that the extracted DNA was in a helical double-stranded conformation (Fig.7). The ambient relative humidity at which the samples were examined for FT-IR and optical anisotropy was less than 75%.
Equipment/Software
The DNA FT-IR spectral profiles were obtained using an Illuminat IR IITM microspectrometer (Smiths Detection, Dan-bury, USA) equipped with a liquid nitrogen- cooled mercury-cadmium-telluride (MCT) detector; an Olympus microscope; and Grams/AI 8.0 spectroscopy software (Thermo Electron Co., Waltham, USA). The performance validation of the equipment used a low signal-to-noise ratio (7929:1) [37]. The area for measurements was 50mm per side; the sample and background
absorbances were measured using 64 scans for each individual profile. Because an all-reflecting objective (ARO) has been especially recommended for FT-IR analyses of DNA vibrational properties in the 3600–3000 cm21
spectral region [16], this type of microscope objective (166magnification) was used here.
Procedures
The spectral absorption signatures were obtained at wavenum-bers ranging from 4000 cm21 to 700 cm21 with the spectral resolution of 4 cm21. Ten spectral profiles were obtained for each sample. Baseline correction (using a four-point method and positioning the first point at,3700 cm21) and normalization to
the highest peak were performed for each spectral profile; an average profile was then calculated for each sample. For the peak fitting procedure using a Gaussian function a low sensitivity level was applied to the 2987–2849 cm21 spectral region using the
same software. In accordance with the software instructions, the area for the selected bands was calculated using the trapezoidal rule of integration and the center of mass was defined as the X coordinate of the point where the peak areas are equal on either side. To confirm the frequency positions of the peaks and differences in peak intensities at specific spectral windows, Savitzky-Golay’s second-derivative spectra were also obtained [19,38].
Author Contributions
Conceived and designed the experiments: MLSM BCV. Performed the experiments: BCV FGG MLSM. Analyzed the data: BCV MLSM. Contributed reagents/materials/analysis tools: MLSM BCV. Contributed to the writing of the manuscript: MLSM BCV.
References
1. Yang Y, Santamaria P (2003) Dissecting autoimmune diabetes through genetic manipulation of non-obese diabetic mice. Diabetologia 46: 1447–1464. 2. Colucci F, Bergman ML, Penha-Gonc¸alves C, Cilio CM, Holmberg D (1997)
Apoptosis resistance of nonobese diabetic peripheral lymphocytes linked to the Idd5 diabetes susceptibility region. Proc Natl Acad Sci USA 94: 8670–8674. 3. Kurtz DM, Tian L, Gower BA, Nagy TR, Pinkert CA, et al. (2000) Transgenic
studies of fatty acid oxidation gene expression in nonobese diabetic mice. J Lipid Res 41: 2063–2070.
4. Mukai T, Nagaki M, Imose M, Kimura K, Satake S, et al. (2006) Prevention of hepatic fibrosis in nonobese diabetic mice: a critical role for interferon-gamma. Liver Int 26: 1006–1014.
5. Ghiraldini FG, Crispim ACV, Mello MLS (2013) Effects of hyperglycemia and aging on nuclear sirtuins and DNA damage of mouse hepatocytes. Mol Biol Cell 24: 2467–2476.
6. Ghiraldini FG, Silveira AB, Kleinjan DA, Gilbert N, Mello MLS (2014) Genomic profiling of type-1 adult diabetic and aged normoglycemic mouse liver. BMC Endocrine Dis 14: 19.
7. Damasceno NB, Ghiraldini FG, Mello MLS (2013) Effects of type-1 diabetes mellitus on cell death, mitotic index and DNA methylation in HepG2 cells and mouse hepatocytes. 59o. Congr Brasil Gene´t, A´ guas de Lindoia 2013.Available: http://www.sbg.org.br (ISBN 978-85-89109-06-2), pp. 57.
8. Ghiraldini FG, Silva IS, Mello MLS (2012) Polyploidy and chromatin remodeling in hepatocytes from insulin-dependent diabetic and normoglycemic aged mice. Cytometry Part A 81: 755–764.
9. Mello MLS, Vidal BC (2012) Changes in the infrared microspectroscopic characteristics of DNA caused by cationic elements, different base richness and single-stranded form. PLoS ONE 7: e43169.
10. Banyay M, Gra¨slund A (2002) Structural effects of cytosine methylation on DNA sugar pucker studied by FTIR. J Mol Biol 324: 667–676.
11. Kelly JG, Najand GM, Martin FL (2011) Characterisation of DNA methylation status using spectroscopy (mid-IR versusRaman) with multivariate analysis. J Biophoton 4: 345–354.
12. Flett MSC (1970) The theoretical basis of infrared spectroscopy. In An Introduction to Spectroscopic Methods for the Identification of Organic Compounds (Scheinmann F, ed). Vol 1, Pergamon Press, Oxford. pp.109–122. 13. Mathlouthi M, Seuvre AM, Koenig JL (1986) F.T.-I.R. and laser-Raman spectra
of cytosine and cytidine. Carbohydr Res 146: 1–13.
14. Mohan S, Madivanane R (1993) Laser Raman and infrared spectroscopic studies on 5-methyl cytosine. Asian J Chem 5: 243–246.
15. Reusch W (1999) Virtual Text of Organic Chemistry. Available: http://www2. chemistry.msu.edu/faculty/reusch/VirtTxtJml/Spectrpy/InfraRed/infrared. htm#ir1 Accessed 2014 June 20.
16. Mello MLS, Vidal BC (2014) Analysis of the DNA Fourier transform-infrared microspectroscopic signature using an all-reflecting objective. Micron 61: 49–52. 17. Fox JJ, Martin AE (1940) Investigations of infra-red spectra. Determination of C-H frequencies (,3000 cm21) in paraffins and olefins, with some observations
on ‘‘polythenes’’. Proc R Soc London A 175: 208–233.
18. Eglinton G (1970) Applications of infrared spectroscopy to organic chemistry. In An Introduction to Spectroscopy Methods for the Identification of Organic Compounds (Scheinmann F, ed) Vol. 1, Pergamon Press, Oxford, p. 129, 139. 19. Zelig U, Mordechai S, Shubinsky G, Sahu RK, Huleihel M, et al. (2011) Pre-screening and follow-up of childhood acute leukemia using biochemical infrared analysis of peripheral blood mononuclear cells. Biochim Biophys Acta 1810: 827–835.
20. Alex S, Dupuis P (1989) FT-IR and Raman investigation of cadmium binding by DNA. Inorg Chim Acta 157: 271–281.
21. Hembram KPSS, Rao GM (2009) Studies on CNTs/DNA composites. Mat Sci Engin C 29: 1093–1097.
22. Arakawa H, Neault JF, Tajmir-Riahi HA (2001) Silver (I) complexes with DNA and RNA studied by Fourier Transform infrared spectroscopy and capillary electrophoresis. Biophys J 81: 1580–1587.
23. Yugami H, Shibayama Y, Matsuo S, Ishigame M, Shin S (1996) Proton sites and defect-interactions in SrZrO3 single crystals studied by infrared absorption
spectroscopy. Solid Sta Ionics 85: 319–322.
24. Yang P, Chen W, Chang F, Chen H, Lin C, et al. (2012) HepG2 cells infected withKlebsiella pneumoniashow DNA laddering at apoptotic and necrotic stages. Apoptosis 17: 154–163.
25. Shimanouchi T, Tsuboi M, Kyogoku Y (1964) Infrared spectra of nucleic acids and related compounds. In Advances in Chemical Physics, vol. 7 (ed. Duchesne J) John Wiley & Sons Inc, pp. 435–498.
26. Kyogoku Y, Tsuboi M, Shimanouchi T (1961) Infrared spectra of formamide-treated nucleic acids. J Mol Biol 3: 741–745.
between the European long tailed house miceMus domesticusandMus musculus. Chromosoma 99: 11–17.
28. Franklin RE, Gosling RG (1953) The structure of sodium thymonucleate fibres. I. The influence of water content. Acta Cryst 6: 673–677.
29. Vargason JM, Henderson K, Ho PS (2001) A crystallographic map of the transition from B-DNA to A-DNA. PNAS, Washington 98: 7265–7270. 30. Vargason JM (2002) The effect of cytosine methylation on DNA structure. PhD’
thesis. Oregon State Univ.
31. Vargason JM, Eichman BF, Ho PS (2000) The extended and eccentric E-DNA-structure induced by cytosine methylation or bromination. Nature Struct Biol 7: 758–761.
32. Anastassopoulou J, Boukaki E, Conti C, Ferraris P, Giorgini E, et al. (2009) Microimaging FT-IR spectroscopy on pathological breast tissues. Vibr Spectr 51: 270–275.
33. Nathan D, Crothers DM (2002) Bending and flexibility of methylated and unmethylatedEcoRI DNA. J Mol Biol 316: 7–17.
34. Tate PH, Bird AP (1993) Effects of DNA methylation on DNA-binding proteins and gene expression. Curr Op Genet Dev 3: 226–231.
35. Franchini DM, Schmitz KM, Petersen-Mahrt SV (2012) 5-methylcytosine DNA demethylation: more than losing a methyl group. Annu Rev Genet 46: 419–441. 36. Weber M, Davies JJ, Wittig D, Oakeley E, Haase M, et al. (2005) Chromosome-wide and promoter-specific analyses identify sites of differential DNA methylation in normal and transformed human cells. Nature Genet 37: 853– 862.
37. Vidal BC, Mello MLS (2011) Collagen type I amide I band infrared spectroscopy. Micron 42: 283–289.