Transcriptome analysis of
Pseudomonas
aeruginosa
PAO1 grown at both body and
elevated temperatures
Kok-Gan Chan1, Kumutha Priya1, Chien-Yi Chang2, Ahmad Yamin Abdul Rahman3, Kok Keng Tee4and Wai-Fong Yin1
1ISB (Genetics & Molecular Biology), Faculty of Science, University of Malaya, Kuala Lumpur, Malaysia
2School of Life Sciences, Heriot-Watt University, Edinburgh, United Kingdom 3BioEasy Sdn Bhd, Shah Alam, Selangor, Malaysia
4Department of Medical Microbiology, Faculty of Medicine, University of Malaya, Kuala Lumpur, Malaysia
ABSTRACT
Functional genomics research can give us valuable insights into bacterial gene function. RNA Sequencing (RNA-seq) can generate information on transcript abundance in bacteria following abiotic stress treatments. In this study, we used the RNA-seq technique to study the transcriptomes of the opportunistic nosocomial pathogenPseudomonas aeruginosaPAO1 following heat shock. Samples were grown at both the human body temperature (37
C) and an arbitrarily-selected temperature of 46
C. In this work using RNA-seq, we identified 133 genes that are differentially expressed at 46
C compared to the human body temperature. Our work identifies some keyP. aeruginosaPAO1 genes whose products have importance in both environmental adaptation as well as in vivo infection in febrile hosts. More importantly, our transcriptomic results show that many genes are only expressed when subjected to heat shock. Because the RNA-seq can generate high throughput gene expression profiles, our work reveals many unanticipated genes with further work to be done exploring such genes products.
Subjects Bioinformatics, Genomics, Microbiology
Keywords Heat shock, RNA sequencing, Pseudomonas aeruginosa PAO1, Transcriptome, Gene expression
INTRODUCTION
Pseudomonas aeruginosais an opportunistic nosocomial pathogen which is a threat to public health (Lyczak, Cannon & Pier, 2000). Its success as a pathogen is due to being well adapted to changes in environmental factors (Cheng et al., 2014;Livermore, 2002). Due to this versatility, its virulence determinants and host factorsP. aeruginosa is the known causal agent in a myriad of human diseases (Cheng et al., 2014).
P. aeruginosahas previously been shown to thrive in hostile environments and has a rapid response and adaptation to abiotic stresses such as elevated and reduced temperature (Farrell & Rose, 1968;Schurr et al., 1995). This rapid adaptation of
P. aeruginosais accompanied by changes in its genomic regulatory network modulating the global expression and activities of genes essential for their survival (Burrowes et al., 2006;
Submitted19 January 2016
Accepted15 June 2016
Published19 July 2016
Corresponding author
Kok-Gan Chan, [email protected]
Academic editor
Ugo Bastolla
Additional Information and Declarations can be found on page 15
DOI10.7717/peerj.2223
Copyright
2016 Chan et al.
Distributed under
Schuster et al., 2003). In one of the earliest studies conducted on heat shock response of P. aeruginosa,it was observed that the syntheses of 17 proteins was enhanced following the transfer of cells from 30 to 45C (Allan et al., 1988). It was later discovered that the principle sigma factor,s, encoded byrpoDA, was among the proteins expressed upon
elevation of temperature from 30 to 42
C (Fujita et al., 1993). Furthermore, the synthesis of rpoHandgroELmRNA are also induced following heat shock, suggesting that the transcription of these genes is regulated by heat shock RNA polymerases as well as by the principle RNA polymerase. The findings were further supported by the discovery of sequences for the polymerases in the upstream promoter region of the genes (Fujita et al., 1993;Fujita, Amemura & Aramaki, 1998). When bacterial cells are exposed to elevated temperatures, the transcription shifts froms70tos32. This enables the RNA polymerases
to recognise the heat shock genes which are crucial for its adaptation in the drastic change in the surrounding environment (Straus, Walter & Gross, 1990).
A more recent study carried out onP. aeruginosaisolated from cystic fibrosis (CF) patients small heat shock proteins (sHSPs), namely Hp25 and Hp18, were discovered. These sHSPs were highly expressed under both standard laboratory conditions and conditions that mimicked the sputum-like environment of the CF patients. The authors suggest that the discovery of the sHSPs in both conditions was due to the proteins acting as molecular chaperones helping with the adaptability of P. aeruginosato diverse environments (Sriramulu, 2009). Under stressful conditions, these sHSPs interact with affected proteins, preventing their aggregation, with the process continuing with the aid of chaperone proteins (Wang & Spector, 2000).
In order to understand the heat shock response ofPseudomonas, several studies on other species in the Pseudomonasgenus have been carried out. A study conducted onPseudomonas syringaeshows that the expression ofdnaKincreased significantly when cells that were initially incubated at 18
C were transferred to 35
C. However, the results indicated that although P. syringaeresponded by producing DnaK, it did not help in adjusting to the gradual change to an elevated temperature (Keith, Partridge & Bender, 1999). In another study inPseudomonas putidaKT2442, the role of several molecular chaperones, namely ClpB, DnaJ, CbpA, and DjlA, were elucidated. The increase in the expression heat shock proteins (Hsps) mentioned was not significant when transferred from 30 to 33C. However, when shifted to 35C the expression of the DnaJ, GroEL, HtpG, and ClpB was increased. At larger temperature shifts up to 42 C, expression of these Hsps was increased further. At a more elevated temperature of 45
C, expression of DnaK, GroEL, and HtpG increased only during the first 10 min while the expression of ClpB continued to increase (Ito et al., 2014).
investigate the transcriptional response ofP. aeruginosaPAO1 to elevated temperature using NGS methodologies. To address this, we have used the RNA-seq technique to look at changes in the transcriptome ofP. aeruginosaPAO1 exposed to heat shock. Previous heat shock studies have shown that a temperature difference of at least 15C between the normal and elevated growth temperature provides the best information (Ito et al., 2014). With reference to that study, we chose to growP. aeruginosa PAO1 at 37 and 46C.
MATERIALS AND METHODS
Culture conditions and growth study
Growth ofP. aeruginosa PAO1 was determined at 37 and 46
C. Briefly,P. aeruginosa PAO1 was cultured for 18 h at 37C. The overnight grown culture was adjusted to OD
600 of 0.01. Aliquots of cells (200mL) were then dispensed into wells of a sterile 96-well
microtitre plate (Priya, Yin & Chan, 2013;Tan, Yin & Chan, 2013) and incubated at 37 and 46
C, respectively. The OD600was measured at intervals of 4 h for 24 h using a microplate reader (Tecan Infinite M200, Mannerdorf, Switzerland). The growth ofP. aeruginosaat 37 and 46C was also determined by looking at its colony forming unit (CFU). The CFU count at the stipulated temperature was determined at desired time points. Briefly, 100mL of the cultures grown at 37 and 46C were serially diluted and 100mL diluted
cultures were plated on Luria-Bertani Agar (LB). The plates were incubated at 37 C for 18 h before the determination of CFU per mL.
Heat shock treatment of P. aeruginosaPAO1
P. aeruginosaPAO1 cells were taken from-80C stock cultures and grown on LB agar in order to obtain pure colonies. These were subsequently inoculated into fresh sterile LB broth for 18 h at 37C with shaking at 220 rpm. Overnight seed cultures were then sub-cultured (1 mL) into 100 mL of fresh, sterile LB broth and grown to mid-exponential phase (OD600= 0.5) at 37C. The 10 mL of culture was then transferred into sterile tube (50 mL volume tube) pre-warmed at 37 and 46C, respectively, and immediately exposed to heat shock for 30 min (with shaking) by incubating in water baths pre-heated to 37 and 46C, respectively. This was followed immediately by RNA extraction. Experiments were performed in triplicate.
RNA extraction and cDNA synthesis
protocols of ScriptSeqTMv2 RNA-seq Library Preparation Kit (Epicentre, WI, USA). The quality of the RNA-seq cDNA library was confirmed using Agilent Bioanalyzer-High Sensitivity DNA Chip.
cDNA library preparation and RNA-seq
Quantification of the RNA-seq transcriptome library was performed using a QubitÒ
dsDNA High Sensitivity (HS) Assay Kit (Life Technologies, CA, USA) and normalised to a concentration of 4 nM. Normalised samples were denatured with 0.2 N NaOH and diluted 20 pM using pre-chilled Hybridisation Buffer (HT1) (Illumina, CA, USA). The 20 pM transcriptome libraries were further diluted to 10 pM with pre-chilled HT1 buffer and combined with 1% denatured and diluted PhiX control prior to sequencing using MiSeq platform.
All resulting nucleotide sequence accession number is available in public databases. The DNA sequences from this transcriptomics project has been deposited at Sequence Read Archive (NCBI/SRA) under the accession numberSRP066875. The transcriptome data have been deposited in BioProject in GenBank via Bioproject numberPRJNA304652.
Validation of RNA-seq using real time-PCR (RT-PCR)
RT-PCR was performed to quantify and validate the level ofP. aeruginosaPAO1 gene expression that were affected when exposed to an elevated temperature.P. aeruginosa PAO1 cells were subjected to heat shock and their RNA was extracted once again as an independent experiment to determine the reproducibility of the data. One microgram of RNA was reverse transcribed into cDNA using the QuantiTect Reverse Transcription Kit (Qiagen, USA). For the quantitative RT-PCR, the amplification was performed using the KAPA SYBRÒ
FAST qPCR Kit Master Mix Universal (Kapa Biosystems, USA) on the Bio-Rad CFX96 real-time system (Bio-Rad, CA, USA). Genes from the upregulated and downregulated gene list obtained from RNA-seq result were selected and the primers for the genes were designed using Primer 3 version 0.4.0 (http://bioinfo.ut.ee/primer3-0.4.0/). The RT-PCR condition used was as follows: initial denaturation at 95
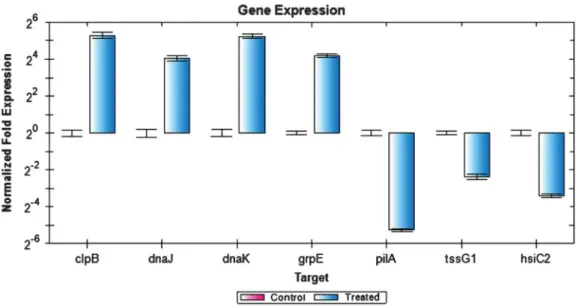
C for 3 min, followed by a 40 cycles of denaturation at 95C for 3 s and annealing/extension at 55.7C for 30 s. The fluorescent signals were quantified at the end of each cycle. Data obtained were analysed using the Bio-Rad CFX ManagerTMSoftware version 1.6. Reference genes with expression stability values (Mvalue) of less than 0.7 were selected as reference genes for normalisation. The selected reference genes werecheZ, proC, recA, rpoB, gyrB, oprL, andplsY(Matthijs et al., 2013;Savli et al., 2003). Upregulated genes:clpB, dnaJ, dnaKand grpEand downregulated genes:tssG1,hsiC2andpilAwere selected.
Differential expression analysis
subprograms in cufflinks package was used for differential expression purpose
(pcorrected value/q0.05) [18]. Fold change of the expression profile was measured using log2FPKM (Fragments per Kilobase of transcript per Million mapped reads). For QC and generation of plots expression, we used Volcano, Box, Scv, Density, Scatter plot, PCA and heat map as available in the R package cummeRbund (version 2.6.1) based on output from cuffdiff2. For RNA-seq analysis, the total number of reads per gene between samples was normalized using FPKM (Trapnell et al., 2010).
RESULTS
Survival studies
To study the heat shock response of the nosocomial pathogenP. aeruginosaPAO1, we first determined the growth ofP. aeruginosaPAO1 at 37 and 46
C (Fig. 1). Growth curve studies revealed that P. aeruginosaPAO1 could adapt to temperature at 46
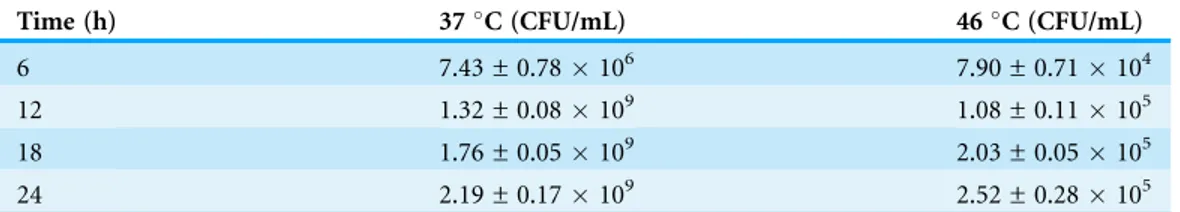
C (Fig. 1). Following a 30 min heat shock, the CFU count for P. aeruginosaPAO1 at 37 and 46C were 1.37108and 1.33108, respectively. The growth rate ofP. aeruginosaPAO1 grown at 37 and 46 C declined over 24 h and it appears that 46C has adverse effect on the growth ofP. aeruginosa PAO1 (Table 1).
In order to understand the cellular response ofP. aeruginosaPAO1 to heat shock, we utilised an RNA-seq approach to study transcriptome changes. Experiments were carried out in triplicate with cells grown at 37
C followed by heat shock at 46
C for 30 min. More than 90% of all trimmed RNA-seq reads aligned to coding regions of theP. aeruginosa genome (Table 2). Overall expression levels in the triplicate samples of both control and heat
Figure 1 Growth curve ofP. aeruginosaPAO1 incubated at 37
C (circle) and 46
C (square).
Table 1 P. aeruginosaPAO1 cells viability at 37 and 46C.
Time (h) 37C (CFU/mL) 46C (CFU/mL)
6 7.43 ± 0.78106 7.90 ± 0.71104
12 1.32 ± 0.08109 1.08 ± 0.11105
18 1.76 ± 0.05109 2.03 ± 0.05105
Table 2 Summary of illumina RNA-seq data.P. aeruginosaPAO1 cells grown at 37C (Control) and exposed to 46
C for 30 min (Heat), numbers (_1, _2, _3) following “Control” and “Heat” represent replicate experiment in triplicate.
Label Total reads Overall read mapping rate
Control_1 5,220,526 91.00%
Control_2 4,203,880 91.30%
Control_3 2,989,148 92.20%
Heat_1 4,537,188 89.90%
Heat_2 4,613,056 90.20%
Heat_3 7,639,516 90.80%
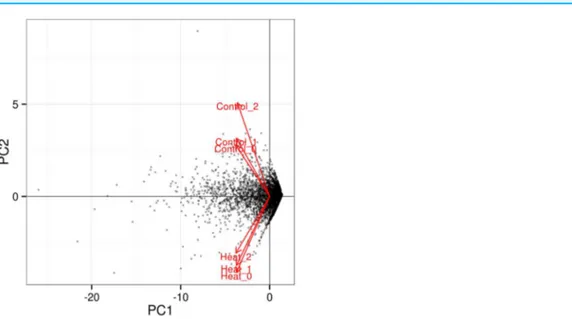
Figure 2 Comparison of significant gene expression betweenP. aeruginosa PAO1 samples with (Heat) and without heat shock (Control). The significant level whether it is highly similar is made based on figures generated withpcorrected value0.05.
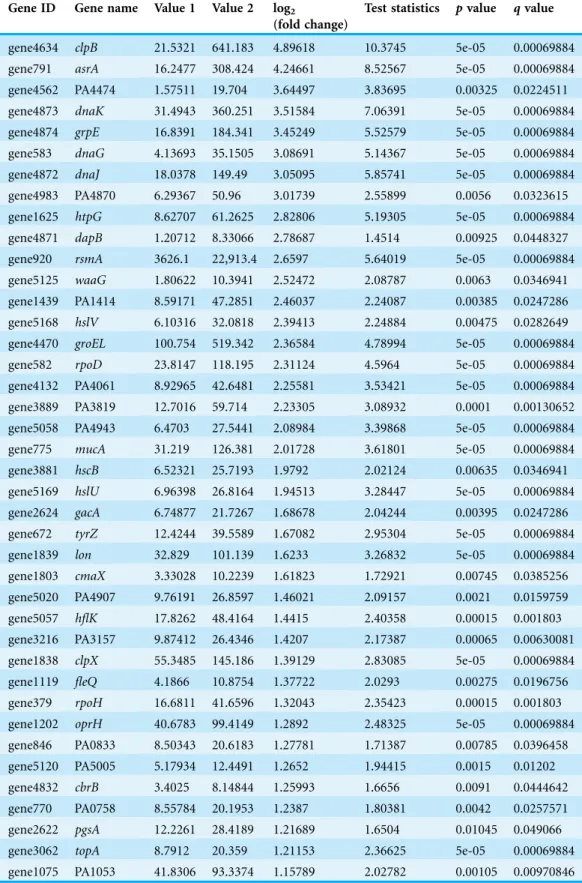
Table 3 P. aeruginosaPAO1 genes significantly upregulated when exposed to heat shock.The below table shows the list of the significant upregulated genes with a cut-off value ofq< 0.05.
Gene ID Gene name Value 1 Value 2 log2
(fold change)
Test statistics pvalue qvalue
gene4634 clpB 21.5321 641.183 4.89618 10.3745 5e-05 0.00069884 gene791 asrA 16.2477 308.424 4.24661 8.52567 5e-05 0.00069884 gene4562 PA4474 1.57511 19.704 3.64497 3.83695 0.00325 0.0224511
gene4873 dnaK 31.4943 360.251 3.51584 7.06391 5e-05 0.00069884 gene4874 grpE 16.8391 184.341 3.45249 5.52579 5e-05 0.00069884 gene583 dnaG 4.13693 35.1505 3.08691 5.14367 5e-05 0.00069884 gene4872 dnaJ 18.0378 149.49 3.05095 5.85741 5e-05 0.00069884 gene4983 PA4870 6.29367 50.96 3.01739 2.55899 0.0056 0.0323615 gene1625 htpG 8.62707 61.2625 2.82806 5.19305 5e-05 0.00069884 gene4871 dapB 1.20712 8.33066 2.78687 1.4514 0.00925 0.0448327
gene920 rsmA 3626.1 22,913.4 2.6597 5.64019 5e-05 0.00069884 gene5125 waaG 1.80622 10.3941 2.52472 2.08787 0.0063 0.0346941 gene1439 PA1414 8.59171 47.2851 2.46037 2.24087 0.00385 0.0247286 gene5168 hslV 6.10316 32.0818 2.39413 2.24884 0.00475 0.0282649 gene4470 groEL 100.754 519.342 2.36584 4.78994 5e-05 0.00069884 gene582 rpoD 23.8147 118.195 2.31124 4.5964 5e-05 0.00069884 gene4132 PA4061 8.92965 42.6481 2.25581 3.53421 5e-05 0.00069884
gene3889 PA3819 12.7016 59.714 2.23305 3.08932 0.0001 0.00130652 gene5058 PA4943 6.4703 27.5441 2.08984 3.39868 5e-05 0.00069884 gene775 mucA 31.219 126.381 2.01728 3.61801 5e-05 0.00069884 gene3881 hscB 6.52321 25.7193 1.9792 2.02124 0.00635 0.0346941 gene5169 hslU 6.96398 26.8164 1.94513 3.28447 5e-05 0.00069884 gene2624 gacA 6.74877 21.7267 1.68678 2.04244 0.00395 0.0247286 gene672 tyrZ 12.4244 39.5589 1.67082 2.95304 5e-05 0.00069884
gene1839 lon 32.829 101.139 1.6233 3.26832 5e-05 0.00069884 gene1803 cmaX 3.33028 10.2239 1.61823 1.72921 0.00745 0.0385256 gene5020 PA4907 9.76191 26.8597 1.46021 2.09157 0.0021 0.0159759 gene5057 hflK 17.8262 48.4164 1.4415 2.40358 0.00015 0.001803 gene3216 PA3157 9.87412 26.4346 1.4207 2.17387 0.00065 0.00630081 gene1838 clpX 55.3485 145.186 1.39129 2.83085 5e-05 0.00069884
gene1119 fleQ 4.1866 10.8754 1.37722 2.0293 0.00275 0.0196756 gene379 rpoH 16.6811 41.6596 1.32043 2.35423 0.00015 0.001803 gene1202 oprH 40.6783 99.4149 1.2892 2.48325 5e-05 0.00069884 gene846 PA0833 8.50343 20.6183 1.27781 1.71387 0.00785 0.0396458 gene5120 PA5005 5.17934 12.4491 1.2652 1.94415 0.0015 0.01202 gene4832 cbrB 3.4025 8.14844 1.25993 1.6656 0.0091 0.0444642 gene770 PA0758 8.55784 20.1953 1.2387 1.80381 0.0042 0.0257571 gene2622 pgsA 12.2261 28.4189 1.21689 1.6504 0.01045 0.049066
gene3062 topA 8.7912 20.359 1.21153 2.36625 5e-05 0.00069884 gene1075 PA1053 41.8306 93.3374 1.15789 2.02782 0.00105 0.00970846
shock samples were similar to each other (Fig. 2). The significant level whether it is highly similar is made based on figures generated withpcorrected value0.05. The RNA-seq data obtained therefore have sufficient quality for further transcriptome analysis.
Further analysis among the triplicates of each heat treatment experiments at 37 and 46
C showed that the RNA-seq datasets from similar treatments clustered together, as depicted in the PCA plot (Fig. 3). The significant level whether it is clear profile separation is made based on figures generated withpcorrected value0.05. This indicates that experimental replication was good and there was little variation among the triplicates of the same treatment.
In total 133 genes were significantly differentially expressed whenP. aeruginosaPAO1 cells were grown under heat shock at 46C (Data S1).Tables 3and4show the list of the significant up- and downregulated genes with a cut-off value ofq< 0.05. The volcano plot (Fig. 4) indicates the genes affected by the heat shock at 46C. The red dots in the volcano plot represents the 133 significant genes (q0.05) while the black dots represent 5,545 non-significant genes.
The Box plot (Fig. 5) shows thatP. aeruginosaPAO1 gene global expression at 37 C is slightly lower than at 46C suggesting that when exposed to elevated temperature.
P. aeruginosa PAO1 cells respond to heat very quickly (within 30 min). There is a large variance in the response ofP. aeruginosaPAO1 genes to heat shock at 46
C, as evidenced by the large scatter of values along the vertical axis inFig. 5. Nonetheless, the median for gene expression values is still higher inP. aeruginosaPAO1 cells subjected to heat shock at 46C compared to 37C. Our transcriptome analysis therefore shows that several genes in
P. aeruginosa PAO1 are temperature-dependent (Fig. S1).
Table 3 (continued ).
Gene ID Gene name Value 1 Value 2 log2
(fold change)
Test statistics pvalue qvalue
gene2772 PA2735 30.8456 66.7609 1.11394 2.22459 0.0002 0.00231154 gene5358 rho 12.316 26.3594 1.09778 2.00644 0.00085 0.00810873 gene4882 lldP 4.00184 8.55432 1.09599 1.60525 0.00815 0.0408179 gene5562 PA5436 7.08683 14.5432 1.03713 1.71082 0.00505 0.0294665 gene3027 rne 24.3393 49.8051 1.03301 2.10105 0.00025 0.00268304 gene3884 iscS 24.603 48.5117 0.9795 1.92781 0.00175 0.0136591 gene4784 hitA 10.4753 20.2269 0.949286 1.53913 0.00885 0.0435971
gene727 PA0716 82.3112 157.32 0.934543 1.88924 0.0009 0.00845156 gene1554 zipA 24.8322 45.7464 0.881446 1.65677 0.0039 0.0247286 gene3946 narG 4.40154 8.07275 0.875052 1.61398 0.0061 0.0345435 gene4349 nusG 33.143 60.2758 0.862876 1.51907 0.01085 0.0497775 gene5050 rnr 7.88061 13.4832 0.774781 1.48185 0.01055 0.0491516 gene4862 ftsH 18.7479 30.9454 0.722993 1.46642 0.00975 0.046506
gene2520 PA2486 0 14.7402 inf -nan 0.00145 0.0119377
gene4941 PA4828 0 12.6143 inf -nan 5e-05 0.00069884
Note:
Table 4 P. aeruginosaPAO1 genes significantly downregulated when exposed to heat shock.The below table shows the list of the significant downregulated genes with a cut-off value ofq< 0.05.
Gene ID Gene name Value 1 Value 2 log2
(fold change)
Test statistics pvalue qvalue
gene1688 hsiC2 22.6564 0.992143 -4.51323 -4.66897 0.0091 0.0463781
gene1117 PA1095 129.204 7.21324 -4.16286 -3.14279 0.00265 0.0191886
gene4346 PA4272.1 890.17 76.9649 -3.53181 -3.9605 5.00E-05 0.00069884
gene3798 PA3729 35.579 3.10911 -3.51645 -5.52012 5.00E-05 0.00069884
gene1686 hsiA2 19.5494 2.11828 -3.20616 -3.53665 0.0001 0.00130652
gene3555 tli5 72.136 8.88402 -3.02143 -5.06997 5.00E-05 0.00069884
gene5286 arcD 399.882 49.9991 -2.9996 -4.93225 5.00E-05 0.00069884
gene2724 vgrG4 13.6866 1.84111 -2.89412 -3.80312 5.00E-05 0.00069884
gene96 PA0095 8.16707 1.10164 -2.89017 -2.76659 0.00135 0.0114275
gene982 dps 142.736 19.455 -2.87514 -4.35522 5.00E-05 0.00069884
gene4614 pilA 49.0763 6.75242 -2.86155 -2.53313 0.01025 0.0485059
gene85 tssC1 24.7043 3.69094 -2.7427 -4.03767 5.00E-05 0.00069884
gene3101 rmf 78.8232 12.3991 -2.66838 -1.41941 0.0094 0.0451952
gene100 PA0099 29.7865 4.74403 -2.65048 -3.77489 5.00E-05 0.00069884
gene5140 metY 10.9322 1.89052 -2.53173 -2.42142 0.00025 0.00268304
gene4330 rplV 73.7324 13.723 -2.4257 -2.23755 0.0036 0.0243101
gene568 PA0563 74.2912 14.1381 -2.39361 -2.52297 0.00425 0.0258005
gene4663 PA4571 13.6487 2.62789 -2.37679 -3.4702 5.00E-05 0.00069884
gene4324 rplX 126.547 24.3781 -2.37602 -2.89574 0.0001 0.00130652
gene4331 rpsS 993.38 192.891 -2.36456 -3.71984 5.00E-05 0.00069884
gene5030 PA4917 16.1805 3.2644 -2.30937 -1.6795 0.0033 0.0225375
gene1784 cysB 63.673 13.7047 -2.21601 -3.32536 5.00E-05 0.00069884
gene3692 PA3623 14.5214 3.13913 -2.20975 -2.07658 0.0063 0.0346941
gene4615 pilB 7.14771 1.56705 -2.18943 -2.087 0.0085 0.042219
gene5048 rpsF 48.1814 10.7881 -2.15903 -2.29553 0.00685 0.0367576
gene90 tssG1 2.89407 0.709339 -2.02855 -2.53313 0.01025 0.0485059
gene1091 PA1069 7.53594 1.91221 -1.97854 -2.60782 0.00025 0.00268304
gene4828 dksA 933.27 242.762 -1.94275 -3.83989 5.00E-05 0.00069884
gene1394 PA1369 104.664 30.1285 -1.79656 -3.47606 5.00E-05 0.00069884
gene4551 PA4463 768.625 225.296 -1.77046 -3.50993 5.00E-05 0.00069884
gene1586 ccoN2 14.3183 4.55088 -1.65364 -2.45509 0.00045 0.0045839
gene1583 ccoP2 16.7355 5.37344 -1.63899 -2.09732 0.0037 0.0247078
gene5683 atpH 37.3157 12.1271 -1.62154 -2.24178 0.0014 0.0116861
gene411 pilG 43.3645 14.2223 -1.60836 -1.88132 0.0048 0.0282824
gene5288 arcB 458.603 150.822 -1.6044 -3.12551 5.00E-05 0.00069884
gene1004 pyoS5 52.8453 17.5083 -1.59374 -3.17122 5.00E-05 0.00069884
gene1456 rsaL 627.92 209.122 -1.58624 -2.86187 5.00E-05 0.00069884
gene292 oprE 20.563 6.97732 -1.5593 -2.60418 5.00E-05 0.00069884
gene4352 tufB 29.6318 10.2742 -1.52813 -2.49072 5.00E-05 0.00069884
gene547 PA0542 65.1469 22.9895 -1.50272 -2.22129 0.0011 0.0100167
Table 4 (continued ).
Gene ID Gene name Value 1 Value 2 log2
(fold change)
Test statistics pvalue qvalue
gene4138 oprG 27.1767 9.75134 -1.4787 -2.06861 0.0021 0.015976
gene5233 glnA 83.3418 30.4831 -1.45103 -2.97103 5.00E-05 0.00069884
gene3389 clpP2 23.5314 8.74695 -1.42774 -1.8175 0.007 0.0372301
gene3722 frr 271.131 103.065 -1.39543 -2.83483 5.00E-05 0.00069884
gene308 PA0306a 39.0824 15.5097 -1.33335 -1.82724 0.00395 0.0247286
gene5035 azu 166.858 66.2508 -1.33261 -2.52071 5.00E-05 0.00069884
gene2673 aceA 17.8349 7.20472 -1.30769 -2.22915 0.00055 0.00541885
gene1560 PA1533 104.495 42.4434 -1.29983 -2.00187 0.00245 0.0179567
gene5680 atpD 29.3639 12.0031 -1.29064 -2.40291 5.00E-05 0.00069884
gene5623 nrdJa 8.16542 3.36928 -1.27709 -1.95924 0.0016 0.0126526
gene1176 imm2 134.36 56.4069 -1.25216 -1.83929 0.0038 0.0247286
gene4588 PA4500 8.97191 3.82949 -1.22826 -1.72289 0.00615 0.0345435
gene833 PA0820 25.8366 11.1948 -1.20659 -1.74814 0.0039 0.0247286
gene1535 Tli4 22.776 9.92586 -1.19825 -1.80905 0.00295 0.0206157
gene1457 lasI 62.0684 27.0521 -1.19812 -2.10094 0.0005 0.00500833
gene3201 wbpM 21.5844 9.88673 -1.12643 -2.13953 0.00015 0.001803
gene3907 PA3836 16.2993 7.47594 -1.12448 -1.65887 0.0072 0.0379579
gene656 vfr 25.6241 11.8251 -1.11565 -1.55319 0.0107 0.0494669
gene4399 mvaT 1,061.23 491.469 -1.11057 -2.22426 0.00025 0.00268304
gene414 pilJ 13.8071 6.57893 -1.06948 -1.91188 0.0015 0.01202
gene3801 PA3732 230.837 111.46 -1.05035 -2.14155 0.0002 0.00231154
gene3598 bfrB 3,320.52 1,612.16 -1.04241 -2.13433 0.00035 0.00369035
gene5682 atpA 96.9071 47.1674 -1.03881 -2.14129 0.0004 0.00414483
gene1116 fliD 13.5333 6.6493 -1.02524 -1.65814 0.0066 0.0357351
gene1976 PA1939 8.32965 4.10377 -1.0213 -1.59073 0.0075 0.0385256
gene523 nirS 48.272 24.8277 -0.959236 -1.94776 0.0012 0.0106059
gene5157 pilO 108.242 55.8768 -0.953941 -1.64711 0.0042 0.0257571
gene4451 sodB 285.132 147.322 -0.952659 -1.96854 0.00115 0.0103157
gene4680 ccpR 20.1423 10.4282 -0.949741 -1.57754 0.0077 0.0392178
gene5155 pilQ 12.2848 6.43035 -0.9339 -1.68001 0.00445 0.0267445
gene1613 sdhB 252.039 134.811 -0.902714 -1.85065 0.00135 0.0114275
gene1179 nrdB 63.8121 34.8794 -0.871454 -1.77239 0.0023 0.0172787
gene978 oprD 27.184 14.9777 -0.859943 -1.61922 0.0059 0.0337705
gene1175 pys2 96.6484 53.9177 -0.841987 -1.70527 0.0024 0.0178074
gene3937 PA3866 57.9267 32.6472 -0.827268 -1.70364 0.00285 0.0201512
gene5362 hemB 44.5942 25.3888 -0.812662 -1.57048 0.00735 0.0384117
gene2595 PA2560 11.782 0 -inf -nan 0.00015 0.001803
gene2851 PA2805 7.48308 0 -inf -nan 0.00135 0.0114275
Note:
Figure 4 Volcano plot ofP. aeruginosaPAO1 gene expression pattern.In the volcano plot, the red dot shows significant genes below or at alpha = 0.05; Control: exposure to 37C; Heat: exposure to 46C.
Figure 5 Box plot of normalized expression values of RNA inP. aeruginosaPAO1 exposed to 37 and 46C.The Box plot shows that how log
2transformed values of the expressed genes inP. aeruginosa
A number ofP. aeruginosa PAO1 genes are regulated by temperature
Of the 133 differentially expressed genes identified (q0.05 fixed as the cut-off values), 55 genes were upregulated (Table 3) and 78 genes were downregulated (Table 4). The gene most upregulated under our 30 min heat shock experiment at 46
C wasclpB. ClpBis a well-known heat shock gene in bacteria. In our study, its expression was much higher than all other heat shock genes (log2fold change of 4.896). Another highly upregulated gene was one of unknown function. Therefore, its role in heat shock response needs to be further investigated.
Figure 6depicts the expression of selected genes quantified using RT-PCR. Expression levels of the genes tested were closely correlated with the data obtained from RNA-seq experiment. Notably, clpB, dnaJ, dnaK,andgrpEgenes were upregulated whiletssG1, hsiC2,andpilAgenes were downregulated. However, the expression values obtained by RT-PCR were slightly higher compared to the RNA-seq expression value. This could be due to the use of gene specific primers in the RT-PCR compared to the RNA-seq, which used universal PCR primers for the cDNA amplification step. Additionally, the samples used for RT-PCR were from an independent heat shock experiment, which may account for the slight variation in the overall gene expression values.
DISCUSSION
It is anticipated that bacteria are subject to many abiotic changes in both the external environment and in a mammalian host. One of the frequent abiotic stresses that many pathogens such asP. aeruginosaPAO1 will encounter is elevated temperature. In order to study theP. aeruginosaPAO1 heat shock response, we used RNA-seq coupled with NGS.
We performed a global transcriptional analysis of gene expression after exposing this opportunistic pathogen to heat shock.
The gene most upregulated under our 30 min heat shock experiment wasclpB. It has previously been documented that ClpB plays a vital role in the bacterial heat shock response and adaptation to elevated temperatures, being responsible for breaking down massive bacterial protein aggregates (Schirmer et al., 1996). The levels of ClpB and other chaperones, such as DnaKJ, GrpE, and GroESL, need to be in balance (Kedzierska & Matuszewska, 2001). In this work,dnaK, dnaJ, groELwere expressed in that descending order, which is in agreement with the work ofKedzierska & Matuszewska (2001). Another group of genes classified as being involved in damage control and repair were also significantly upregulated. Among these were the genesgroEL,grpEandhslUwhich could potentially provide more protection against the damage caused by heat shock (Mogk et al., 1999;Motohashi et al., 1999;Zolkiewski, 1999).
The second most highly over expressed gene in the heat shock experiment was PA0779 (asrAgene). Overexpression ofasrAhas previously been reported to lead to the induction of the heat shock response inP. aeruginosa(Kindrachuk et al., 2011). Our transcriptome data are there for comparable to the work ofKindrachuk et al. (2011)from two
perspectives: (i) The heat shock geneshtpG,groES,clpB,dnaJandhslVbut notibpAgene were induced by overexpression ofasrA gene, and (ii) the known heat shock sigma factor rpoH is involved in mediatingP. aeruginosastress response to tobramycin and heat shock through asrA. In the transcriptome ofP. aeruginosa PAO1 cells subject to heat shock we observed the upregulation of rpoH, a well-coordinated phenomenon related to the upregulation of PA0779 (asrA gene). It has been reported that the function of AsrA protein goes beyond simply the heat shock response and that it is also a key mediator of tobramycin antibiotic response (Kindrachuk et al., 2011).
Another interesting finding in ourP. aeruginosaPAO1 heat shock experiments is the upregulation of RsmA (Regulator of secondary metabolism > 2-fold). RsmA or CsrA (carbon storage regulator) is a RNA-binding protein that acts as a posttranscriptional regulatory protein in P. aeruginosa. RsmA has been implicated in a number of processes such as the regulation of secondary metabolism, and the expression of several genes related to quorum sensing, motility and virulence determinants (Kay et al., 2006).
InP. aeruginosa, RsmA has been shown to negatively control the expression of several virulent genes and quorum sensing (Pessi et al., 2001). RsmA has also been shown to exert positive effects on swarming motility, lipase and rhamnolipid (Heurlier et al., 2004). In our work, the quorum sensing genelasIis significantly downregulated, which is in agreement with the reported work ofPessi et al. (2001). The flagella cap protein genefliDwas also downregulated in our study. As flagella is one of the required features for swarming in P. aeruginosa(Kohler et al., 2000) it is postulated that motility could be affected by elevated heat.
RsmA coordinates its regulation with a small non-coding regulatory RNA molecule, RsmZ (RsmB) (Timmermans & Van Melderen, 2010). In this work,rsmZwas
of RsmA regulation could be minimised due to the downregulation ofrsmZ. Also, in P. aeruginosa, RsmY but not RsmZ, can be bound and stabilized by the RNA chaperone protein Hfq effectively blocking the action of RsmA (Sorger-Domenigg et al., 2007). In our work, neither RsmY nor Hfq were detected, implying that Hfq is irrelevant in the response ofP. aeruginosaPAO1 to elevated temperature.
The major structural component of bacterial cells is the cell wall, which provides physical protection against environmental stresses such as heat shock. Lipopolysaccharide biosynthesis is an important endotoxin and key component of the bacterial cell wall and membrane. In our work, another gene significantly upregulated waswaaG,which is responsible for lipopolysaccharide biosynthesis. Suggesting that when exposed to high temperature,P. aeruginosaPAO1 upregulates endotoxin production.
The gene (wbpD) responsible forN-acetyltransferases which is important forO-antigen orO-polysaccharide biosynthesis inP. aeruginosaPAO1 (Wenzel et al., 2005), and it is this region which confers serum resistance to this pathogen (Rocchetta, Burrows & Lam, 1999). Our data imply that when exposed to high temperature such as fever condition in the host being infected byP. aeruginosa PAO1, upregulation of genes important for
lipopolysaccharide andO-polysaccharide biosynthesis confers endotoxin production and resistant to serum killing, thus providing a means to overcome the host defence. This result also suggests a molecular sensing and response ofP. aeruginosaPAO1 on the changes from the environment to the mammalian host and fever condition.
One of the major effects of heat shock in bacteria is a loss of genome integrity. Three major processes, namely DNA replication, DNA recombination, and DNA repair can help to combat this (Klein & Kreuzer, 2002) but these processes can also be affected by heat changes (Lo´pez-Garcı´a & Forterre, 2000). Our work showed the upregulation ofdnaG, a primase that synthesizes a primer that is essential for DNA replication. We postulate that during heat shock, DNA replication is upregulated, facilitated in part by the dnaGgene. The increase in DNA content helping to maintain genome stability, fidelity and integrity under high heat in this pathogen.
We also found that the RNA polymerase core enzyme generpoDwas upregulated during heat shock. This is in agreement with previously reported work ofAramaki & Fujita (1999). The expression ofrpoD, together with other sigma factors such asrpoHandrpoBhave been well-documented for their role in the fitness of species such asE. coli(Barrick et al., 2010) andP. aeruginosa(MacLean & Buckling, 2009). The upregulation ofrpoBin our work leads us to speculate that this will increase survival fitness enablingP. aeruginosaPAO1 to withstand the deleterious effect of exposure to increased temperature.
The majority of the significantly downregulated genes identified in this study are of unknown functions and will require further analysis. However, some of the top
are currently unknown. Two genes belonging to this systemtssG1andhsiC2were under-expressed. Down regulation of these genes may helpP. aeruginosaPAO1 to conserve energy enabling them to produce proteins that protect them at such elevated temperature.
Surprisingly, amongst the genes significantly downregulated inP. aeruginosaPAO1, are those of type IV pili genes. pilA, pilB, pilJ, pilO, pilQ(in ascending order) were all downregulated.P. aeruginosaexpresses polar type IV pili for adhesion to various materials and twitching motility (Chiang, Habash & Burrows, 2005). It has been reported that in dispersedP. aeruginosaPAO1 under nutrient-limiting conditions, biofilm dispersion is associated with a decreased expression of pilus (pilA) genes cells (Sauer et al., 2004). In light of this, it appears that biofilm dispersion could be affected by elevated heat, as judged by the reduction in the expression of a myriad of type IV pili genes. In order to avoid the deleterious effect of heat shockP. aeruginosaPAO1 may disperse from the static biofilm and convert to planktonic cells which are free to escape the heated site.
To conclude, heat shock has a profound impact in the opportunistic pathogen
P. aeruginosaPAO1. It affects a number of key genes related to a number of processes. Chief amongst these are chaperones, heat shock proteins, proteases, heat shock-related sigma factor, and posttranscriptional regulatory proteins (regulating secondary metabolism and the expression of virulence). In addition, genes involved in regulating quorum sensing, motility and membrane and pili and biofilm formation are also differentially regulated by heat shock. We believe that transcriptome analysis using RNA-seq technology can be a very useful approach to study gene expression profiling and further understand the mechanism employed by pathogens, especially in establishing an infection.
ACKNOWLEDGEMENTS
The authors are grateful to and thank Dr Ross Alexander for critically reading the manuscript.
ADDITIONAL INFORMATION AND DECLARATIONS
Funding
This research was financially supported by the University of Malaya High Impact Research (HIR) UM-MOHE HIR Grants (UM.C/625/1/HIR/MOHE/CHAN/14/1, No. H-50001-A000027; UM.C/625/1/HIR/MOHE/CHAN/01, No. A000001-50001) to Kok-Gan Chan. Kumutha Priya received financial support from PPP Grant
(PG081-2015B). The funders had no role in study design, data collection and analysis, decision to publish, or preparation of the manuscript.
Grant Disclosures
The following grant information was disclosed by the authors:
University of Malaya High Impact Research (HIR) UM-MOHE HIR Grants: UM.C/625/1/HIR/MOHE/CHAN/14/1, No. H-50001-A000027: UM.C/625/1/HIR/ MOHE/CHAN/01, No. A000001-50001.
Competing Interests
Ahmad Yamin Abdul Rahman is an employee of BioEasy Sdn Bhd.
Author Contributions
Kok-Gan Chan conceived and designed the experiments, performed the experiments, analyzed the data, contributed reagents/materials/analysis tools, wrote the paper, prepared figures and/or tables, reviewed drafts of the paper.
Kumutha Priya performed the experiments, analyzed the data, wrote the paper,
prepared figures and/or tables.
Chien-Yi Chang performed the experiments, analyzed the data, wrote the paper, prepared figures and/or tables.
Ahmad Yamin Abdul Rahman performed the experiments, analyzed the data, wrote the paper, prepared figures and/or tables.
Kok Keng Tee performed the experiments, analyzed the data, wrote the paper.
Wai-Fong Yin conceived and designed the experiments, performed the
experiments, analyzed the data, contributed reagents/materials/analysis tools, wrote the paper.
Data Deposition
The following information was supplied regarding data availability:
The DNA sequences from this transcriptomics project are deposited at Sequence Read Archive (NCBI/SRA) under the accession numberSRP066875. The transcriptome data are deposited in BioProject in GenBank via Bioproject numberPRJNA304652
accessible at:
http://www.ncbi.nlm.nih.gov/bioproject/?term=PRJNA304652.
Supplemental Information
Supplemental information for this article can be found online athttp://dx.doi.org/ 10.7717/peerj.2223#supplemental-information.
REFERENCES
Allan B, Linseman M, MacDonald LA, Lam JS, Kropinski AM. 1988.Heat shock response of
Pseudomonas aeruginosa.Journal of Bacteriology170(8):3668–3674.
Andrews S. 2010.FastQC: a quality control tool for high throughput sequence data.Available at
http://www.bioinformatics.babraham.ac.uk/projects/fastqc/.
Aramaki H, Fujita M. 1999.In vitro transcription analysis of rpoD inPseudomonas aeruginosaPAO1.FEMS Microbiology Letters180(2):311–316
DOI 10.1111/j.1574-6968.1999.tb08811.x.
Barrick JE, Kauth MR, Strelioff CC, Lenski RE. 2010.Escherichia colirpoB mutants have increased evolvability in proportion to their fitness defects.Molecular Biology and Evolution
27(6):1338–1347DOI 10.1093/molbev/msq024.
Burrowes E, Baysse C, Adams C, O’Gara F. 2006.Influence of the regulatory protein RsmA on cellular functions inPseudomonas aeruginosaPAO1, as revealed by transcriptome analysis.
Chan K-G, Yin W-F, Lim YL. 2014.Complete genome sequence ofPseudomonas aeruginosastrain YL84, a quorum-sensing strain isolated from dompost.Genome Announcement2(2):e246-14
DOI 10.1128/genomeA.00246-14.
Chan XY, Chang CY, Hong KW, Tee KK, Yin WF, Chan KG. 2013.Insights of biosurfactant producingSerratia marcescensstrain W2.3 isolated from diseased tilapia fish: a draft genome analysis.Gut Pathogens5(1):29DOI 10.1186/1757-4749-5-29.
Chan XY, Chua KH, Puthucheary SD, Yin WF, Chan KG. 2012.Draft genome sequence of an
Aeromonassp. strain 159 clinical isolate that shows quorum-sensing activity.Journal of Bacteriology194(22):6350DOI 10.1128/JB.01642-12.
Cheng HJ, Ee R, Cheong YM, Tan W-S, Yin WF, Chan KG. 2014.Detection of quorum sensing activity in the multidrug-resistant clinical isolatePseudomonas aeruginosastrain GB11.Sensors
14(7):12511–12522DOI 10.3390/s140712511.
Chiang P, Habash M, Burrows LL. 2005.Disparate subcellular localization patterns of
Pseudomonas aeruginosatype IV pilus ATPases involved in twitching motility.Journal of Bacteriology187(3):829–839DOI 10.1128/JB.187.3.829-839.2005.
Farrell J, Rose AH. 1968.Cold shock in a mesophilic and a psychrophilicPseudomonas.Journal of General Microbiology50(3):429–439DOI 10.1099/00221287-50-3-429.
Filloux A, Hachani A, Bleves S. 2008.The bacterial type VI secretion machine: yet another player for protein transport across membranes.Microbiology154(6):1570–1583
DOI 10.1099/mic.0.2008/016840-0.
Forde BM, Ben Zakour NL, Stanton-Cook M, Phan M-D, Totsika M, Peters KM, Chan KG, Schembri MA, Upton M, Beatson SA. 2014.The complete genome sequence ofEscherichia coli
EC958: a high quality reference sequence for the globally disseminated multidrug resistant
E. coliO25b:H4-ST131 clone.PLoS ONE9(8):e104400DOI 10.1371/journal.pone.0104400.
Fujita M, Amemura A, Aramaki H. 1998.Transcription of thegroESLoperon inPseudomonas aeruginosaPAO1.FEMS Microbiology Letters163(2):237–242
DOI 10.1111/j.1574-6968.1998.tb13051.x.
Fujita M, Tanaka K, Takahashi H, Amemura A. 1993.Organisation and transcription of the principlesgene (rpoDA) ofPseudomonas aeruginosaPAO1: involvement of as32-like RNA polymerase inrpoDAgene expression.Journal of Bacteriology175(4):1069–1074.
Heurlier K, Williams F, Heeb S, Dormond C, Pessi G, Singer D, Ca´mara M, Williams P, Haas D. 2004.Positive control of swarming, rhamnolipid synthesis, and lipase production by the posttranscriptional RsmA/RsmZ system inPseudomonas aeruginosaPAO1.Journal of Bacteriology186(10):2936–2945DOI 10.1128/JB.186.10.2936-2945.2004.
Ito F, Tamiya T, Ohtsu I, Fujimura M, Fukumori F. 2014.Genetic and phenotypic characterisation of the heat shock response inPseudomonas putida.Microbiology Open
3(6):922–936DOI 10.1002/mbo3.217.
Kay E, Humair B, De´nervaud V, Riedel K, Spahr S, Eberl L, Valverde C, Haas D. 2006.Two GacA-dependent small RNAs modulate the quorum-sensing response inPseudomonas aeruginosa.Journal of Bacteriology188(16):6026–6033DOI 10.1128/JB.00409-06.
Kedzierska S, Matuszewska E. 2001.The effect of co-overproduction of DnaK/DnaJ/GrpE and ClpB proteins on the removal of heat-aggregated proteins fromEscherichia coliclpB mutant cells—new insight into the role of Hsp70 in a functional cooperation with Hsp100.FEMS Microbiology Letters204(2):355–360DOI 10.1016/S0378-1097(01)00427-X.
Keith LMW, Partridge JE, Bender CL. 1999.dnaKand the heat stress response ofPseudomonas syringaepv.glycinea.Molecular Plant-Microbe Interactions12(7):563–574
Kindrachuk KN, Ferna´ndez L, Bains M, Hancock REW. 2011.Involvement of an ATP-dependent protease, PA0779/AsrA, in inducing heat shock in response to tobramycin inPseudomonas aeruginosa.Antimicrobial Agents Chemotheraphy55(5):1874–1882DOI 10.1128/AAC.00935-10.
Klein HL, Kreuzer KN. 2002.Replication, recombination, and repair: going for the gold.
Molecular Cell9(3):471–480DOI 10.1016/S1097-2765(02)00493-8.
Kohler T, Curty LK, Barja F, van Delden C, Pechere JC. 2000.Swarming ofPseudomonas aeruginosais dependent on cell-to-cell signaling and requires flagella and pili.Journal of Bacteriology182(21):5990–5996DOI 10.1128/JB.182.21.5990-5996.2000.
Lau YY, Yin WF, Chan KG. 2014.Enterobacter asburiaestrain L1: complete genome and whole genome optical mapping analysis of a quorum sensing bacterium.Sensors14(8):13913–13924
DOI 10.3390/s140813913.
Livermore DM. 2002.Multiple mechanisms of antimicrobial resistance inPseudomonas aeruginosa: our worst nightmare?Clinical Infectious Diseases34(5):634–640
DOI 10.1086/338782.
Lo´pez-Garcı´a P, Forterre P. 2000.DNA topology and the thermal stress response, a tale from mesophiles and hyperthermophiles.BioEssays22(8):738–7461
DOI 10.1002/1521-1878(200008)22:8<738::AID-BIES7>3.0.CO;2-5.
Lyczak JB, Cannon CL, Pier GB. 2000.Establishment ofPseudomonas aeruginosainfection: lessons from a versatile opportunist.Microbes and Infection2(9):1051–1060
DOI 10.1016/S1286-4579(00)01259-4.
MacLean RC, Buckling A. 2009.The distribution of fitness effects of beneficial mutations in
Pseudomonas aeruginosa.PLoS Genetics5(3):e1000406DOI 10.1371/journal.pgen.1000406.
Matthijs S, Coorevits A, Gebrekidan TT, Tricot C, Wauven CV, Pirnay JP, De Vos P, Cornelis P. 2013.Evaluation of oprI and oprL genes as molecular markers for the genusPseudomonasand their use in studying the biodiversity of a small Belgian River.Research in Microbiology
164(3):254–261DOI 10.1016/j.resmic.2012.12.001.
Mogk A, Tomoyasu T, Goloubinoff P, Ru¨diger S, Ro¨der D, Langen H, Bukau B. 1999.
Identification of thermolabileEscherichia coliproteins: prevention and reversion of aggregation by DnaK and ClpB.EMBO Journal18(24):6934–6949DOI 10.1093/emboj/18.24.6934.
Motohashi K, Watanabe Y, Yohda M, Yoshida M. 1999.Heat-inactivated proteins are rescued by the DnaK.J-GrpE set and ClpB chaperones.Proceedings of the National Academy of Sciences of the United States of America96(13):7184–7189DOI 10.1073/pnas.96.13.7184.
Pessi G, Williams F, Hindle Z, Heurlier K, Holden MTG, Ca´mara M, Haas D, Williams P. 2001.
The global posttranscriptional regulator RsmA modulates production of virulence determinants andN-acylhomoserine lactones inPseudomonas aeruginosa.Journal of Bacteriology183(22):6676–6683DOI 10.1128/JB.183.22.6676-6683.2001.
Priya K, Yin WF, Chan KG. 2013.Anti-quorum sensing activity of the traditional Chinese herb,
Phyllanthus amarus.Sensors13(11):14558–14569DOI 10.3390/s131114558.
Rocchetta HL, Burrows LL, Lam JS. 1999.Genetics of O-antigen biosynthesis inPseudomonas aeruginosa.Microbiology and Molecular Biology Reviews63(3):523–553.
Sauer K, Cullen MC, Rickard AH, Zeef LAH, Davies DG, Gilbert P. 2004.Characterization of nutrient-induced dispersion inPseudomonas aeruginosaPAO1 biofilm.Journal of Bacteriology
186(21):7312–7326DOI 10.1128/JB.186.21.7312-7326.2004.
Savli H, Karadenizli A, Kolayli F, Gundes S, Ozbek U, Vahaboglu H. 2003.Expression stability of six housekeeping genes: a proposal for resistance gene quantification studies ofPseudomonas aeruginosaby real-time quantitative RT-PCR.Journal of Medical Microbiology52(5):403–408
Schirmer EC, Glover JR, Singer MA, Lindquist S. 1996.HSP100/Clp proteins: a common mechanism explains diverse functions.Trends in Biochemical Sciences21(8):289–296
DOI 10.1016/S0968-0004(96)10038-4.
Schurr MJ, Yu H, Boucher JC, Hibler NS, Deretic V. 1995.Multiple promoters and induction by heat shock of the gene encoding the alternative sigma factor AlgU (sigma E) which controls mucoidy in cystic fibrosis isolates ofPseudomonas aeruginosa.Journal of Bacteriology
177(19):5670–5679.
Schuster M, Lostroh CP, Ogi T, Greenberg EP. 2003.Identification, timing, and signal specificity ofPseudomonas aeruginosaquorum-controlled genes: a transcriptome analysis.Journal of Bacteriology185(7):2066–2079DOI 10.1128/JB.185.7.2066-2079.2003.
Sorger-Domenigg T, Sonnleitner E, Kaberdin VR, Bla¨si U. 2007.Distinct and overlapping binding sites ofPseudomonas aeruginosaHfq and RsmA proteins on the non-coding RNA RsmY.Biochemical and Biophysical Research Communications352(3):769–773
DOI 10.1016/j.bbrc.2006.11.084.
Straus D, Walter A, Gross CA. 1990.DnaK, DnaJ, and GrpE heat shock proteins negatively regulate heat shock gene expression by controlling the synthesis and stability ofs32.Genes and
Development4(12a):2202–2209DOI 10.1101/gad.4.12a.2202.
Sriramulu DD. 2009.Small heat shock proteins produced byPseudomonas aeruginosaclonal variants isolated from diverse niches.Proteomics Insight2:39–47.
Tan JY, Yin WF, Chan KG. 2014.Gene clusters ofHafnia alveistrain FB1 important in survival and pathogenesis: a draft genome perspective.Gut Pathogens6(1):29DOI 10.1186/1757-4749-6-29.
Tan LY, Yin WF, Chan KG. 2013.Piper nigrum,Piper betleandGnetum gnemon-natural food sources with anti-quorum sensing properties.Sensors13(3):3975–3985
DOI 10.3390/s130303975.
Timmermans J, Van Melderen L. 2010.Post-transcriptional global regulation by CsrA in bacteria.
Cell and Molecular Life Sciences67(17):2897–2908DOI 10.1007/s00018-010-0381-z.
Trapnell C, Roberts A, Goff L, Pertea G, Kim D, Kelley DR, Pimentel H, Salzberg SL, Rinn JL, Pachter L. 2012.Differential gene and transcript expression analysis of RNA-seq experiments with TopHat and Cufflinks.Nature Protocol7(3):562–578
DOI 10.1038/nprot.2012.016.
Trapnell C, Williams BA, Pertea G, Mortazavi A, Kwan G, Van Baren MJ, Salzberg SL, Wold BJ, Pachter L. 2010.Transcript assembly and quantification by RNA-Seq reveals unannotated transcripts and isoform switching during cell differentiation.Nature Biotechnology28(5):
511–515DOI 10.1038/nbt.1621.
Wang Z, Gerstein M, Snyder M. 2009.RNA-Seq: a revolutionary tool for transcriptomics.
Nature Reviews Genetics10(1):57–63DOI 10.1038/nrg2484.
Wang K, Spector A. 2000.Alpha-crystallin prevents irreversible protein denaturation and acts coorperatively with other heat-shock protein to renature the stabilized partially protein in an ATP-dependent manner.European Journal of Biochemistry267(15):4705–4712
DOI 10.1046/j.1432-1327.2000.01521.x.
Wenzel CQ, Daniels C, Keates RAB, Brewer D, Lam JS. 2005.Evidence that WbpD is an
N-acetyltransferase belonging to the hexapeptide acyltransferase superfamily and an important protein for O-antigen biosynthesis inPseudomonas aeruginosaPAO1.Molecular Microbiology
57(5):1288–1303DOI 10.1111/j.1365-2958.2004.04767.x.