www.humantechnology.jyu.fi Volume 9(2), December 2013, 132–156
REFLECTING ON THE PRET A RAPPORTER FRAMEWORK VIA
A FIELD STUDY OF ADOLESCENTS’ PERCEPTIONS OF
TECHNOLOGY AND EXERCISE
Abstract: PRET A Rapporter (PRETAR) was developed to explicitly structure user-centered evaluation studies to ensure all necessary elements are individually and independently considered. Its creators see its benefit as twofold: for study design and in retrospective evaluations. We evaluate PRETAR’s potential by applying it retrospectively to one of our eHealth field studies in which we investigated the design requirements for mobile technologies that would support and motivate adolescents to exercise opportunistically. We also use PRETAR to evaluate the key literature for this eHealth study. This shows that typically the research methodology is under-reported. Then we document the study in terms of its purpose, resources, ethical concerns, data collection and analysis techniques, and manner of reporting the study. Finally, our reflection on the use of PRETAR leads us to propose that four different modes of the framework should be applied during the course of a study, that is, when reviewing, planning, conducting, and discussing.
Keywords: PRET A Rapporter, reflection, field study, opportunistic exercise, adolescent participants, technology probe.
INTRODUCTION
In this paper, we reflect on the PRET A Rapporter (PRETAR) framework using one of our earlier eHealth studies. PRETAR was developed to explicitly structure user-centered evaluation studies to ensure that the necessary elements for such studies are individually and independently
© 2013 Helen M. Edwards, Sharon McDonald, Tingting Zhao, and Lynne Humphries, and the Agora Center, University of Jyväskylä
DOI: http://dx.doi.org/10.17011/ht/urn.201312042737 Helen M Edwards
Faculty of Applied Sciences University of Sunderland
UK
Sharon McDonald
Faculty of Applied Sciences University of Sunderland
UK
Tingting Zhao
Canonical Ltd. London, UK
Lynne Humphries
Faculty of Applied Sciences University of Sunderland
considered and presented in a logical manner (Blandford et al., 2008). However, our research of the literature to determine the value of the framework failed to reveal any studies other than those by Blandford and her colleagues (Blandford et al., 2008; Makri, Blandford, & Cox, 2011). Therefore, this paper is motivated by a desire to independently evaluate the usefulness of the PRETAR framework. The benefit of PRETAR is perceived by its authors to be twofold. First, studies can be designed using the framework. Second, PRETAR can be used retrospectively to provide clear reporting and evaluative reflection on studies undertaken, regardless of the initial design approach. In this paper, we have taken the latter (retrospective) approach with one of our earlier field studies.
We first present an overview of PRETAR and the eHealth study we used for the evaluation. Then we evaluate the eHealth studies drawn from our earlier study’s literature review, using the PRETAR structure, and follow up with our reflection on the retrospective use of PRETAR. This leads us to discuss and propose the ongoing use of four operational modes of the framework: those for reviewing, planning, conducting, and discussing the studies. We conclude with the main lessons learned about the value and use of PRETAR.
BACKGROUND: PRETAR AND EMPIRICAL STUDIES
The PRETAR Framework
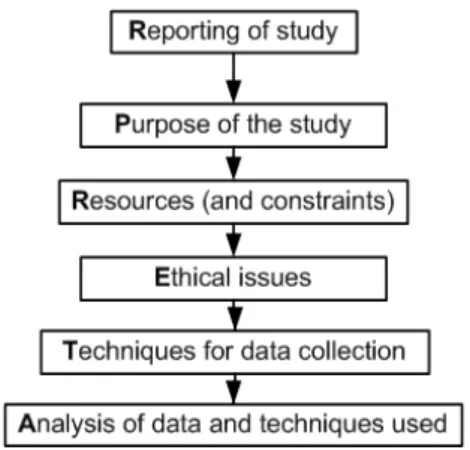
The PRETAR framework was designed as a result of Blandford and her research team attempting to use the DECIDE framework (currently explained in Rogers, Sharp, & Preece, 2011) for some evaluation studies. As a result, they identified limitations in its use, specifically within its structure and its breakdown of activities. Therefore, they devised a new framework with six independent stages:
Purpose of the study—the goals of the study or questions the study seeks/sought to answer;
Resources available for and constraints in conducting the study; Ethical issues raised by the study;
Techniques used to collect data;
Analysis of, and analysis techniques used on, the data; and
Reporting the findings—how the study is to be, or has been, reported.
In this paper, we have applied PRETAR retrospectively to our existing eHealth study (see Edwards, McDonald, & Zhao, 2011a). As part of this evaluation, we have also re-examined our paper’s literature review using the structure of the framework.
Field Studies of Technology and Physical Activity
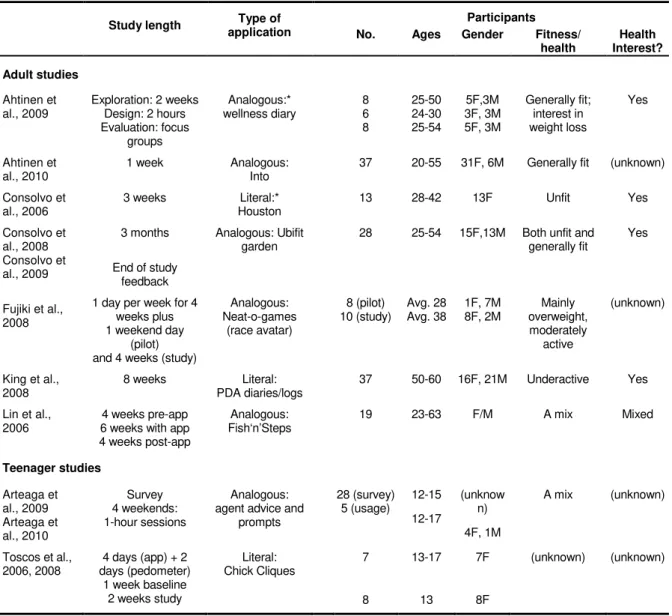
how such technologies have been used in the design and evaluation of persuasive applications for increasing daily activity levels in adults and children. To give context, Table 1 presents the main characteristics of the studies reviewed. (See Edwards et al., 2011a for the full literature review that underpinned this study.)
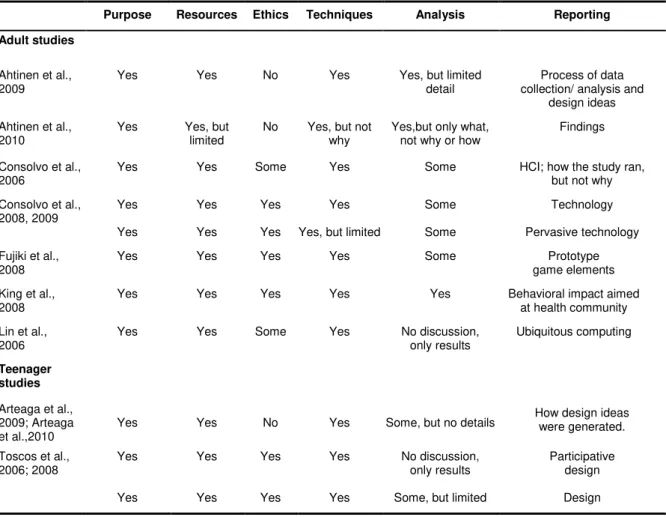
In our initial analysis, predating our empirical work, we found several papers tantalizing because they gave only limited detail. However, at that stage, we did not specifically consider what was included or missing by using an explicit framework such as PRETAR. This current analysis brings these methodological strengths and weaknesses to the fore. In Table 2, we identify the extent to which the content of the papers in our initial analysis maps onto thePRETAR components. We follow this with a more detailed discussion of the literature against each component.
Table 1. Characteristics of the Reviewed Studies.
Study length Type of application
Participants No. Ages Gender Fitness/
health Health Interest? Adult studies Ahtinen et al., 2009
Exploration: 2 weeks Design: 2 hours Evaluation: focus groups Analogous:* wellness diary 8 6 8 25-50 24-30 25-54 5F,3M 3F, 3M 5F, 3M Generally fit; interest in weight loss Yes Ahtinen et al., 2010
1 week Analogous: Into
37 20-55 31F, 6M Generally fit (unknown)
Consolvo et al., 2006
3 weeks Literal:* Houston
13 28-42 13F Unfit Yes
Consolvo et al., 2008 Consolvo et al., 2009
3 months
End of study feedback
Analogous: Ubifit garden
28 25-54 15F,13M Both unfit and generally fit
Yes
Fujiki et al., 2008
1 day per week for 4 weeks plus 1 weekend day
(pilot) and 4 weeks (study)
Analogous: Neat-o-games (race avatar) 8 (pilot) 10 (study) Avg. 28 Avg. 38 1F, 7M 8F, 2M Mainly overweight, moderately active (unknown)
King et al., 2008
8 weeks Literal: PDA diaries/logs
37 50-60 16F, 21M Underactive Yes
Lin et al., 2006
4 weeks pre-app 6 weeks with app 4 weeks post-app
Analogous: Fish‘n’Steps
19 23-63 F/M A mix Mixed
Teenager studies Arteaga et al., 2009 Arteaga et al., 2010 Survey 4 weekends: 1-hour sessions Analogous: agent advice and
prompts 28 (survey) 5 (usage) 12-15 12-17 (unknow n) 4F, 1M
A mix (unknown)
Toscos et al., 2006, 2008
4 days (app) + 2 days (pedometer)
1 week baseline 2 weeks study
Literal: Chick Cliques 7 8 13-17 13 7F 8F
(unknown) (unknown)
Table 2. Summary of the PRETAR Components Detected in the Reviewed Studies. Purpose Resources Ethics Techniques Analysis Reporting
Adult studies
Ahtinen et al., 2009
Yes Yes No Yes Yes, but limited detail
Process of data collection/ analysis and
design ideas Ahtinen et al.,
2010
Yes Yes, but limited
No Yes, but not why
Yes,but only what, not why or how
Findings
Consolvo et al., 2006
Yes Yes Some Yes Some HCI; how the study ran, but not why Consolvo et al.,
2008, 2009 Yes Yes Yes Yes Yes Yes Yes Yes, but limited
Some Some
Technology Pervasive technology Fujiki et al.,
2008
Yes Yes Yes Yes Some Prototype game elements King et al.,
2008
Yes Yes Yes Yes Yes Behavioral impact aimed at health community Lin et al.,
2006
Yes Yes Some Yes No discussion, only results
Ubiquitous computing
Teenager studies
Arteaga et al., 2009; Arteaga et al.,2010
Yes Yes No Yes Some, but no details How design ideas were generated.
Toscos et al., 2006; 2008 Yes Yes Yes Yes Yes Yes Yes Yes No discussion, only results
Some, but limited
Participative design
Design
Purpose
The underlying purpose of the studies reviewed was to increase physical activity by providing users with a means to both record their activity and obtain advice on behavioral change. The studies each addressed a subset of three specific purposes: identifying design requirements for such technologies, evaluating (existing or prototype) technologies for effectiveness, and understanding the impact of social interactions.
suggest activities that would fit the individual user’s personality and explicitly prompted adolescents to exercise at specific times.
Other studies focused on evaluating the effectiveness of technology. King et al. (2008) examined whether an existing technology (a personal digital assistant, PDA) would be more effective in increasing exercise levels than would paper-based diaries. Others evaluated their own prototypes. Consolvo et al. (2008) developed the UbiFit Garden application to evaluate whether an analogous representation of exercise (with only positive reinforcement) was an effective motivator. Lin, Mamykina, Lindtner, Delajoux, & Strub (2006) used the Fish‘n’Steps program to explore the motivational impact of analogous representations (with both positive and negative reinforcement). Fujiki et al. (2008) developed an application with an avatar competing in a virtual race against other players.
Woven throughout several studies was a specific focus on understanding the importance of social interaction. Consolvo et al. (2006) and Lin et al. (2006) evaluated the impact of social competition on a participant’s activities. Ahtinen et al. (2010) evaluated the social-sharing and playfulness aspects that had been designed into their Into application. Fujiki et al. (2008) provided avatar-race winners with rewards, thus building social competition and then evaluating the effects. The participants in the Toscos and colleagues’ (2006, 2008) studies harnessed social networking via text messaging as a motivator.
Resources and Constraints
The authors of these studies gave limited coverage to describing their resources and particularly to the constraints affecting the studies. Typically, resources were identified but not discussed. In all studies, profile information was provided for the participants, but the how and why they were recruited was not always provided. However, Ahtinen et al. (2009) provided some insight into their recruitment of Indian participants, choosing them from the higher economic classes so that they were more comparable with participants in studies conducted in the West. Similarly, Toscos et al. (2008) identified how the teenage participants were recruited through liaison with a school counselor. The types of technologies used were normally identified and, in some cases, explanations were given for their selection. The use of pedometers predominated and their limitations were commonly discussed. The projects’ timeframes, typically of short duration, were identified (see Table 1). Consolvo et al. (2008) explicitly discussed not only the length of the study, but also the season’s (winter) potential impact on the study.
Ethical Issues
2008) were most forthright about the ethical concerns in their two related studies. In both studies, ethics committee approval and parental consent were granted and reported. Moreover, Toscos et al. (2006) outlined discussions with pediatric dieticians and the resulting modification to the research design. Toscos et al. (2008) reported using the school counselor to recruit participants.
Techniques for Data Collection
Data collection techniques and technologies were identified in all the studies. However, in most cases, the authors revealed only a description of what was used and not why the approaches were chosen or, necessarily, how the instruments were developed and applied. All but Ahtinen et al. (2009) and Arteaga et al. (2009, 2010) used pedometers or accelerometers to capture participants’ physical activity; these data were supplemented by participants’ self-reported journal entries in the studies of Consolvo et al. (2006, 2008, 2009) and King et al. (2008). Ahtinen et al. (2009) also used journals, but did not capture physical activity data. Questionnaires were used by all but Ahtinen et al., (2009) and interviews except in the studies of King et al. (2008) and Arteaga et al. (2009, 2010). In several cases, data were audio or video recorded and transcribed for analysis.
Analysis of the Data
In most cases, little or no information was provided about how the different data sets were analyzed, and many papers simply reported results (e.g., Consolvo et al., 2009; Lin et al., 2006; Toscos et al., 2006), or gave a very brief and high-level mention of a technique with no detail about its application. For instance, Ahtinen et al. (2010) referred to qualitative thematic coding, and Ahtinen et al. (2009) noted affinity walls, focus groups, and analysis by a multicultural, multidisciplinary team (with decreasing levels of detail about these approaches). Toscos et al. (2008) mentioned reviewing text messages, but how this was done was left undefined, and use of statistical analysis is implicit. In contrast, Consolvo et al. (2006), Consolvo et al. (2008), and Fujiki et al. (2008) offered some discussion of statistical analysis, but did not mention of how the qualitative analysis was done. King et al. (2008) provided the most extensive discussion of data analysis using ANOVA and other statistical analysis of their study’s activities.
Reporting the Study
Clearly, each of the studies has been published as an article. However, what is of interest here for the PRETAR framework is a reflection on how their intended audience may have affected the manner in which the studies and their details were presented. All journals and conferences have space or time constraints that limit how much of any study can be publicized. Therefore, authors tailor their papers to the journal’s or conference’s intended audience. The audiences of these papers were from three fields: human–computer interaction (HCI), digital technology, and health.
The authors focusing on HCI conferences (Ahtinen et al., 2010; Arteaga et al., 2010; Consolvo et al., 2006; Toscos et al., 2006, 2008) consistently favored a user-centered design theme, although other issues also were present. In fact, all but Consolvo et al. (2006) adopted a user-centric participative design approach.
(2009), presenting at a multimedia conference, chose to focus extensively on the process of data collection/analysis and design ideas for well-being applications. Consolvo et al. (2009) reflected on the importance of goal-setting in a conference on persuasive technology.
Finally, King et al. (2008) presented their work, which focused on both technology and potential health benefits, in a preventative medicine journal. This choice of publications aligns with both their research community and the content of the paper.
Most of the reviewed papers are from conferences, which typically restrict paper length. Therefore, it is not surprising that, when analyzing conference papers by using the PRETAR framework, some components would be missing or underreported. However, such limitations can result in readers wondering about much of what was done in a study and why.
USING PRETAR TO REFLECT ON THE eHEALTH STUDY
In this section, we use PRETAR to reflect on our field study. This enables us to form a judgment on the extent to which the PRETAR framework is effective in presenting empirical studies.
Purpose of the Study
The purpose of our eHealth study was to examine the impact of providing exercise-focused digital technologies to adolescents. The goal was to develop an understanding of their reaction to the technologies and to gather design ideas for technologies that would appeal to teenagers, and thus motivate them to maintain an active lifestyle. The purpose of this study differed from those discussed as part of our literature review because we were not seeking to validate technologies that we had developed, nor were we trying to affect the daily activity undertaken by the participants. Rather we provided the technologies as stimulants to generate feedback from the participants on what did and did not appeal to them in order to elicit design features to consider in future technologies. From the detailed analysis of the literature, four key themes had emerged that we built into our study design, refining its purpose. These themes, discussed below, were the portability and accuracy of activity-monitoring devices, the role of social support, goal-setting capabilities, and incentives and rewards.
The findings of Consolvo et al. (2006), Consolvo et al. (2008), Fujiki et al. (2008), and Ahtinen et al. (2010) suggest that the portability and wearability of any activity-monitoring device would affect product use. Toscos et al. (2006) commented that teenage girls sought a stylish pedometer. In addition, two issues emerged from most studies: the accuracy of the data recorded by devices and the importance of users being able to correct the data (especially when the information was to be shared with others).
Goals need to challenge yet be attainable. Participants in Consolvo et al.’s (2009) study, whose baseline was already high, were given goals that they felt were unreasonable. Moreover, Lin et al. (2006) noted that a goal set too high will delay or deny the participants’ rewards. Consolvo et al. (2009) explored goal setting preferences and found the idea of self-set goals was popular, as were group-set goals and those set with the advice of a fitness expert. Further, in terms of time frames, weekly goals were popular but participants wished to declare their own week start and end dates and to retain the record of past achievements (a process that links to incentives).
In all studies, participants enjoyed receiving rewards and the opportunity to look back at these over time. However, Lin et al. (2006) reported that negative consequences seemed to demotivate, whilst other studies reported participants wanting positive reinforcement only.
Resources and Constraints
Participants
Exercise and health literature has indicated that the level of physical activity decreases from around 11 years of age (Hedley et al., 2004; Sallis & Owen, 1999; Troiano et al., 2008). Moreover, in early teenage years, many adolescents begin to assert their individuality and lay a foundation for attitudes and practices that often continue into later life. Therefore, we recruited adolescents from age 11 to mid-teens and assigned them to three participant groups, each using a specific set of technology probes (discussed in the Equipment subsection). Groups were independent of each other; therefore, each group needed sufficient members to provide a range of experiences, ideas, and interactions. This condition—balanced against the ability to manage and equip the groups, and, ultimately, analyze the varied data sets that would be generated—prompted us to establish groups of six.
We contacted more than 50 voluntary youth organizations in the city and provided information about the project (including an incentive for project completion worth US$160 per participant). We sought adolescents who were generally fit and healthy, and we wanted to establish gender-balanced groups. However, few girls volunteered, despite some of the youth groups contacted being girls-only. Recruitment began in June 2010; the target recruitment figure was reached in September 2010. The difficulty we experienced in recruiting sufficient volunteers to participate in what they saw as a long-term project is a challenge in many field studies. Researchers need robust recruitment and retention strategies. Our recruitment strategy resulted in access to specific youth workers who were trusted by the participants. The rapport we built with the youth workers and their liaison role with the adolescents was, we believe, key to keeping the participants involved and active throughout the study.
The characteristics of the groups are shown in Table 3. The 12 teenagers in Groups A and B were required to use a social networking Web site, while the six Group C participants operated as individuals. Because we were working with adolescents, we had to consider specific child-safety and ethical issues, discussed further in the Ethics section.
Equipment
Table 3. Profile of Participant Groups.
Group Age range Gender Existing Social-bonds
A 14 yrs 3F, 3M Yes (members of same youth group and school) B 5x13yrs, 1x15yrs 2F, 4M Yes (each knew at least one member of the group) C 5x11yrs, 1x13yrs 0F, 6M No (individually located)
Table 4. DataCapture Technologies Used by Participants.
Data Captured Device A B C
Steps The Walk with Me! activity meter
Omron Walking Style II pedometer
Other activities eHealth-elgg Web site
Paper-based log book
Barriers to exercise eHealth-elgg Web site
Paper-based log book
Note. Step data were collected using either the activity meter (Groups A and C) or pedometer (Group B). Participants were encouraged to record other activities and barriers to exercise via the eHealth-elgg Web site (Groups A and B) or in a paper-based log book (Group C). Walk with Me! is a registered trademark of Nintendo Co., Ltd.
Table 5. Technologies Providing Rewards and Activities Using Step Data.
Data usage Location A B C
Rewards eHealth-elgg Web site
Paper-based log book
Activities eHealth-elgg Web site facilities
Walk with Me! games using Nintendo DS Lite
Note. Participants gained rewards (stickers and stars) for reaching their step targets. These werevisible within the eHealth-elgg Web site for Groups A and B, while Group C member added these manually to their log books. A range of activities based on the steps data were available within both the eHealth-elgg Web site (for Groups A and B) and in the console game (for Groups A and C).
used. These technologies needed to match the initial design requirements identified from our literature review, and we added three criteria: each device must (a) be able to capture and log steps data and provide the user a means to view the data, (b) cost no more than the equivalent of US$160, and (c) be safe for the participants while eliminating the opportunity for misuse (an ethical issue). Given these constraints, we selected Nintendo DS Lite consoles with a commercial, age-appropriate exercise application that included its own activity meter.
our site to send daily and weekly rewards to those who achieved their targets, and announced their achievements in the public area. Other customizations enabled users to log their daily activity and keep each entry either private or public.
The Web site-only group (Group B) used Omron Walking Style II pedometers (with acceleration sensor technology). This technology had acceptable accuracy for this project: The accuracy was comparable to Nintendo’s Walk with Me! activity meters. Because both of these devices were used as technology probes to generate design ideas from the participants, some variability between the devices was acceptable.
Environment
We met with all participants three times during the study, at the start, midpoint, and end. This was in part to collect prestudy and poststudy attitudinal data. The midpoint was used to run innovation workshops with groups A and B. The three meetings were also used to keep in touch with the participants and keep them engaged in the study. We chose meeting locations that minimized the participants’ inconvenience. We met with Group A at their youth group venue, Group B at the local university (a central location for all), and Group C members individually at mutually agreed sites.
One environmental factor that we had not anticipated was a period of heavy snowfall. This impacted the participants’ typical daily physical activities. It also affected attendance at scheduled meetings and timely data collection.
Ethical Issues
We used a formal ethical framework to determine and document the different types of consent needed. Permission was granted by the university’s ethics committee, the participants’ parents or caregivers, and the teens themselves. In addition, the researchers applied for Enhanced Disclosure from the UK Home Office’s Criminal Record Bureau as part of the ethics committee application.
The need to safeguard children influenced a number of practical aspects of the project. These included the technology choices and the staging of meetings to include adults who were trusted by the adolescents.
We adopted Nintendo’s Walk with Me! game because it focuses primarily on exercise, rather than dieting or calorie-burning. Given our participants’ ages, we wanted to avoid any products that might reinforce the concept of an ideal body shape or size. The game was used by Groups A and C. We also reviewed the options for hosting the social eHealth Web site from an ethical perspective. Of utmost importance was that the platform should (a) be age appropriate, (b) have closed membership, (c) limit the opportunity to explore other Internet sites, and (d) be monitored to ensure individuals used the site appropriately. These constraints eliminated consideration of the popular social networking forums used by many of the participants and led to identifying the elgg platform.
Techniques for Data Collection
Numerous data sets were collected, encompassing contextual (attitudinal and factual) data, daily physical activity data, reflective data, and innovative ideas. The mix of qualitative and quantitative data was collected via questionnaires, interviews, focus groups, and digital technologies. In this section, we discuss the decision-making process that led to the choice of data collection techniques for the varied sets.
We collected contextual data to provide a baseline understanding of the participant’s lifestyle (physical activity) and support system (friends and family). This enabled the assessment of the change in activity levels and any motivational impact of the technologies over the duration of the study. We had limited direct access to the participants and their families; therefore, we decided that the best way to gather such information was by questionnaires. The adolescents completed a questionnaire at the first project meeting. To triangulate the self-reported data of the participants, a questionnaire about the family members’ and the participant’s attitudes toward exercise was completed by each parent/guardian. This family questionnaire was mailed to the home because we encountered difficulties in scheduling meetings with the parents/guardians (a deviation from the original plan).
We used previously validated questionnaires wherever possible to enhance the rigor of the study because, given the constraints of time and access, we did not have the opportunity to adopt the typical questionnaire design lifecycle steps of piloting and testing before usage (Oppenheim, 2000). These instruments collected information on the participants’ engagement and attitudes toward physical exercise (and the link to self-image), their technological experience, and their views about their current activity levels. For instance, to gather participants’ prestudy physical activity data, we adopted the Physical Activity Questionnaire for Older Children (PAQ-C; Knowles, Niven, Fawkner, & Henretty, 2009); to measure physical and global self-worth, we adopted the Physical Self-Perception Profile (PSPP), which has been validated across countries, gender, and age profiles (Welk & Eklund, 2005); and to access motivational attitude to change, we used the transtheoretical model (TTM; Sarkin, Johnson, Prochaska, & Prochaska, 2001; Spencer, Adams, Malone, Roy, & Yost, 2006). The questionnaires were reissued at the end of the study to detect changes in the participants’ self-perceptions.
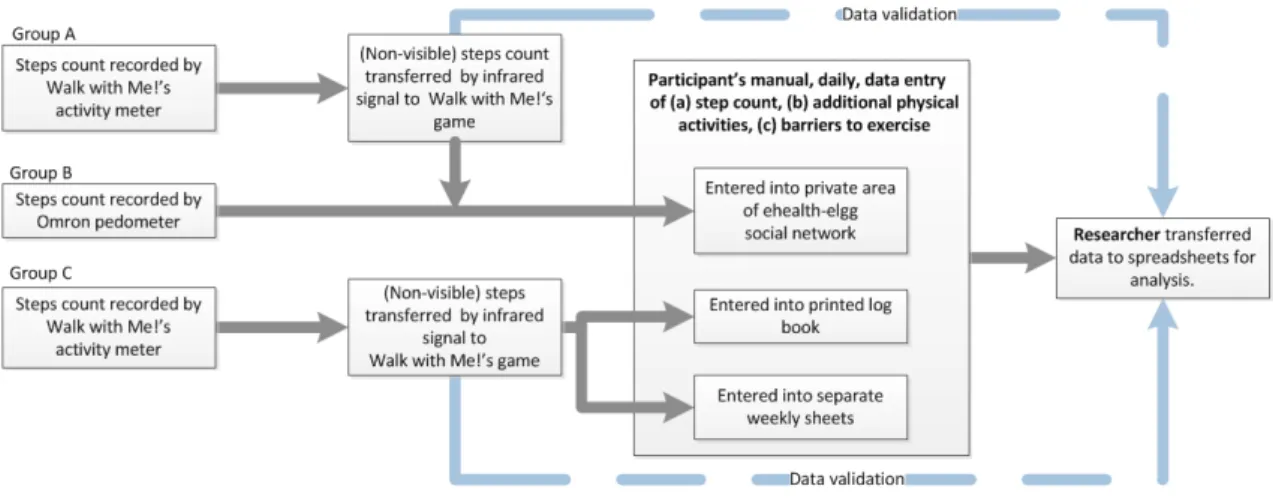
The study design required the participants to capture and record their daily physical activity. The data-capture devices logged their steps. However, several manual stages were needed to transfer these data to the spreadsheets used for analysis (as shown in Figure 1).
Figure 1. Stages of the data capture process.
Note. The recorded steps were manually entered by participants into either the eHealth-elgg Web site (Groups A and B) or the paper-based log book (Group C). A researcher validated the daily step count data for Groups A and C at the study’s mid- and end points. Limited validation was done for Group B because their pedometers retained only 7 days of data. Self-reported information about other physical activities and barriers to exercise could not be validated.
Finally, we sought out from the participants imaginative and innovative concepts for future technologies that would be both effective and motivating for the participants and their peers. Group C members, who operated as individuals throughout the study, were posed these questions during the final debriefing meeting (within the same discussion that drew out their reflections). However, we arranged specific workshop activities for members of Groups A and B, and also encouraged them to record subsequent ideas in their eHealth-elgg forum (which other group members and the research team could view). Two activities were employed in each workshop: brainstorming and the evaluation of visual artifacts. The benefit of providing visual stimulants is the rapid generation of ideas for debate, followed promptly by their acceptance or rejection; the disadvantage is that this can constrain participants into thinking about what has been presented and not what could be. To overcome these issues, we operated the workshops for Group A and Group B in different orders, as shown in Figure 2. In both workshops during the activities, the participants were encouraged to first capture their ideas pictorially or textually and then to engage in group discussions to explore ideas further. To ensure the ideas were captured, the participants were asked to write, draw, or doodle to record their concepts during the activities.
Figure 2. The two innovation workshop processes.
Note. In both workshops, the participants were encouraged to (a) capture their ideas pictorially or textually, and (b) discuss and explore ideas further. For Group A, visual artifacts were provided for evaluation followed by a brainstorming session. For Group B, the order was reversed.
Figure 3. Sample posters and probes used in innovation workshops as visual artifacts for evaluation.
Analysis of the Data
For the purposes of this paper, this section discusses the manner in which the data were analyzed and provides some examples of the outcomes. The detail of the results is documented in Edwards et al. (2011a).
Analysis of the Contextual Data
both as individuals and as a group. For instance, all participants reported having used computers for at least 5 years, and all but one used them at least several times per week. (The remaining participant had difficult home circumstances that reduced access to computers.) The main reported use was social (typically Internet browsing and game playing), with less usage for homework purposes. Of the participants, 16 said they also owned games consoles as well, but used these less frequently. Reported usage was split between individual and social play with family and friends. Action, sports, and music games were the most popular genres; strategy games were the least popular. All participants owned mobile phones, and four of Group B and two of Group C knew of mobile applications for tracking physical activity. In fact, two members of Group B had such apps on their phones.
To assess their attitude toward exercise, we analyzed both quantitative factual data and attitudinal data (using Likert-scale questions with varied directions of statements to avoid leading the participants in their responses). The attitudinal data focused on motivation to exercise, enjoyment of exercise, perception of sport, physical self-perception, and their exercise environment. Here we undertook statistical analysis using nonparametric statistical techniques (within SPSS); the results were not statistically significant. The data indicated that the participants had generally positive views on the importance of exercise for health and the impact on appearance (providing scores that indicated agreement or strong agreement), and all believed they needed to exercise. Three were neutral about whether there was a link to appearance and two were neutral to the idea of exercise being fun, but all other respondents reported agreement with the positive aspects of exercise. Confidence levels were high: 11 reported they did well at any new sport and assessed themselves as good at sports in general. However, only four expressed a preference for exercise over watching TV. This age group (11– 15) is often considered to be in a state of flux regarding their self-image; therefore, we explored their attitudes toward confidence and appearance. The results showed overall self-confidence and positive self-perceptions within the groups. With one participant not responding to all the questions, 10 claimed to be self-confident and five of the remaining seven were neutral; similarly nine were happy with the way they did things, and six of the remaining eight were neutral. The most negative perceptions were for the statements about appearance but, even with these, more than two-thirds of respondents were positive or neutral in their responses.
We explored the extent to which participants had the motivation and opportunity to maintaining a healthy level of exercise. Only four reported that they found it difficult to motivate themselves, and nine responded that they exercised only with friends. We found symmetry in the spread of answers regarding their commitment to making time to exercise (2:5:3:5:2; with one nonrespondent). The evidence here is not conclusive, but perhaps indicates that personal motivation and the use of exercise opportunities may be linked to attitudes and what happens within their friendship groups. This area warrants further investigation. The questionnaires were reissued at the end of the study. The data were compared, with no significant changes being identified.
opportunistically. Data were also captured about opportunities for exercise within the school day; the responses identified that short breaks were rarely used for exercise and that even the longer lunch break was, for most participants, a time of little physical activity. In their free time, they had more control over their activities: Their highest level of activity occurred immediately after school; Sunday appeared to be their “day of rest,” with the least strenuous activity undertaken.
These questionnaires were readministered at the end of the project to detect any changes in behavior. The data were analyzed for differences and visually inspected, but no consistent trends of changes were detected. To gain insight into the reasons behind the revealed changes would have required further interviews with individuals, for which, unfortunately, time was not allotted within the project parameters.
The parents/guardians’ questionnaire data (collected via direct mail) was used to triangulate the adolescents’ views of exercise and to identify the attitude within the home toward exercise. This was administered only at the start of the project and had a 100% return rate. Again, simple charting and tabulation was used to analyze the data. In general, the responses were in line with those of the participants. The parents/guardians also reported on the main barriers to exercise for the participants. Schoolwork as an hindrance to the amount of exercise their teen undertook was perceived by all parents of those in Group A to be either most likely or likely on the scale used, but was seen as less of an issue for Group B participants and less again for Group C participants. This issue of level of schoolwork seems to map onto the age (and stage of school life) of the groups: Those in Group A had all begun their studies for formal national qualifications (which typically begins at age 14 in the UK), whereas, in Group B, only one member was old enough to start those studies, whilst Group C comprised 11 and 13 year olds.
Analysis of the Daily Physical Activity Data
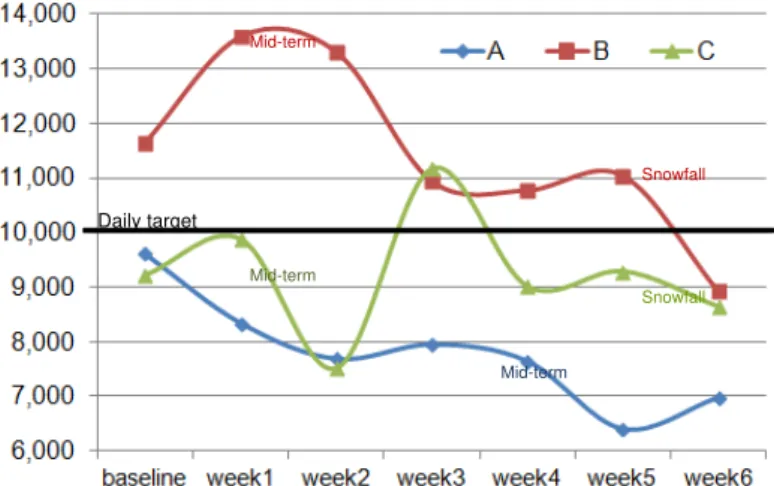
The main quantitative data were the daily step counts. These were supplemented by qualitative data identifying other physical activities and barriers to exercise. We were interested to see what happened with the qualitative information, but the main focus of the study was on the step counts. The data collected were transferred to spreadsheets, and charts and tables were created to determine any trends in the data. Figures 4 and 5 give examples of the analysis done. Our supposition was that we might see an increase in activity in the early phase of the study with a
Daily target
Mid-term
Mid-term
Snowfall
Snowfall
Mid-term
Figure 5. Individual step counts data for one Group A girl (the baseline week plus 6 weeks). The black line signifies the target of 10,000 daily steps.
settling down period (or trailing off) towards the end of the study as interest in the project declined. However, the data did not suggest any clear trend.
Our analysis of the data, even the step counts, had to be interpreted within the study context. For instance, a 1-week, midterm holiday occurred at different times for the three groups. Moreover, the study period for Groups B & C coincided with 2 weeks of heavy snowfall. We surmised that each of these events might have affected otherwise typical step counts. Therefore, the data in these time periods were comparatively analyzed against the other weeks for evidence of an impact. Analysis of the data across the participants revealed no consistent pattern of change in step rates (as shown in Figure 4).
We also examined the data to identify any variation in the extent to which participants achieved their daily targets. The data were divided into different time frames (e.g., baseline week– study period, weekdays–weekends) and compared them (see Table 6). The data showed that 12 participants achieved their targets more successfully during the baseline week than over the 6 weeks of the main study, suggesting perhaps a difficulty in maintaining motivation over multiple weeks. Fifteen participants achieved their targets more successfully over the weekdays rather than during the weekends. Perhaps their school life played a role in keeping them active, a rationale in line with the self-assessed activity levels revealed in the questionnaire responses.
Any results drawn from this quantitative analysis need to be tempered. The supplementary daily barriers comments supplied by the participants indicated that the data-capture devices were only partially effective, thus capturing only a portion of their exercise activity. For instance,
Table 6. Percentage of Time That Steps Targets Were Reached.
Participant Ag1 Ag2 Ag3 Ab1 Ab2 Ab3 Bg1 Bg2 Bb1 Bb2 Bb3 Bb4 Cb1 Cb2 Cb3 Cb4 Cb5 Cb6
Baseline 14 57 71 29 29 43 43 14 29 71 100 29 14 43 71 100 29 29 Main Study 14 52 50 17 10 5 21 17 33 88 90 40 21 29 81 57 14 19 Weekdays 20 60 63 17 13 7 13 13 33 93 100 50 20 33 87 77 17 20 Weekends 0 29 14 14 0 0 36 21 29 64 57 14 21 14 57 7 7 14
cycling, swimming and other activities were not recorded by the devices. As a result, exercise levels recorded by the equipment are likely to underreport activity.
Analysis of the Reflective Data
Thematic coding and affinity diagrams were used to analyze the reflective data. The data sets included “in the moment” comments from participants’ logs, (partially) transcribed audio recordings from group and individual meetings, and end-of-study questionnaire responses. One researcher transcribed the audio data, extracting comments that specifically reflected on the probes. A printout of the full data set, documented in a spreadsheet format, was cut into small pieces (one comment per piece) from which the research team collaboratively developed an affinity diagram (Beyer & Holtzblatt, 1999). We physically grouped elements that seemed to be related, discussed our groupings and subgrouping, and reflected on the emergent fit before finalizing the diagram, giving names to the themes, and, finally, captured the outcome in spreadsheet format. This generated a hierarchical understanding of the themes relevant to the participants. The use of affinity diagramming had not been explicitly defined in the project plan but emerged as a pragmatic approach to take (based on the authors’ experience in qualitative research).
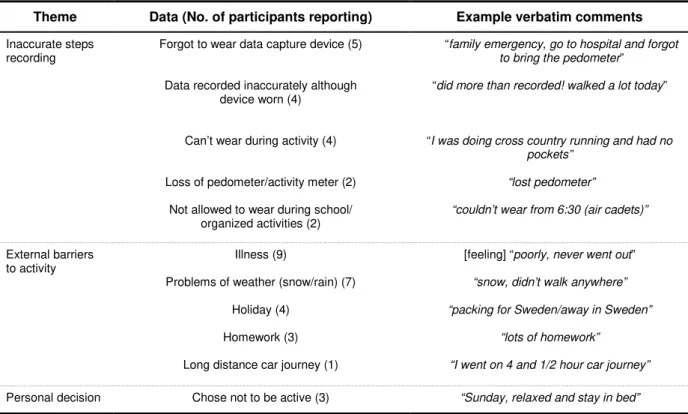
The data from the end-of-study questionnaires provided Likert-style responses about the specific technologies used and their motivational impact. The logs provided additional open commentary to the question of what would motivate over the long term. Therefore, a mix of descriptive statistics and thematic analysis were used here to learn from participants’ responses. As an example, Table 7 shows the barriers-to-exercise themes.
Table 7. Themes Emerging From Affinity Diagram Analysis of Barriers-to-Exercise Comments.
Theme Data (No. of participants reporting) Example verbatim comments
Inaccurate steps recording
Forgot to wear data capture device (5)
Data recorded inaccurately although device worn (4)
Can’t wear during activity (4)
Loss of pedometer/activity meter (2)
Not allowed to wear during school/ organized activities (2)
“family emergency, go to hospital and forgot to bring the pedometer”
“did more than recorded! walked a lot today”
“I was doing cross country running and had no pockets”
“lost pedometer”
“couldn’t wear from 6:30 (air cadets)”
External barriers to activity
Illness (9)
Problems of weather (snow/rain) (7)
Holiday (4) Homework (3)
Long distance car journey (1)
[feeling] “poorly, never went out”
“snow, didn’t walk anywhere”
“packing for Sweden/away in Sweden”
“lots of homework”
“I went on 4 and 1/2 hour car journey”
Personal decision Chose not to be active (3) “Sunday, relaxed and stay in bed”
Analysis of the Innovative Ideas
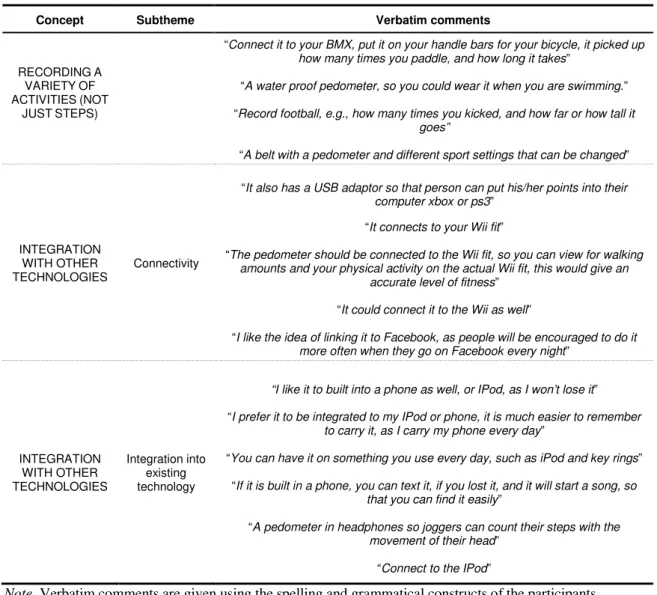
The process used for the reflective data was re-employed for the innovative ideas. The key differences encountered were the greater volume of data and the occasional need to interpret the intended meaning of the ideas expressed orally. In the latter case, the phrases used were considered against the researchers’ personal memories of the workshop sessions, and a consensus on meaning was reached by the researchers who attended (three researchers were present at Group A’s workshop, and two at Group B’s). As an example, Table 8 shows a part of the documented affinity diagram for a data-logging-device design.
Reporting the Findings
The report of the findings from the study took into consideration two primary target audiences: the project sponsor (for whom we created interim and end-of-project reports) and the research
Table 8. Extract of the Affinity Diagram for the Data-Logging-Device Design.
Concept Subtheme Verbatim comments
RECORDINGA VARIETYOF ACTIVITIES(NOT
JUSTSTEPS)
“Connect it to your BMX, put it on your handle bars for your bicycle, it picked up how many times you paddle, and how long it takes”
“A water proof pedometer, so you could wear it when you are swimming.” “Record football, e.g., how many times you kicked, and how far or how tall it
goes”
“A belt with a pedometer and different sport settings that can be changed”
INTEGRATION WITH OTHER TECHNOLOGIES
Connectivity
“It also has a USB adaptor so that person can put his/her points into their computer xbox or ps3”
“It connects to your Wii fit”
“The pedometer should be connected to the Wii fit, so you can view for walking amounts and your physical activity on the actual Wii fit, this would give an
accurate level of fitness”
“It could connect it to the Wii as well”
“I like the idea of linking it to Facebook, as people will be encouraged to do it more often when they go on Facebook every night”
INTEGRATION WITH OTHER TECHNOLOGIES
Integration into existing technology
“I like it to built into a phone as well, or IPod, as I won’t lose it” “I prefer it to be integrated to my IPod or phone, it is much easier to remember
to carry it, as I carry my phone every day”
“You can have it on something you use every day, such as iPod and key rings” “If it is built in a phone, you can text it, if you lost it, and it will start a song, so
that you can find it easily”
“A pedometer in headphones so joggers can count their steps with the movement of their head”
“Connect to the IPod”
community (particularly those in the HCI community who focus on field studies). The findings report to the sponsor (see Edwards et al., 2011a) provides a synthesis of the project’s findings with recommendations for how to use the findings, and the provision of extensive data sets in tabular and chart formats to allow readers to delve more deeply into the study’s findings to inform future initiatives. A subset of the study’s findings has been reported in a conference paper (see Edwards, McDonald, & Zhao, 2011b) to draw out the contrasts that emerged between the two groups (A and B) that had access to the eHealth-elgg forum. Edwards, McDonald, Zhao, and Humphries (2013) is a companion journal paper presenting the full study in a conventional form.
In this paper, the focus has been on evaluating the effectiveness of PRETAR as a mechanism to ensure that all elements of a field study are adequately reported. Our reflective use of PRETAR has highlighted that even where a study is planned in detail, some elements may be weak or become inappropriate as the context of the study emerges in practice. Any field study is likely to evolve as it progresses. Nevertheless, it is important to ensure that, changes in design at each stage are considered, designed, and recorded to provide a clear audit trail of the final methodology adopted.
DISCUSSION ON THE USE OF PRETAR
Blandford et al. (2008) suggested that PRETAR is an improvement over Rogers et al.’s (2011) DECIDE approach for structuring user-centered evaluative studies. Their criticism of DECIDE is that its steps are interdependent and can confuse, whereas, PRETAR’s are not. Yet both frameworks aim to reveal more about design/evaluation studies than do standard approaches. Furthermore, Blandford et al. (2008) commented that PRETAR can be used for planning, conducting, and discussing studies; in other words, for the full cycle of a field study. The PRETAR framework is presented as a sequential model, although comments in Blandford et al. (2008) acknowledge that ethical issues, for instance, can impinge on planning data collection and analysis, which implies that there is still some overlap. In Makri et al. (2011), they apply PRETAR retrospectively to discuss two of their previous studies, as well as show its use in planning and conducting new studies. However, we as readers of research see PRETAR’s particular benefit when used for discussing completed studies.
During our development of this paper (which also uses PRETAR in the discussing mode), we drew on our experience of undertaking qualitative field studies to reflect upon how PRETAR might be implemented for use in both planning and conducting studies. This led to the identification of a fourth mode, reviewing. For each of these modes, we propose implementation variants and discuss these variants in the following order: reviewing, planning, conducting, and discussing. For clarity in the following section, we distinguish between PRETAR’s two R components, using R1 to represent resources and R2 to represent reporting.
Reviewing Previous Studies Using PRETAR
by others). Such use of PRETAR could be particularly valuable in advance of planning. Moreover, the use of PRETAR for reviewing could also aid those engaged in systematic literature reviews of user-centered qualitative studies (Oates, 2011). For this paper, we applied the PRETAR framework retrospectively to those papers from the literature that we had analyzed in the early stages of our study. Our experience suggests that, in the reviewing mode, it is useful have a template for each paper under review, a template that first considers the reporting of study component (R2) and then the other components of the framework (P-R1-E-T-A), as shown in Figure 6.
Focusing on the reporting of study component at the outset helps to identify the intended audience of the work and brings to the fore how that knowledge may have impacted upon both what is reported and how. Once all papers have been analyzed, these can be used to create a synthesized, structured review.
Planning a Study Using PRETAR
A study’s purpose (P) needs to be clearly defined during planning and, therefore, should be considered first. Thereafter, the components R1-E-T-A need to be considered. These four components are not entirely independent of one another; a simple sequential approach to considering them could be inappropriate, as acknowledged by Blandford et al. (2008). Therefore, it is more realistic to assume that the elements may need to be (re)considered iteratively until an effective plan emerges, a plan that can then be recorded (R2) in the final component (see Figure 7).
Although we considered in our study the elements highlighted above, we did not do so using PRETAR. In retrospect, we can see that this structure would have systemized our planning activity. In particular, we needed to consider the use of resources (R1) and the ethical (E) dimensions together. For example, social (open) Web sites such as Facebook were available as project resources, but the ethical implications of working with adolescents and having a duty to care for them would have made such resources unacceptable. Thus, the ethical issue acted as a constraint upon the choice of resources. After determining the resources to use, we considered what data collection techniques (T) were appropriate and how the data was to be analyzed/transformed/ transcribed (A). Again, these two elements are intertwined. Clearly, we paid less attention to the
Figure 6. The reviewing mode of PRETAR.
Figure 7. The planning mode of PRETAR.
Note. In this mode, once researchers have defined the purpose (P) of their study, they iteratively consider the elements of the study until an effective plan emerges, a plan that can then be recorded in the final component (i.e., R2, reporting of study).
issue of data storage (which has ethical implications) than we would have had we used PRETAR in planning.
The reporting of study (R2) in this mode relates specifically to documenting how the study is to be conducted. This report is not only for the benefit of the research team, but also for the sponsors and other stakeholders.
Conducting a Study Using PRETAR
In the conducting mode, the purpose of a study (P) has already been clearly defined and only needs to be considered in terms of continued appropriateness. If any element is found inappropriate, the project would need to revert to the planning stage. The key components in this mode would be the data collection and analysis techniques (T & A), which would need to be continuously reviewed against the resources (and constraints) and ethical issues (R1 & E) to ensure they remain appropriate throughout the project, as shown in Figure 8.
Figure 8. The conducting mode of PRETAR.
The final component, reporting of study (R2), is likely to have at least two elements. The first would be detailed sets of documentation recording the execution of the project, the data acquired, and their analysis: These would be internal to the project. The second element would be (interim) reports and research papers emerging from the work, those aimed at an external audience.
Discussing a Study Using PRETAR
In the discussing mode, the PRETAR framework provides a structure within which to report the design, execution, and results of the study. Because this is entirely about documenting and discussing the study, the reporting of study component is an encircling concept within which the other components are clearly reported one element at a time, using a deceptively simple mechanism, as shown in Figure 9. This is the version of PRETAR that has been presented in Blandford et al. (2008), Makri et al. (2011), and in this paper.
Figure 9. The discussing mode of PRETAR.
Note. In this mode, the framework provides a structure for reporting the design, execution, and results of the study. Thus it serves as an encircling concept within which each of the other components is clearly presented, one element at a time.
CONCLUSIONS
been more appropriate in this case. Moreover, decisions made regarding resources were affected by ethical concerns (a matter for all field studies involving humans).
We found use of the review mode of PRETAR (as we reinterpreted it) useful in retrospectively analyzing the significant studies that we had identified in the literature. This was helpful in highlighting the strengths and weaknesses of the papers in terms of their reported research methodologies. This is a key consideration because, in many field studies, the value of the findings for a research community is based on the rigor and transparency with which a study has been conducted. We believe this is a beneficial approach in most research projects and intend to adopt it as a standard practice in our future research.
We did not use PRETAR to either plan or conduct our original study, but did implicitly consider all the components it contained. Perhaps this is common for experienced researchers and is to be expected. However, its explicit use in both planning and conducting modes would have served as a checklist to ensure that all required components of the study had been considered early and documented methodically. What did we miss in our original study? We did not explicitly identify the need for liaison roles or surplus physical resources. It turned out that both of these were available, but this was serendipitous. They could (should) have been factored in, had we rigorously considered the resources needed. Additionally, we did not consider explicitly the ethical issues of data storage/security and, although what we did was adequate, it is an area to treat formally for future projects. What did we do well? We dealt with the ethical issues related to the profile of the participants in our choices of technologies (e. g., closed-community social networking forums, appropriate console games). We effectively scoped the project and communicated the message about its focus to the participants.
Overall, the effort exerted in our project in the P-R1-E (planning) activities enabled us to see clearly what was and was not possible in the T-A-R2 (conducting) activities in terms of how and what data to collect and analyze, points crucial in fieldwork, where access to participants typically is limited. The explicit use of PRETAR would add an explicit level of refinement to such fieldwork studies, refinements that should enhance the rigor in both what is done and how it is reported.
ENDNOTE
1. More information on this service is available at www.elgg.org
REFERENCES
Ahtinen, A., Huuskonen, P., & Häkkilä, J. (2010). Let's all get up and walk to the North Pole: Design and
evaluation of a mobile wellness application. In Proceedings of the 6th Nordic Conference on Human–
Computer Interaction: Extending Boundaries (pp. 3–12). New York, NY, USA: ACM.
Ahtinen, A., Isomursu, M., Mukhtar, M., Mäntyjärvi, J., Häkkilä, J., & Blom, J. (2009). Designing social
features for mobile and ubiquitous wellness applications. In Proceedings of the 8th International
Conference on Mobile and Ubiquitous Multimedia (p. 12). New York, NY, USA: ACM.
Arteaga, S. M., Kudeki, M., Woodworth, A., & Kurniawan, S. (2010). Mobile system to motivate teenagers’ physical activity. In Proceedings of the 9th International Conference on Interaction Design and Children
(pp. 1–10). New York, NY, USA: ACM.
Beyer, H., & Holtzblatt, K. (1999). Contextual design. interactions, 6(1), 32–42. doi: 10.1145/291224.291229 Blandford, A., Adams, A., Attfield, S., Buchanan, G., Gow, J., Makri, S., Rimmer, J., & Warwick, C. (2008).
The PRET A Rapporter framework: Evaluating digital libraries from the perspective of information work. Information Processing & Management, 44(1), 4–21. doi: 10.1016/j.ipm.2007.01.021
Consolvo, S., Everitt, K., Smith, I., & Landay, J. A. (2006). Design requirements for technologies that
encourage physical activity. In Proceedings of the SIGCHI Conference on Human Factors in Computing
Systems (pp. 457–466). New York, NY, USA: ACM.
Consolvo, S., Klasnja, P., McDonald, D. W., & Landay, J. A. (2009). Goal-setting considerations for persuasive
technologies that encourage physical activity. In Proceedings of the 4th International Conference on
Persuasive Technology (p. 8). New York, NY, USA: ACM.
Consolvo, S., McDonald, D. W., Toscos, T., Chen, M. Y., Froehlich, J., Harrison, B., Klasnja, P., LaMarca, A., LeGrand, L., Libby, R., Smith, I., & Landay, J. A. (2008). Activity sensing in the wild: A field trial of
Ubifit Garden. In Proceedings of the SIGCHI Conference on Human Factors in Computing Systems (pp.
1797–1806). New York, NY, USA: ACM.
Edwards, H. M., McDonald, S., & Zhao, T. (2011a). Children’s health: Evaluating the impact of digital technology: Final report for Sunderland City Council. Sunderland, UK: University of Sunderland. Available at http://sure.sunderland.ac.uk/3939/1/Children's_Health_-_Evaluating_the_Impact_of_Digital_ Technology_-_Final_report_2011.pdf
Edwards, H. M., McDonald, S., & Zhao, T. (2011b). Exploring teenagers' motivation to exercise through
technology probes. In Proceedings of the 25th BCS Conference on Human–Computer Interaction (pp.
104–113). Swindon, UK: British Computer Society.
Edwards, H. M., McDonald, S., Zhao, T., & Humphries, L. (2013). Design requirements for persuasive
technologies to motivate physical activity in adolescents: A field study. Behaviour & Information
Technology, 1–19. doi: 10.1080/0144929x.2013.841755
Fujiki, Y., Kazakos, K., Puri, C., Buddharaju, P., Pavlidis, I., & Levine, J. (2008). NEAT-o-Games: Blending physical activity and fun in the daily routine. Computers in Entertainment, 6(2), Article 21.
Hedley, A. A., Ogden, C. L., Johnson, C. L., Carroll, M. D., Curtin, L. R., & Flegal, K. M. (2004). Prevalence of overweight and obesity among US children, adolescents, and adults, 1999–2002. JAMA: The Journal of the American Medical Association, 29, 2847–2850. doi: 10.1001/jama.291.23.2847
Hutchinson, H., Mackay, W., Westerlund, B., Bederson, B. B., Druin, A., Plaisant, C., Beaudouin-Lafon, M., Conversy, S., Evans, H., Hansen, H., Roussel, N., & Eiderbäck, B (2003). Technology probes: Inspiring design for and with families. In Proceedings of the SIGCHI Conference on Human factors in Computing Systems (pp. 17–24). New York, NY, USA: ACM.
King, A. C., Ahn, D. K., Oliveira, B. M., Atienza, A. A., Castro, C. M., & Gardner, C. D. (2008). Promoting physical activity through hand-held computer technology. American Journal of Preventive Medicine, 34, 138–142. Knowles, A.-M., Niven, A. G., Fawkner, S. G., & Henretty, J. M. (2009). A longitudinal examination of the
influence of maturation on physical self-perceptions and the relationship with physical activity in early adolescent girls. Journal of Adolescence, 32, 555–566.
Kowalski, K. C., Crocker, P. R., & Donen, R. M. (2004). The physical activity questionnaire for older children (PAQ-C) and adolescents (PAQ-A) manual. Saskatoon, Canada: College of Kinesiology, University of Saskatchewan.
Lin, J. J., Mamykina, L., Lindtner, S., Delajoux, G., & Strub, H. B. (2006). Fish’n’Steps: Encouraging physical
activity with an interactive computer game. In UbiComp 2006: Ubiquitous Computing (pp. 261–278).
Maitland, J., Chalmers, M., & Siek, K. A. (2009). Persuasion not required: Improving our understanding of the sociotechnical context of dietary behavioural change. In Proceedings of the 3rd International Conference on Pervasive Computing Technologies for Healthcare, 2009 (pp. 1–8). New York, NY, USA: IEEE. Makri, S., Blandford, A., & Cox, A. L. (2011). This is what I’m doing and why: Methodological reflections on a
naturalistic think-aloud study of interactive information behaviour. Information Processing & Management, 47, 336–348. doi: 10.1016/j.ipm.2010.08.001
Oates, B. (2011, June). Evidence-based information systems: A decade later. Paper presented at the 19th European Conference on Information Systems: ICT and Sustainable Service Development. Helsinki, Finland.
Oppenheim, A. N. (2000). Questionnaire design, interviewing and attitude measurement. London, UK: Continuum.
Rogers, Y., Sharp, H., & Preece, J. (2011). Interaction design: Beyond human–computer interaction (3rd ed.). Chichester, UK: Wiley.
Sallis, J. F., & Owen, N. (1999). Physical activity and behavioral medicine. Thousand Oaks, CA: SAGE Publications. Sarkin, J. A., Johnson, S. S., Prochaska, J. O., & Prochaska, J. M. (2001). Applying the transtheoretical model to
regular moderate exercise in an overweight population: Validation of a stages of change measure. Preventive Medicine, 33, 462–469.
Spencer, L., Adams, T. B., Malone, S., Roy, L., & Yost, E. (2006). Applying the transtheoretical model to exercise: A systematic and comprehensive review of the literature. Health Promotion Practice, 7, 428–443.
Toscos, T., Faber, A., An, S., & Gandhi, M. P. (2006). Chick Clique: Persuasive technology to motivate teenage girls to exercise. In CHI ’06 extended abstracts on human factors in computing systems (pp. 1873–1878). New York, NY, USA: ACM. doi: 10.1145/1125451.1125805
Toscos, T., Faber, A., Connelly, K., & Upoma, A. M. (2008). Encouraging physical activity in teens: Can technology help reduce barriers to physical activity in adolescent girls? In Proceedings of the 2nd International Conference on Pervasive Computing Technologies for Healthcare, 2008 (pp. 218–221). New York, NY, USA: IEEE. Troiano, R. P., Berrigan, D., Dodd, K. W., Mâsse, L. C., Tilert, T., & McDowell, M. (2008). Physical activity in
the United States measured by accelerometer. Medicine and Science in Sports and Exercise, 40, 181–188. Welk, G. J., & Eklund, B. (2005). Validation of the children and youth physical self perceptions profile for
young children. Psychology of Sport and Exercise, 6, 51–65. doi: 10.1016/j.psychsport.2003.10.006
Authors’ Note
We thank Sunderland City Council for funding this project, the participants in our study for their contribution, and, in particular, the youth leaders for their liaison role with the participants over the course of the study.
All correspondence should be addressed to Helen M. Edwards
Faculty of Applied Sciences University of Sunderland St Peter’s Campus, Sunderland, SR6 0DD, UK [email protected]
Human Technology: An Interdisciplinary Journal on Humans in ICT Environments ISSN 1795-6889