Croat. Chem. Acta88 (2) (2015) 179–188. http://dx.doi.org/10.5562/cca2600
Original Scientific Article
Organochlorine Pesticides and Polychlorinated Biphenyls in
Atmospheric Particles Collected in Zagreb, Croatia
Marija Dvoršćak, Ivan Bešlić, Sanja Fingler, Ranka Godec, Krešimir Šega, Želimira Vasilić, and Vlasta Drevenkar*
Institute for Medical Research and Occupational Health, Ksaverska c. 2, HR-10000 Zagreb, Croatia
RECEIVED FEBRUARY 5, 2015; REVISED APRIL 3, 2015; ACCEPTED MAY 4, 2015
Abstract. We studied the occurrence and levels of hexachlorobenzene, -, -, and -hexachlorocyclo-hexane, 4,4'-DDT, 4,4'-DDE, 4,4'-DDD, and 17 PCBs (six indicator and eleven other toxicologically sig-nificant congeners) in PM10 and/or PM2.5 particle fractions collected between 2000 and 2003 and in 2010 at a site in the northern residential part of Zagreb, Croatia. Twenty-four-hour particle samples were col-lected on glass or quartz microfibre filters from approximately 100 m3 of ambient air per filter. Filters with particles collected over seven consecutive days were combined for ultrasonic extraction with 1:1 acetone :n-hexane mixture followed by capillary gas chromatography with electron capture detection. In the monitored periods, the mass concentrations of organochlorine compounds in atmospheric particles were characteristic of global environmental pollution and showed a decreasing trend. Local input was ob-served only for -hexachlorocyclohexane. There were no pronounced seasonal variations in the mass frac-tion levels of any pesticide or PCB in airborne particles. A decreasing trend in the mass concentrafrac-tions of some compounds with higher air temperatures was mostly related to the lower particle concen-trations in warmer seasons and, consequently, to less particle-bound organochlorine compounds in the atmosphere.
Keywords: organochlorine pesticides, PM10, PM2.5, polychlorinated biphenyls
INTRODUCTION
Organochlorine (OC) pesticides and polychlorinated biphenyls (PCBs) are widespread semivolatile, lipo-philic, and highly persistent environmental pollutants with possible harmful effects on the ecosystem and human health. PCBs include 209 different congeners varying in position and number of chlorine atoms. Their commercial mixtures have been used worldwide since 1929 in many industrial and commercial applications. OC pesticides with hexachlorobenzene (HCB), -, -, and -hexachlorocyclohexane (-HCH, -HCH and -HCH), and 4,4'-DDT [1,1,1,-trichloro-2,2-di(4-chlo-rophenyl)ethane] as the most prominent representatives, have intensively been used in agriculture and public health since the Second World War. Reflecting concern regarding the harmful effects of increasing residues on the environment, the production and use of PCBs and OC pesticides ceased or were severely restricted in the late 1970s in many countries, including Croatia. Despite restrictions imposed several decades ago, PCBs and OC pesticides are still present in different environmental compartments of biota, air, water, soil, and land and
aquatic sediments. Due to their transport over long dis-tances from the primary contaminated areas by circula-tion of air masses and waters, these pollutants can be found even in regions where they have never been used,
e.g., in the Arctic1 and the Southern Ocean and
Antarc-tic Peninsula, the northernmost element of mainland Antarctica.2 Current environmental levels of PCBs and
OC pesticides are primarily the result of their use in the past, but emission sources into environment still exist.3–6
The distribution and fate of organochlorine mi-cropollutants in the biosphere depend on a compound’s physico-chemical properties as well as on the character-istics of the environment.7 As highly hydrophobic
com-pounds, OC pesticides and PCBs strongly bind to soil/sediment particles8 which become secondary
for highly chlorinated PCBs and 4,4'-DDT, whereas for lower chlorinated PCBs and -HCH, soil tends to be a source of pollution to air.
In the atmosphere, the greatest portion (> 90 %) of semivolatile OC pesticides and PCBs is in the gas phase.9–12 Their sorption to airborne particulate matter
depends on air temperature, compound vapour pressure and particle properties. The more lipophilic highly chlo-rinated PCBs and DDT-type compounds have a greater tendency to sorb on particles, while less chlorinated PCBs and, for example, HCB exist primarily in vapour phase.
Most studies on OC pesticides and PCBs in the ambient air provide data on their total atmospheric (va-pour plus particulate phase) mass concentrations.13–19
Literature data on atmospheric concentrations of OC pollutants adsorbed on the airborne particles are mostly related to the concentrations measured in total suspend-ed particulate matter.9–11,20–24 As a complex mixture of
organic and inorganic substances, airborne particulate matter (PM) is, however, a key indicator of air pollution brought into the air by a variety of natural and human activities.25 The size and composition of particles has
been directly linked to their potential for causing ad-verse human health effects. Of special concern are in-halable coarse particles with an equivalent aerodynamic diameter of < 10 m (PM10) and fine particles with an
equivalent aerodynamic diameter of < 2.5 m (PM2.5).
The studies of atmospheric particle-bound OC mi-cropollutants are therefore focused not only on their mass concentrations in the air but also on their particle size distribution.26–33
Non-volatile organochlorine compounds such as hepta- and octachlorinated dibenzo-p-dioxins and diben-zofurans were found to be more or less completely parti-cle-bound in the atmosphere and, on average, 92 % of these compounds were associated with particles with aerodynamic diameters smaller than 2.9 m.27 Particles of
that size also contained 60 to 95 % of particle-bound semivolatile less chlorinated congeners, for which signif-icant fractions were present in the gas phase. Concentra-tion levels of PCBs determined in the atmospheric fine particles PM2.5 in the urban environments of Chile were
even higher than gas-phase PCBs measured in the atmos-phere of other urban areas around the world.28 Particle
size distributions of total PCBs were found to be bimod-al26 with the highest peak in the particle size range
be-tween 5.6 and 10.0 m, and the second peak in the parti-cle size range between 0.31 and 0.52 m. A study of particle size distribution of organic compounds, including OC pesticides and indicator PCBs, in the urban atmos-phere indicated their predominant accumulation in the particle fraction < 0.9 m particularly in the cold season.29
Knowledge on the occurrence and concentrations of persistent OC pollutants in the air in Croatia is lim-ited. The first data were published for OC pesticides and
PCBs measured in air samples (vapour plus particulate phase) collected in the Zagreb area during 199718 and in
a follow-up study performed from 1999 to 2001.19
Poly-chlorinated dibenzo-p-dioxins and dibenzofurans were analysed in ambient air samples collected in Zagreb from 1997 to 2000.34 Within the frame of the
APOPSBAL project (“Assessment of the selected POPs in the atmosphere and water ecosystems from the waste generated by warfare in the area of former Yugosla-via”), seven PCB congeners, four HCH-isomers (, , , and ), HCB, and three DDT-type compounds were measured separately in gaseous and particulate ambient air samples collected in 2003 and 2004 in the city of Zadar and at a background site on Mt. Velebit (Zavižan).24,35
The aim of our study was to investigate for the first time temporal trends in the occurrence and mass concen-trations of particle-bound OC pesticides and PCBs in PM10 and PM2.5 atmospheric particles collected in the
northern residential part of the city of Zagreb. The parti-cle samples were collected between 2000 and 2003 and in 2010. The studied compounds were OC pesticides HCB, -, - and -HCH, 4,4'-DDT and its degradation products 4,4'-DDE [1,1-dichloro-2,2-di(4-chlorophenyl)-ethene] and 4,4'-DDD [1,1-dichloro-2,2-di(4-chlorophe-nyl)ethane], and 17 PCB congeners, including six indica-tor congeners (PCB-28, PCB-52, PCB-101, PCB-138, PCB-153, PCB-180) and eleven other toxicologically significant congeners (60, 74, 105, PCB-114, PCB-118, PCB-123, PCB-156, PCB-157, PCB-167, PCB-170, PCB-189). The abundance and concentrations of particle-bound OC compounds in air are compared and evaluated with respect to the variations in air tempera-tures during the sampling periods.
EXPERIMENTAL
Chemicals
Organochlorine pesticides were purchased as standards of Pestanal quality from Riedel-de Haën, Sigma-Aldrich Laborchemikalien GmbH, Seelze, Germany. The PCB congener standards were either the products of Riedel-de Haën of Oekanal quality or purchased from LGC Promochem (Wesel, Germany) or Ultra Scientific (North Kingstown, RI, USA) as standards of 97 % to 99.8 % purity. Acetone and n-hexane for gas chroma-tography, Suprasolv, and sulphuric acid, p.a., 95–97 %, were from Merck KGaA, Darmstadt, Germany.
Sampling of Airborne Particles
Samples of PM10 and/or PM2.5 fractions of atmospheric
part of the Zagreb city using sampling equipment de-signed and manufactured at the Institute for Medical Research and Occupational Health. The suitability of the self-constructed sampling equipment regarding the European Norm EN 12341:199836 was tested and
con-firmed in a previous study of PM10 and PM2.5 levels in
urban part of Zagreb by comparison with a reference low volume sampler manufactured by Ingenieurbüro Sven Leckel (Berlin, Germany).37
The sampler inlets were set at 1.5 m above the ground level at a distance of approximately 15 m away from a road busy with traffic. Twenty-four-hour sam-ples of particle fractions were collected on two glass fibre GF/A (2000 to 2003 period) or quartz microfibre (2010) filters (Whatman, UK), 90 mm in diameter, in parallel, from approximately 100 m3 of ambient air per
filter at the average air flow rate of 72 L min–1. The
coarse particles were removed by an inertial impactor. The samples were wrapped in aluminium foil and kept at –18 °C, until analysis.
Prior to use, the quartz filters were heated at 900 °C for 3 h. The glass and quartz filters were conditioned (prior and after the sampling) according to European standard sampling regulations EN 12341:199836 and EN
14907:200538 and then weighed. A microbalance Mettler
Toledo MX5 (Mettler Toledo, Columbus, OH, USA) was used for mass determination of PM10 and PM2.5.
Data on ambient air temperature and pressure dur-ing the sampldur-ing periods were obtained from Meteoro-logical and HydroMeteoro-logical Service of Croatia. The aver-age weekly air temperatures ranged from –7.6 to 25.8 °C (median 11.1 °C) in the period from October 2000 to December 2003, from –4.3 to 6.5 °C (median 0.8 °C) during 2010 winter months (January–March), and from 16.1 to 27.3 °C (median 22.8 °C) during 2010 spring/ summer months (June–July).
Sample Analysis
Fourteen filters with particle samples collected during seven consecutive days were extracted together for three consecutive times with 60 mL of 1:1 acetone:n-hexane mixture in an ultrasonic bath for 15 min and finally washed with an additional 10 mL of extracting solvent. The combined extracts were evaporated to dryness un-der a gentle stream of nitrogen. Immediately before gas chromatographic analysis, the dry residue was dissolved in 1.00 mL of n-hexane and washed with 1 mL of con-centrated sulphuric acid. The n-hexane layer was sepa-rated and analysed in parallel on two gas chromato-graphic columns of different polarity using a Varian 3380 and a Varian CP3800 gas chromatograph (Varian, Walnut Creek, CA, USA). Both chromatographs were equipped with a split/splitless injector and a 63Ni
elec-tron capture detector (ECD). The fused silica columns (60 m × 0.25 mm i.d., film thickness 0.25 m) used
were a Rtx-5MS column (Restek, Bellefonte, PA, USA) in the former chromatograph and a DB-17MS (J&W Scientific, Agilent Technologies, Folsom, CA, USA) column in the latter chromatograph. The temperature of both columns was programmed from 90 °C (with 1 min hold) up to 180 °C at 30 °C min–1 with a hold of 1 min,
from 180 °C to 240 °C at 2 °C min–1 with a hold of
20 min, and finally from 240 °C to 280 °C at 5 °C min–1
with a hold of 11 min. The injector temperature was 270 °C for sample analysis on Rtx-5MS column (split-less injection for 45 s) and 250 °C for sample analysis on DB-17MS column (splitless injection for 30 s). The sample volume injected was 2 L. The detector temper-ature was 350 °C. Nitrogen was used as the make-up gas at a flow rate of 30 mL min–1, and the carrier gas
was helium (99.9999 % pure) at a flow rate of 1.2 mL min–1 and 1.0 mL min–1 for analysis on the Rtx-5MS
and DB-17MS column, respectively.
Data Validation
Organochlorine compounds extracted from atmospheric particles were quantified using the multipoint calibra-tion curves obtained by analysis of standard solucalibra-tions prepared in n-hexane. Reagent blanks and blank sam-ples of pure glass or quartz microfiber filters were treat-ed and analystreat-ed in the same manner as the real samples. Organochlorine analytes or interfering impurities were not detected in any of the blank samples. The concentra-tions of compounds detected in the particle samples were calculated as the mean values of the results ob-tained on two different gas chromatographic columns. Only the peaks observed on both columns were evaluat-ed. The results were corrected for extraction recoveries and recalculated to normal conditions.
The ultrasonic extraction procedure was not uni-formly efficient but still satisfied for trace enrichment of different OC compounds from atmospheric particles. The recoveries were determined during each sampling period by analysis of filters with known mass of collect-ed particles spikcollect-ed with OC analytes at nanogram per milligram levels. At mass fractions of 0.05 to 1.05 ng mg–1, the recoveries of OC pesticides ranged from 36 %
for HCB to 87 % for 4,4'-DDD (RSD 7 to 32 %). The recoveries of PCB congeners, determined at single con-gener mass fractions ranging from 0.05 to 0.67 ng mg–1,
were 56 to 97 % (RSD 9 to 31 %). The lowest recovery was obtained for PCB-101 and the highest for PCB-114. Detection limits obtained by analysis of 1 mL extracts of particles collected from a total of about 1400 m3 of
air ranged from 0.02 pg m–3 for -HCH and PCB-180 to
0.2 pg m–3 for -HCH.
RESULTS AND DISCUSSION Optimization of Sampling Procedure
Due to the low levels of OC pesticides and PCBs in atmospheric particles, the sensitivity of their determina-tion greatly depends on the mass of particle samples. The mass of particles collected on a glass or quartz microfiber filter from 100 m3 of air during a period of
24 hours was too low for a reliable and sensitive analy-sis of particle-bound OC pesticides and PCB congeners. The collection of particles from larger air volumes, e.g.
from 700 m3 of air drawn through a filter during seven
consecutive days, failed due to the observed volatilisa-tion losses of all measured organochlorine pesticides as well as of some PCB congeners (PCB-28, PCB-52 and PCB-101) leading to an underestimation of particle-bound OC compounds. This finding is in accordance with literature data showing that high amounts of PCBs may volatilise from fine particles during aerosol sampling and that the volatilisation losses strongly depend on partial pressure of individual congeners and air temperature.28
To minimise volatilisation losses and achieve sufficiently high determination sensitivity of OC pollu-tants associated with PM10 and PM2.5 particle fractions,
the present study combined two sets of seven filters with one-day particle samples collected during a week for ultrasonic extraction. Thus, the weekly particle samples were collected from a total air volume of approximately 1400 m3.
Distribution of OC Pollutants in PM2.5 and PM10
Fractions
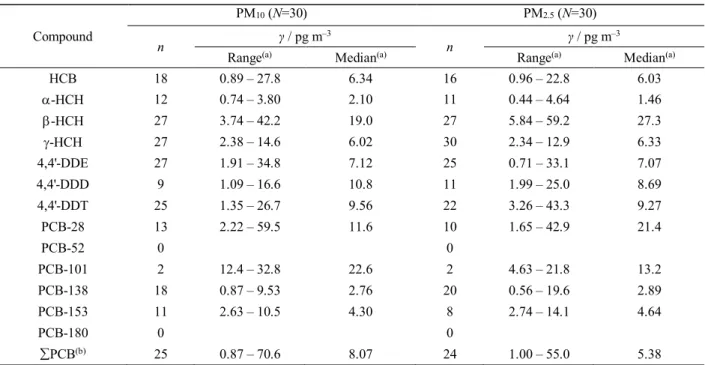
Possible differences in the distribution of OC pollutants in airborne particles of different size were tested by analysis of pesticides and six indicator PCBs in 30 sim-ultaneously collected weekly samples of PM2.5 and
PM10 in the period from October 2000 to May 2001
(Table 1). Air concentrations of compounds associated with two different particle fractions were statistically compared using the Wilcoxon matched pairs test. The concentrations were not significantly different (p> 0.05) indicating that the pollutants were mostly contained in the PM2.5 fraction. Since the results of PM2.5 and PM10
analysis were statistically comparable, the study was continued by sampling and analysis of only one particle fraction: PM10 in 2001 to 2003 and PM2.5 in 2010.
Temporal Trends in Concentration of OC Pesticides and PCBs in Particles in Air
The mass concentrations of particle-bound OC pesti-cides and PCB congeners in weekly samples of PM10
collected between 2000 and 2003 and in PM2.5 collected
in 2010 are summarised in Tables 2 and 3.
OC pesticides were analysed in a total of 183 weekly particle samples (Table 2). The most frequently detected pesticides were HCH isomers (-HCH in 96 %, -HCH in 83 %, and -HCH in 73 % of samples), fol-lowed by 4,4'-DDT and 4,4'-DDE determined in 82 %
Table 1. Mass concentrations of OC pesticides and six PCB indicator congeners in weekly samples of PM10 and PM2.5 particle
fraction collected from October 2000 to May 2001
Compound
PM10 (N=30) PM2.5 (N=30)
n γ / pg m–3 n γ / pg m–3
Range(a) Median(a) Range(a) Median(a)
HCB 18 0.89 – 27.8 6.34 16 0.96 – 22.8 6.03
-HCH 12 0.74 – 3.80 2.10 11 0.44 – 4.64 1.46
-HCH 27 3.74 – 42.2 19.0 27 5.84 – 59.2 27.3
-HCH 27 2.38 – 14.6 6.02 30 2.34 – 12.9 6.33
4,4'-DDE 27 1.91 – 34.8 7.12 25 0.71 – 33.1 7.07
4,4'-DDD 9 1.09 – 16.6 10.8 11 1.99 – 25.0 8.69
4,4'-DDT 25 1.35 – 26.7 9.56 22 3.26 – 43.3 9.27
PCB-28 13 2.22 – 59.5 11.6 10 1.65 – 42.9 21.4
PCB-52 0 0
PCB-101 2 12.4 – 32.8 22.6 2 4.63 – 21.8 13.2
PCB-138 18 0.87 – 9.53 2.76 20 0.56 – 19.6 2.89
PCB-153 11 2.63 – 10.5 4.30 8 2.74 – 14.1 4.64
PCB-180 0 0
PCB(b) 25 0.87 – 70.6 8.07 24 1.00 – 55.0 5.38
N – number of analysed samples, n – number of positive samples.
and 80 % of samples. HCB was detected in 56 % and 4,4’-DDD in 52 % of samples. HCB was also among the most frequently detected pesticides in 2002, with some of the highest concentrations and with a presence in more than 80 % of samples. In 2010, the mass concen-trations and abundance in air particles were for most pesticides considerably lower than in earlier years. It should be noted that in 40 % of the particle samples analysed between 2000 and 2010, -HCH was the dom-inant HCH isomer accounting for ≥ 50 % of the total HCH isomer mass concentrations. This might be a con-sequence of its much lower vapour pressure favouring sorption to airborne particles, and higher environmental persistence compared to other HCH isomers.
The significantly decreasing trend in the mass concentrations of the most frequently detected pesti-cides is illustrated in Figure 1, which compares the median values of the sum of three HCH isomer mass concentrations (ΣHCH) and DDT-type compounds (ΣDDX) measured in weekly samples of particle frac-tions collected in 2000/2001, 2002, 2003, and 2010. Since concentration data were missing for a number of
years within the investigated period, modelling was performed in order to get a better insight in concentra-tion decreasing process. Trend estimaconcentra-tion over the 2000 to 2010 period shows an exponential diminishing rate of 50 % every 17 and 20 months for ΣHCH and ΣDDX, respectively (r2 > 0.95). The slight increase of ΣHCH
and ΣDDX in 2003 as compared to 2002 is not signifi-cant and falls within measurement uncertainty. The comparison of OC pesticide concentrations in air sam-ples collected in Zagreb at the same location from June 1999 to February 200019 and from June 2007 to June
200839 also revealed a decreasing trend in
concentra-tions of HCH-isomers and DDT-type compounds. The ratio of -HCH/-HCH mass concentrations is an indicator of recent vs. old usage of HCH isomers and the distance from the input sources over which the HCH isomers may have been transported.6,22 Both
iso-mers were detected in 133 samples, only -HCH in 42 samples and only -HCH in only one sample out of 183 particle samples analysed in this paper. In most (80 %) of particle samples containing both isomers, the -HCH/-HCH ratio was lower than one (0.01 to 0.98, median 0.52) indicating a higher input of the -HCH into the atmosphere. A recent input of -HCH was also observed in air samples collected at the same sampling location from June 1999 to February 200019 and from
June 2007 to June 200839. -HCH and -HCH were
detected in all of the analysed samples and the median of their mass concentration ratio was 0.2 in the former and 0.14 in the latter period. This may partly be a con-sequence of the local preferable usage of a lindane for-mulation in the past (banned in Croatia in 2005) con-taining > 90 % of -HCH as the active ingredient, but also of the new inputs via atmospheric transport from remote areas. On the other hand, in 27 (20 %) particle samples containing both isomers, the -HCH/-HCH ratio was 1 (1.01 to 8.45, median 1.34). According to Dvorská et al.,6 classifying the values of the -HCH/
-HCH ratio into four groups may reveal more detailed
Table 2. Mass concentrations of OC pesticides measured in weekly samples of PM10 particle fraction collected in 2000/2001,
2002 and 2003 and PM2.5 fraction collected in 2010
Compound
Year 2000/2001, N = 57 Year 2002, N = 52 Year 2003, N = 52 Year 2010, N = 22
n γ / pg m–3 n γ / pg m–3 n γ / pg m–3 n γ / pg m–3
Range(a) Median(a) Range(a) Median(a) Range(a) Median(a) Range(a) Median(a) HCB 19 0.89 – 27.7 6.81 44 0.28 – 24.5 7.49 30 0.04 – 10.4 1.61 10 0.55 – 7.54 3.30 α-HCH 39 0.74 – 25.2 7.38 50 0.02 – 15.6 1.87 41 0.83 – 6.89 2.73 4 0.22 – 0.79 0.60 β-HCH 54 1.99 – 42.2 15.83 46 0.48 – 28.8 5.14 41 1.45 – 17.6 4.64 10 0.15 – 24.3 4.49 γ-HCH 54 1.60 – 23.9 9.03 52 0.31 – 19.0 3.22 50 0.10 – 15.1 4.83 19 0.04 – 2.71 0.62 4,4'-DDE 54 0.60 – 40.9 7.69 45 0.07 – 17.0 3.41 38 0.26 – 29.2 3.35 10 0.13 – 1.84 0.99 4,4'-DDD 34 0.74 – 27.0 10.65 21 1.18 – 20.7 8.81 39 0.27 – 14.3 4.99 1 2.60 2.60 4,4'-DDT 52 0.50 – 26.7 6.41 41 0.12 – 8.39 3.95 52 0.20 – 11.5 2.47 5 0.40 – 1.66 0.55 N – number of analysed samples, n – number of positive samples.
(a) ranges and median values apply to positive samples. Figure 1. Comparison of the median mass concentrations of the sum of HCH isomers (ΣHCH) and DDT-type compounds (ΣDDX) measured in weekly samples of PM10 particle fraction
in 2000/2001, 2002, and 2003 and samples of PM2.5 particle
fraction in 2010. Median values apply to all analysed samples (for number of analysed samples N see Table 2).
0 5 10 15 20 25 30
2000/2001 2002 2003 2010
γ
/ pg
m
-3 ΣHCH
information on recent and old usage of HCH isomers. A -HCH/-HCH ratio < 0.3 indicates emissions of non-degraded lindane, 0.3 < -HCH/-HCH < 3 of aged lindane, 3 < -HCH/-HCH < 8 of fresh technical HCH (containing predominantly -HCH) and -HCH/-HCH > 8 of aged technical HCH. As shown in Figure 2, -HCH/-HCH ratios classified according to this scheme for particle samples collected between 2000 and 2010 indicated the predominant emission of aged lin-dane in all four sampling periods. The frequency of particle samples classified in the four groups by the -HCH/-HCH ratio was calculated in relation to the number of samples containing both isomers: 39 samples in 2000/2001, 50 samples in 2002, 40 samples in 2003 and 4 samples in 2010. The emission of non-degraded lin-dane, although to a lesser extent than aged linlin-dane, was indicated by both -HCH/-HCH ratios lower than 0.3 and a number of samples containing only -isomer in all of the sampling periods. An occasional input of fresh HCH was indicated in three samples collected in 2003 and one sample collected in 2010. A -HCH/-HCH ratio higher than 8, indicating the input of aged tech-nical HCH, was detected only in one sample from 2001.
The ratio of 4,4'-DDE/4,4'-DDT mass concentra-tions is often used as an indicator of recent 4,4'-DDT input into the atmosphere. In the period from 2000 to 2010, both compounds were detected in 132 (72 %)
particle samples. The samples were characterised by a wide range of 4,4'-DDE/4,4'-DDT mass concentration ratios (0.04 to 19.3, median 0.97). In 61 samples, the ratio was higher than one (median 1.90) indicating an old input of 4,4'-DDT, which was largely converted to 4,4'-DDE. However, in 71 samples the ratio was lower than one (median 0.63) indicating that there had been a recent input of 4,4'-DDT into the atmosphere most like-ly as a consequence of the long-range transport from the tropics and other areas where it may still be in use as well as from remote point sources in areas contaminat-ed by accidental spills.3 4,4'-DDE/4,4'-DDT ratios in
the particle samples collected during the four sampling periods between 2000 and 2010 are compared in Fig-ure 2. The percentage of samples with a prevalence of 4,4'-DDT was significant in all periods and ranged from 43 % in 2000/2001 to 65 % in 2003. This finding was in good agreement with low 4,4'-DDE/4,4'-DDT ratios found in air samples collected at the same loca-tion in 1999 and 2000 (median value 0.8)19 and in pine
needle samples collected in Zagreb in 2006 (median value 0.55).40
Table 3 shows the mass concentrations of particle-bound PCB congeners measured in air in 2000/2001, 2002, 2003 and 2010. The number of samples analysed for six indicator PCBs was 183, while the other 11 congeners were analysed in a total of 153 samples. The most frequently detected PCBs were PCB-28 (68 % of samples), PCB-138 and PCB-153 (51 % of samples), PCB-52 (50 % of samples), PCB-60 and PCB-118 (48 % of samples), and PCB-101 (45 % of samples). PCB-74, PCB-157 and PCB-180 were present in about a third of samples and PCB-114 and PCB-170 in about a quar-ter samples. Detection frequency of other congeners ranged from 19 % for 156 to only 4 % for PCB-189. In the period from 2000 to 2003, the highest mass concentrations were determined for PCB-28 followed by 101. These two congeners together with PCB-52 largely contributed to the sum of six indicator con-geners detected in all air samples collected at the same location in 2000.41 Compared to the air samples, the
PCB levels in the airborne particle samples were con-siderably lower. The mass concentrations of PCBs in air, expressed as the sum of six PCB indicator conge-ners, ranged from 10.7 to 577.0 pg m–3 and in the
parti-cles in air from 0.12 pg m–3 to 111 pg m–3. Minimum,
maximum and median values of mass concentration sums of six indicator PCBs and of 17 PCBs measured in weekly samples of airborne particles during four sam-pling periods between 2000 and 2010 are compared in Figure 3. The presented results clearly indicate a signif-icant decrease in mass concentrations of all congeners between 2003 and 2010.
Figure 2. Ratios of α-HCH to γ-HCH (a) and 4,4’-DDE to 4,4’-DDT (b) mass concentrations measured in weekly sam-ples of PM10 particle fraction in 2000/2001, 2002, and 2003
and samples of PM2.5 particle fraction in 2010. 0
20 40 60 80 100
Fr
eque
nc
y
/ % α-HCH / γ-HCH < 0.3
0.3 < α-HCH / γ-HCH < 3 3 < α-HCH / γ-HCH < 8 α-HCH / γ-HCH > 8
0 10 20 30 40 50 60 70
Fr
eque
nc
y
/ % 4,4'-DDE / 4,4'-DDT > 1
4,4'-DDE / 4,4'-DDT < 1
(a)
Compared to urban areas in other countries, the mass concentrations of particle-bound indicator PCBs measured in Zagreb in 2010 were lower than those meas-ured in PM(>0.95–30) in Thessaloniki (northern Greece) in
the summer of 2008 (median mass concentrations from 0 pg m–3 for PCB-138 to 86.4 pg m–3 for PCB-180)29 and
similar to those measured in PM2.5 and PM10 in China’s
metropolis Taiyuan in December 2006 (maximum mass concentrations from 1.3 pg m–3 for PCB-118 to 2.4 pg m–3
for PCB-28 in PM2.5 and from 0.8 pg m–3 for PCB-180 to
10 pg m–3 for PCB-118 in PM10).31 In Taiyuan, a total of
144 particle-bound PCB congeners were identified and the total PCB mass concentrations ranged from 27 to 149 pg m–3 (median 46 pg m–3) in PM2.5, and from 16 to 190
pg m–3 (median 49 pg m–3) in PM10.31 Similar mass
con-centrations of particle-bound PCBs (sum of 37 congeners) ranging from 17 to 168.4 pg m–3 (median 79.7 pg m–3) in
PM2.5 and from 30.1 to 150.9 pg m–3 (median 78.3 pg m–3)
in PM10 were determined in Beijing (China) in
2002/2003.30 Mass concentrations of particle-bound
PCBs (144 congeners) measured in 2012 in Linfen and Datong, two other highly industrialized China’s metro-polises, were lower than those in Taiyuan and Beijing.33
The median concentrations in Linfen were 21.58 pg m–3
in PM2.5 and 11.9 pg m–3 in PM2.5–10, and in Datong 24.3
pg m–3 in PM2.5 and 17.4 in PM2.5–10. Figure 3. Comparison of mass concentration sums of six
PCB indicator congeners (a) and 17 PCB congeners meas-ured in weekly samples of PM10 particle fraction in
2000/2001, 2002, and 2003 and samples of PM2.5 particle
fraction in 2010 (b). For number of analysed (N) and posi-tive (n) samples see Table 3.
0 20 40 60 80 100 120
2000/2001 2002 2003 2010
γ
/ pg
m
-3
Minimum value in positive samples Maximum value in positive samples Median value (all samples)
0 20 40 60 80 100 120
2000/2001 2002 2003 2010
γ
/ pg
m
-3
Minimum value in positive samples Maximum value in positive samples Median value (all samples)
Table 3. Mass concentrations of PCB congeners measured in weekly samples of PM10 particle fraction collected in 2000/2001
(N = 57 for six indicator congeners, N=27 for the other 11 congeners), 2002 (N = 52) and 2003 (N = 52), and PM2.5 particle fraction
collected in 2010 (N = 22)
Compound
Year 2000/2001 Year 2002 Year 2003 Year 2010
n γ / pg m-3 n γ / pg m-3 n γ / pg m-3 n γ / pg m-3
Range(a) Median(a) Range(a) Median(a) Range(a) Median(a) Range(a) Median(a) PCB-28(b) 40 0.64 – 81.0 21.44 34 0.50 – 101 7.18 50 0.16 – 36.1 8.02 1 1.27
PCB-52(b) 26 0.66 – 5.32 2.21 23 0.06 – 5.65 1.29 37 0.09 – 14.7 0.97 5 0.30 – 0.86 0.75 PCB-60 12 0.53 – 1.52 1.04 33 0.08 – 14.4 5.25 26 0.06 – 18.0 7.87 2 0.92 – 1.17 1.05 PCB-74 6 0.18 – 16.2 3.88 18 0.39 – 35.8 1.75 14 0.88 – 8.13 1.88 9 0.15 – 2.13 0.70 PCB-101(b) 3 12.4 – 32.8 22.80 30 1.13 – 76.3 10.60 45 0.30 – 27.6 7.15 4 0.22 – 1.73 0.63
PCB-105 5 0.98 – 4.92 2.16 8 0.29 – 2.49 1.19 5 0.08 – 2.79 1.48 1 0.33
PCB-114 9 0.54 – 7.30 1.19 6 0.06 – 1.79 0.98 8 0.32 – 3.45 0.72 11 0.07 – 3.73 0.32 PCB-118 26 0.56 – 10.2 4.21 22 0.54 – 11.8 3.91 24 0.92 – 23.64 5.60 1 0.59
PCB-123 1 0.51 11 0.24 – 5.13 1.59 12 0.15 – 5.40 1.22 2 0.04 – 0.19 0.12
PCB-138(b) 25 0.87 – 9.53 2.58 24 0.15 – 5.76 2.29 35 0.08 – 10.8 1.04 10 0.31 – 1.98 0,78 PCB-153(b) 14 1.49 – 10.5 4.07 23 0.09 – 2.83 1.40 48 0.12 – 2.65 0.71 8 0.16 – 5.44 1.91 PCB-156 10 1.00 – 5.10 3.26 3 1.65 – 3.67 3.34 10 0.50 – 4.14 1.98 6 0.11 – 1.13 0,26 PCB-157 8 1.15 – 3.81 2.59 20 0.28 – 7.17 1.96 24 0.09 – 5.34 1.72 0
PCB-167 5 0.38 – 3.82 1.07 0 5 0.08 – 1.08 0.93 10 0.12 – 0.90 0.49
PCB-170 8 0.54 – 3.79 2.17 1 2.91 13 0.94 – 6.21 3.40 20 0.63 – 4.62 0.87
PCB-180(b) 7 0.45 – 2.06 0.73 29 0.04 – 3.07 0.43 17 0.02 – 3.55 0.53 6 0.09 – 0.73 0.15
PCB-189 4 0.81 – 2.11 1.30 0 0 2 0.13 – 0.32 0.22
N – number of analysed samples, n - number of positive samples.
(a) ranges and median values apply to positive samples. (b) PCB indicator congeners.
(a)
Seasonal Variations in Levels of Particle-bound OC Compounds
The measurements of OC pollutants in air samples col-lected in 1999/2000 and 2007/2008 at the same sam-pling location as in the present study, indicated an in-crease in the mass concentrations of OC pesticides and PCBs (sum of 20 congeners) with temperature.19,39 The
only exception was HCB with higher concentrations measured in winter.
Seasonal variations in concentrations of particle-bound OC compounds in air were tested by correlating OC pesticide and PCB congener mass concentrations and average air temperatures measured during the 161 sampling weeks from 2000 to 2003 and the 22 sampling weeks in 2010. In the period from 2000 to 2003, the average weekly temperatures ranged from –7.6 °C to 25.8 °C (median 11.1 °C) and in 2010 from –4.3 °C to 27.3 °C (median 11.3 °C). In contrast to previous find-ings in air (vapour plus particulate phase) samples,19,39 a
decreasing, but for most compounds statistically non-significant, trend of particle-bound pollutant concentra-tions with increasing temperatures was observed in both sampling periods. The Spearman’s rank correlation coefficients indicated a significant negative correlation of average weekly air temperatures and concentrations of particle-bound -HCH, 4,4'-DDE, 4,4'-DDT, PCB-74, PCB-105, PCB-114, PCB-138, PCB-156, PCB-170 and PCB-180 (rs from –0.194 to –0.389) in the period
between 2000 and 2003 and -HCH, 4,4'-DDE, PCB-74, PCB-101, PCB-153, PCB-156, PCB-180 and the sum of six indicator PCBs (rs from –0.428 to –0.913) in 2010.
However, the mass concentrations of PM10 and PM2.5
particle fractions were also significantly decreasing with increasing air temperatures (rs = –0.614 for 2000 to
2003, rs = –0.830 for 2010; p< 0.05). In weekly samples
collected from 2000 to 2003, the air mass concentra-tions of PM10 ranged from 3.83 to 98.41 g m–3 (median
28.88 µg m–3). The highest value was measured at –7.6 °C
and the lowest at 21.6 °C. Similarly, in 22 weekly PM2.5
samples collected in 2010, the particle mass concentra-tions were in the range of 8.73 to 72.00 g m–3 (median
20.70 g m–3). The highest and the lowest value of
PM2.5 concentration was measured at –4.3 °C and 20.1
°C, respectively.
The air mass concentrations of PM2.5
particle-bound -HCH and the sum of the six particle-bound indicator PCBs vs. average weekly air temperatures measured during the 2010 sampling period are shown as examples in Figure 4. The significant negative depend-ence of particle concentrations on air temperatures sug-gests that a decrease of OC compound concentrations was more related to the lower particle mass concen-trations in air during the warm period than to the sea-sonal variations in mass fraction levels of compounds associated with particles. This finding was additionally
supported by straight lines with slopes not significantly different than zero obtained by correlation of -HCH and Σ6PCB mass fractions in particles with air tempera-ture. Unlike these results, Xu et al.30 reported a negative
correlation between the log concentrations of several OC pesticides measured in PM2.5 collected in Beijing
(China) and reciprocal air temperatures, which indicated increasing OC pesticide concentrations in PM2.5
parti-cles with increasing temperature. However, the PM2.5
concentrations measured in Beijing from May 2002 to April 2003 (32.9 to 185.2 g m–3, median 88.2 μg m–3)
were considerably higher than concentrations measured in Zagreb and their seasonal variations were much less pronounced. Chrysikou and Samara29 observed a
signif-icant negative correlation with temperature only for the 0.95 to 1.5 m fraction of airborne particles collected in
Figure 4. Correlations of average weekly air temperatures and air mass concentrations of PM2.5 particle fraction (a),
particle-bound γ-HCH (b), and the sum of the six particle-particle-bound indi-cator PCBs (c) measured in 2010.
0 20 40 60 80
-5 5 15 25 35
γ
/ μ
g
m
-3
t/ °C
0 1 2 3
-5 5 15 25 35
γ
/ pg
m
-3
t/ °C
0 1 2 3 4 5 6
-5 5 15 25 35
γ
/ pg
m
-3
t/ °C
(a)
(b)
Thessaloniki (Greece), implying increased emission and/or formation rates for particles of this size range in the cold season. However, the concentrations of OC pesticides and indicator PCBs in the sum of five collected particle fractions (< 0.95, 0.95 to 1.5, 1.5 to 3.0, 3.0 to 7.5 and > 7.5 μm) were higher in summer than in winter. The highest proportions of target OC pollutants were found in both seasons on particles < 0.9 μm, but for some, increased proportions on the larger particle sizes were also observed in summer.
CONCLUSION
Mass concentrations of OC pesticides and PCBs in atmospheric PM10 and PM2.5 particle fractions collected
in Zagreb between 2000 and 2003 and in 2010 were characteristic of the global environmental pollution and showed a decreasing trend. Concentrations of all com-pounds were considerably lower in 2010 than in earlier years and, for most compounds, followed by a lower frequency of appearance.
A local input was indicated only for -HCH as a consequence of its local usage before it was banned for use in agriculture and forestry in 2005. In relation to the total number of analysed samples, the percent of particle samples in which 4,4'-DDE/4,4'-DDT mass concen-tration ratio was below 1, decreased from over 40 % in the period from 2000 to 2003 to below 10 % in 2010. However, these findings indicate a low but constant input of 4,4'-DDT in the atmosphere.
There were no pronounced seasonal variations in the mass fraction levels of any pesticide or PCB in air-borne particles. In addition to enhanced volatilisation to gaseous phase at higher ambient temperatures, the trend of pollutant mass concentrations decreasing as air tem-perature increases could account for the concurrent significant decrease in particle concentrations, and, consequently, for a decrease in particle-bound OC com-pounds in the atmosphere.
Acknowledgements. This work was supported by the Ministry of Science, Education and Sports of the Republic of Croatia through Projects No. 0022002, 0022003, 022-0222882-2271, and 022-0222882-2896.
REFERENCES
1. S. Ubl, M. Scheringer, A. Stohl, J.F. Burkhart, and K. Hungerbuhler, Atmos. Environ.62 (2012) 391–399.
2. C. Galbán-Malagón, A. Cabrerizo, G. Caballero, and J. Dachs,
Atmos. Environ.80 (2013) 41–49.
3. A. Di Guardo, S. Zaccara, B. Cerabolini, M. Acciarri, G. Terzaghi, and D. Calamari, Chemosphere 52 (2003) 789–797. 4. C. Poon, I. Gregory-Eaves, L. A. Connell, G. Guillore, P. M.
Mayer, J. Ridal, and J. M. Blais, Environ. Toxicol. Chem. 24 (2005) 3153–3158.
5. P. Růžičková, J. Klánová, P. Čupr, G. Lammel, and I. Holoubek,
Environ. Sci. Technol.42 (2008) 179–185.
6. A. Dvorská, G. Lammel, and I. Holoubek, Atmos. Environ.43 (2009) 1280–1287.
7. J. Paasivirta and S. I. Sinkonnen, J. Chem. Eng. Data54 (2009) 1189–1213.
8. W. A. Ockenden, K. Breivik, S. N. Meijer, E. Steinnes, A. J. Sweetman, and K. C. Jones, Environ. Pollut.121 (2003) 75–80. 9. P. Chakraborty, G. Zhang, S. Eckhardt, J. Li, K. Breivik, P. K. S.
Lam, S. Tanabe, and K. C. Jones, Environ. Pollut.182 (2013) 283–290.
10. J. He, R. Balasubramanian, S. Karthikeyan, and U. M. Joshi,
Chemosphere 75 (2009) 640–648.
11. M. Mandalakis, M. Tsapakis, A. Tsoga, and E. G. Stephanou,
Atmos. Environ.36 (2002) 4023–4035.
12. M. Mandalakis and E. G. Stephanou, Environ. Pollut. 147 (2007) 211–221.
13. B. Cetin, S. Yatkin, A. Bayram, and M. Odabasi, Chemosphere
69 (2007) 1267–1277.
14. C. Coscollà, P. Colin, A. Yahyaoui, O. Petrique, V. Yusà, A. Mellouki, and A. Pastor, Atmos. Environ.44 (2010) 3915–3925. 15. G. Lammel, Y-S. Ghim, A. Grados, H. Gao, H. Hühnerfuss, and
R. Lohmann, Atmos. Environ.41 (2007) 452–464.
16. G. Lammel, J. Klánova, Lj. Erić, P. Ilić, J. Kohoutek, and I. Kovačić, J. Environ. Monitor.13 (2011) 3358–3364.
17. A. Scheyer, S. Morville, P. Mirabel, and M. Millet, Atmos. Envi-ron.41 (2007) 3604–3618.
18. S. Herceg Romanić and B. Krauthacker, Bull. Environ. Contam.
Toxicol.64 (2000) 811–816.
19. S. Herceg Romanić and B. Krauthacker, Bull. Environ. Contam.
Toxicol. 71 (2003) 1034–1041.
20. A. Bozlaker, A. Muezzinoglu, and M. Odabasi, Chemosphere 77 (2009) 1168–1176.
21. S. Siddik Cindoruk, Chemosphere 82 (2011)78–87.
22. A. Scheyer, C. Graeff, S. Morville, P. Mirabel, and M. Millet,
Chemosphere58 (2005) 1517–1524.
23. M. Sadiki and L. Poissant, Atmos. Environ.42 (2008) 8288–8299. 24. J. Klánová, J. Kohoutek, R. Kostrhounová, and I. Holoubek,
Environ. Intern.33 (2007) 719–726.
25. K-H. Kim, E. Kabir, and S. Kabir, Environ. Intern. 74 (2015) 136-143.
26. W-J. Lee, C-C. Su, H-L. Sheu, Y-C. Fan, H-R. Chao, and G-C. Fang, J. Hazard. Mater. 49 (1996) 57–88.
27. H. Kaupp and M. S. McLachlan, Atmos. Environ. 34 (2000) 73–83.
28. M. Mandalakis and E. G. Stephanou, Environ. Toxicol. Chem.21 (2002) 2270–2275.
29. L.P. Chrysikou and C.A. Samara, Atmos. Environ. 43 (2009) 4557–4569.
30. D. Xu, M. Dan, Y. Song, Z. Chai, and G. Zhuang, Atmos. Environ.
39 (2005) 4119–4128.
31. S. Fu, H-X. Cheng, Y-H. Liu, Z-Z. Yang, and X-B. Xu,
Chemosphere 74 (2009) 1477–1484.
32. S. Fu, H-X. Cheng, Y-H. Liu, and X-B. Xu, Chemosphere 75 (2009) 588–594.
33. H. Nie, S. Fu, Y. Dong, and Z. Yang, Chemosphere114 (2014) 210–218.
34. B. Krauthacker, S. Herceg Romanić. M. Wilken, and Z. Milanović,
Chemosphere62 (2006) 1829–1837.
35. T. Bartoš, P. Čupr, J. Klánová, and I. Holoubek, Environ. Intern.
35 (2009) 1066–1071.
37. I. Bešlic, K. Šega, and Z. Bencetić Klaić, EURASAP Newsletter
53, (2004)
38. EN 14907:2005 - Ambient air quality - Standard gravimetric measurement method for the determination of the PM2.5 mass fraction of suspended particulate matter.
39. D. Klinčić, Air pollution and bioindicators of human and marine
organism exposure to persistent organochlorine compounds. Doctor-al Thesis, Faculty of Science, University of Zagreb, 2012, pp. 81–93. 40. D. Kožul and S. Herceg Romanić, Bull. Environ. Contam.
Toxicol.81 (2008) 339–342.