Article
0103 - 5053 $6.00+0.00
*e-mail: [email protected]
Determination of Polychlorinated Biphenyls in Brazilian Breast Milk Samples using
Solid-Phase Microextraction and Gas Chromatography-Electron Capture Detection
Cláudia H. Kowalski,*,a Josemar G. Costa,b Helena T. Godoya and Fabio Augustoc
aFaculdade de Engenharia de Alimentos, Universidade Estadual de Campinas, CP 6121,
13083-862 Campinas-SP, Brazil
bCentro de Biociências, Universidade Federal do Rio Grande do Norte, CP 1511,
59078-970 Natal-RN, Brazil
cInstituto de Química, Universidade Estadual de Campinas, CP 6154,
13084-971 Campinas-SP, Brazil
Um método para a determinação de bifenilas policloradas (PCB) no leite materno foi desenvolvido e aplicado para avaliar a contaminação de amostras procedentes de quatro cidades brasileiras. Os PCB foram extraídos através daMicroextração de Fase Sólida e analisados por Cromatograia Gasosa com Detector por Captura de Elétrons. As iguras de mérito estudadas foram linearidade (1 a 16 µg L-1, r > 0,9884), precisão (RSD < 12%, n = 5), recuperação (71 a 127%) e
limite de quantiicação (entre 0,45 e 2,42 µg L-1). A análise das vinte amostras revelou níveis de
PCB acima de 11,8 µg L-1 na região metropolitana de São Paulo, sendo o PCB 153 encontrado
em todas essas amostras. Em Vitória/ES e Florianópolis/SC foram encontrados PCB em 100 e 60% das amostras, respectivamente. Nenhuma contaminação foi detectada nas amostras do Rio Branco/Acre. Sendo assim, uma alta correlação entre a contaminação dessas amostras e o nível de industrialização da região foi encontrada.
A method for the determination of polychlorinated biphenyls (PCB) in breast milk was developed and applied to evaluate the contamination of samples that proceed from four Brazilian cities. PCB were extracted by Solid-Phase Microextraction and analyzed by Gas Chromatography with Electron Capture Detector. The igures of merit studied were linearity (to 16 µg L-1, r > 0.9884),
precision (RSD < 12%, n = 5), recovery (71 to 127%) and limit of quantiication (between 0.45 and 2.42 µg L-1). The analysis of the twenty samples revealed PCB levels above 11.8 µg L-1 in São Paulo
metropolitan area being the PCB 153 found in all these samples. In Vitória/ES and Florianopolis/ SC were found PCB in 100 and 60% of the samples, respectively. No contamination was detected in the samples from Rio Branco/AC. Thus, a high correlation between the contamination of these samples and the level of industrialization of the region was found.
Keywords: PCB, HS-SPME, validation, breast milk, contamination
Introduction
Polychlorinated biphenyls (PCB) have been used commercially since 1929 as dielectric and heat exchange fluids as well as in a variety of other applications. However, the distribution of PCB in the environment was not recognized until 1966, when Jensen identiied
PCB in human and wildlife samples.1 Owing to their
physicochemical properties, these compounds are extremely resistant to chemical and biological degradation
and are easily bioaccumulated through the trophic
pyramid,2,3 especially due to their lipophilic character
(which causes their accumulation on fat tissues).4,5
Therefore, the PCB contamination is a serious issue, and despite the fact that their production and use has been banned during the 1970’s and 1980’s, they are still detected
in the ecosystem.6-8 In Brazil, a law implemented in 1981
The primary immediate intake route of organochlorine pesticides and PCB congeners for the general population has been identiied as being food-related, mainly due to the consumption of contaminated dairy products,
meat and ish.9-12 It is now well known that PCB can be
transferred from mother to fetus through the placenta, as well as to newborn babies being fed with breast
milk.13 These infants will probably have higher risks to
develop immunosuppression, neuropathy, liver damage and cancer.14
Due to its high concentration levels usually found in breast milk, and since it is comparably easier to collect than other alternatives, breast milk has also been employed in
studies of human background exposure to PCB.15,16 The
most abundant PCB congeners found in breast milk are PCB 153, 180, 138, 170, 118, 101 and 187 (referred as
their IUPAC numbers).17-21 All these PCB, except PCB
118, are non-coplanar and ortho-substituted, and classiied
as non-dioxin-like species. The effects of non-dioxin-like PCB are related to multiple toxicity pathways, even though sometimes they have similar action to their dioxin-like
counterparts.22 Regulatory limits for PCB contamination in
foodstuff vary from 20 µg Kg-1 to 60 µg Kg-1,23 depending
on the country. As for the situation in Brazil, there is no speciic legislation regarding the maximum equivalent concentration levels of organochlorine compounds in breast
milk;24 besides, the degree and level of contamination are
not well known. One of the few studies was performed
by the National Agency for Sanitary Surveillance,25 and
showed that the levels of dioxin-like PCB (the most toxic) in breast milk collected in Brazil varied from 1.30 to
12.30 pg (PCB) g-1 of milk fat.
The conventional analytical procedures for the determination of PCB and similar species on complex matrices involve preliminary steps, such as their isolation by liquid-liquid extraction (LLE), combined with the clean-up and puriication of extracts to remove impurity
before the chromatographic separation.26 A relatively
large amount of sample is required and besides, it is necessary to use large amounts of toxic organic solvents.
In 1990, Arthur and Pawliszyn27 introduced the Solid Phase
Microextraction (SPME), a solvent-free sample preparation technique, to replace such conventional procedures, which
has been used extensively to a wide variety of samples,28
including the determination of PCB in some matrices.29,30
SPME is based on the sorption of analytes in samples or
on its headspace by a ilm of up to 100 µm of an extracting
phase (either pure liquid polymeric phases or porous solids dispersed in liquid polymers) over a silica iber. For liquid polymeric phases such as polydimethylsiloxane (PDMS), partition is the mechanism involved; for porous solid
coatings (Carboxen/PDMS), there is a mix of partition and adsorption, with large predominance of the latter. When the separation and detection of analytes are performed by Gas Chromatography (GC), after introduction of the iber directly inside the injection port of the chromatograph, the extracts can be thermally desorbed. Since the kinetics and thermodynamics of the extraction are governed by experimental conditions such as temperature, time, ionic strength of the sample, stirring rate, headspace volume and addition of co-solvents, the optimization of extraction parameters is fundamental. The optimization of SPME methods can be performed by using either classic unvaried approaches or, more conveniently, multivariate procedures
such as the factorial design.31 For the separation and
detection of PCB, the use of GC coupled with Electron
Capture Detection (ECD) is almost universal.32,33 Despite
its high sensibility for halogenated contaminants, ECD neither is speciic nor provides qualitative information, and the PCB identiication should be conirmed by retention
data combined to GC-MS.34,35
In a previous paper,31 a headspace SPME method
combined with GC-ECD to determine PCB in breast milk was optimized by using a chemometric multi-optimization procedure. For that, an experimental design arranged according to Doehlert matrixes was used to generate the necessary data. Artiicial neural networks were employed to ind a model that correlates the PCB peak areas with SPME operational parameters. Finally, genetic algorithm was applied to this model to ind the operational conditions that provides the maximized chromatographic responses for all evaluated analytes simultaneously. Therefore, in this study we present the validation of this method, which was also extended to GC-MS and inally applied to identify and quantify PCB in breast milk samples collected from different Brazilian regions.
Experimental
Reagents and materials
Standards of twelve PCB (IUPAC # 28, 52, 74, 101,
were it in an appropriate holder (Supelco). Septum-sealed 16 mL glasses were obtained from Pierce (Rockford, IL, USA). All glassware was silanized with a 10% solution of
chlorotrimethylsilane in toluene as described by Potter.36
For cleaning and decontamination of the glassware and the magnetic stir bars prior to use, they were washed with neutral detergent and deionized water and boiled with deionized water for 10 minutes in a microwave oven, followed by rinsing with deionized water and dried in
oven at 70 °C. During the extractions, the samples were
thermostated by using a heated circulating bath (Cole Parmer, USA).
Instrumentation
The GC-ECD system was an AutoSystemXL GC-ECD (Perkin-Elmer, Norwalk, CT) itted with a HP-1MS column
(30 m ×0.32 mm × 0.25 µm) and a 63Ni electron-capture
detector. The split-splitless injector was operated in the splitless mode and itted with a suitable liner for SPME.
The injector and detector temperatures were 280 °C and
320 °C, respectively. Helium was used as a carrier gas at a
low rate of 1.3 mL min-1 and nitrogen was the make-up gas.
Shimadzu 17A GC was the GC-MS system used to conirm the results, coupled with a Shimadzu QP-5000 quadrupole mass spectrometer (Shimadzu, Tokyo, Japan) operated by using full scan and selective ion monitoring mode (SIM). In this case, the separation was carried out by using a DB-5
(30 m × 0.25 mm × 0.25 µm) and both injector and interface
temperatures were 280 °C. Helium was used as a carrier
gas at a low rate of 1.3 mL min-1. Full-scan mass spectra
were obtained in the electron ionization mode (70 eV) in
the range from m/z 100 to 400 for analyte identiication.
On SIM runs, the target and secondary ions monitored for each PCB were (IUPAC congener number and fragment
m/z): PCB 28 (186, 256 and 258), PCB 52 and 74 (220
and 292), PCB 101 and 118 (254 and 326), PCB 153, 138,
128 and 156 (290 and 360) and PCB 187, 180 and 170
(324 and 394). In both chromatographic systems, the oven temperature was programmed as follows: 40 ºC (hold for
2 min), then 30 ºC min-1 to 190 ºC (hold for 5 min), then
5 ºC min-1 to 220 ºC (hold for 5 min) and 220 ºC min-1 up
to 300 ºC (hold for 1 min).
Sampling and storage
This study analyzed 20 breast milk samples collected between 2005 and 2006 from Human Milk Banks (ive samples per bank) associated to public health services in the metropolitan areas with diversiied proiles: São Paulo (capital of the state of São Paulo, population 10.9 million,
heavily industrialized and highly polluted), Vitória (capital of the state of Espírito Santo, pop. 0.31 million, export harbor), Florianopolis (capital of the state of Santa Catarina, pop. 0.4 million, mainly leisure and tourist activity) and Rio Branco (capital of the state of Acre, pop. 0.29 million, urban center surrounded by the Amazon rainforest). It should be noticed that sample donators are not necessarily residents in the collection area, since mothers from bordering regions not serviced by public health facilities usually need to travel to these larger centers for assistance. After collection, they were immediately frozen and stored at –20 ºC until the analysis. The procedure was previously examined and approved by the National Commission of Research Ethics (CONEP), as well as by the local Ethics Committees from the public health ofices involved.
SPME procedure
For all extractions, the samples were defrosted and 5.00 mL immediately transferred to 16 mL silanized glass vials. To increase the extracted masses, 1.8 g of NaCl and 210 µL of methanol were added in the media. These additions are well established in the SPME theory: the presence of electrolytes, such as NaCl in aqueous samples decreases the activity of the solvent and increases the activity of the analyte (specially for non-polar analytes); besides, the addition of small amounts of water-miscible organic solvents, such as methanol or acetonitrile, can improve the extraction eficiency of highly hydrophobic species (such as the PCB), due to the increase on the solubility of the analytes in the media. The samples were magnetically stirred at 1200 rpm for 10 min to permit
sample/headspace equilibration. A 100 µm PDMS SPME
iber was exposed to the sample headspace for 60 min of time. During sample/headspace equilibration and
extraction, the sample was thermostated at 95 °C. After
extraction the iber was withdrawn and extracted analytes were immediately desorbed directly in the GC-ECD or
GC-MS injection port at 280 °C for 5 min. To minimize
inter-extractions iber carryover, blank runs were performed between each extraction.
Validation and application to real samples
For all validation experiments, pooled blank breast milk was prepared from samples found to be non-contaminated in preliminary assays. The blank sample was spiked with
0.5 µg L-1 to 64 µg L-1 of each PCB evaluated. The spiked
samples were kept at 4 °C for 24 h to allow the equilibration between the PCB and the lipid fraction and other possible
was employed to determine the igures of merit of the HS-SPME-GC-ECD method. Linearity was evaluated through the calibration curve in eight different levels (0.5,
1, 2, 4, 8, 16, 32 and 64 µg L-1) and thus the linear range
was obtained. To calculate the LOD and LOQ of each compound, the standard deviation of the linear coeficient
(σ) divided by the slope or angular coeficient (S) obtained
from the calibration plot was considered. In both cases, the
result was multiplied by 3.3 and 10.0, respectively.38,39 The
precision was estimated through the repeatability obtained by ive successive extractions of samples spiked with
4 µg L-1 of each PCB being the result expressed as relative
standard deviation (% RSD). The accuracy was evaluated at the same ive levels on which the calibration curve was performed. Each point was subtracted, the equation was recalculated and the theoretical area was compared with the experimental area and reported as percent recovery. The selectivity of the method was assessed by inspecting GC-MS chromatograms for the test samples. Finally, the validated method was applied to the 20 breast milk samples.
Results and Discussion
Method evaluation
It is well known that SPME is an extraction technique affected by the matrix and this fact needs to be considered mainly in trace analysis. Therefore quantitative measurements in real samples normally require applying
the standard addition technique.40 So, to perform all the
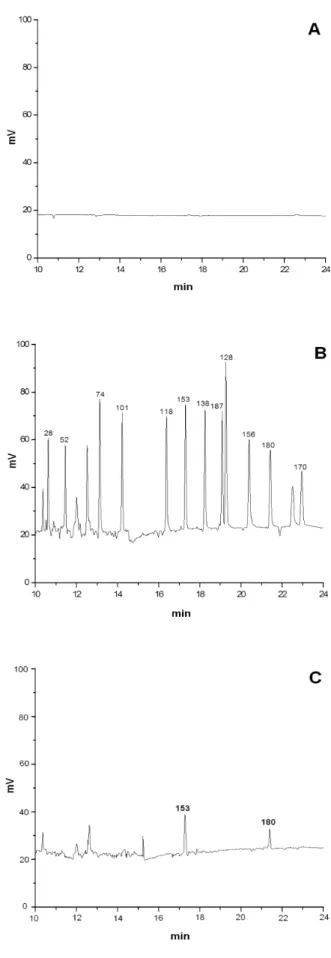
validation steps, a non contaminated pooled milk was spiked with the mixture of PCB congeners. The Figure 1A shows a blank milk sample chromatogram and the Figure 1B shows a chromatogram obtained by this blank milk spiked
with 9.25 µg L-1 of each PCB. Through Figure 1B, it was
observed that the peak resolution was adequate for the target analytes identiication and quantiication.
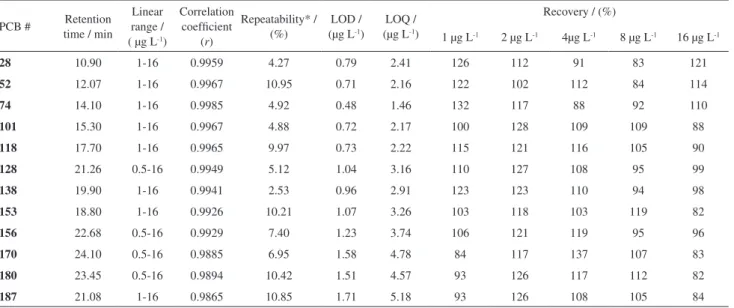
The igures of merit are shown in Table 1. The linearity
of the proposed method was evaluated from 0.5 to 64 µg L-1
of each compound however, a linear correlation between amount and concentration was found between 0.5 and
16 µg L-1 (PCB 128, 156, 170 and 180) and between 1 and
16 µg L-1 to the others. This range is in agreement with other
studies since the real concentration of these compounds in the majority of breast milk analyzed around the world is allocated within this range. Calibration curves (peak area
versus concentration) were obtained for the 12 PCB, being
all correlation coeficients (r) higher than 0.9884.
LOD values ranged from 0.45 µg L-1 (PCB 180)
to 2.42 µg L-1 (PCB 74) and LOQ values ranged from
1.37 µg L-1 to 7.34 µg L-1 to the same PCB (Table 1).
The precision, obtained by the RSD values, ranged
between 4.91 (PCB 52) and 11.76% (PCB 28). The
accuracy varied between 70.66 and 128.97% of recovery. In order to evaluate the selectivity available and to conirm the identity of the suspected PCB present in the breast milk samples, a validation was performed in a GC-MS instrument. The same SPME experimental conditions previously deined were used. Good results were obtained according to Table 2.
Real samples analysis
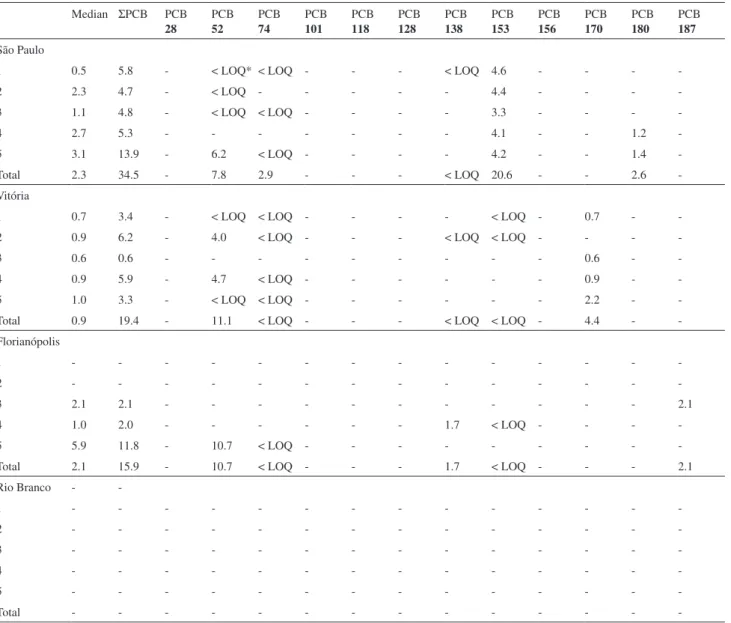
Once the analytical methodology was validated, it was applied to 20 breast milk samples. In Table 3 the results
obtained by HS-SPME-GC-ECD and conirmed by MS are given.
It was observed that 65% of the analyzed samples had PCB levels above LOQ. The most abundant PCB congeners
found in these samples were PCB 52 (45%), PCB 74 and
PCB 153 (40%), PCB 170 (20%), PCB 138 (15%), PCB
180 (10%) and 187 (5%). Considering the quantiied results
(> LOQ) the contamination distribution was: PCB 153
(25%), PCB 170 (20%), PCB 52 (15%), PCB 180 (10%),
PCB 138 and 187 (5%). All these PCB in association
with PCB 101, PCB 118 and PCB 156 were abundantly
commercialized and distributed around the world in a mixture called Aroclor® (Monsanto, USA), being the most
Table 1. Performance of the HS-SPME-GD-ECD method for PCB analysis
PCB # Retention time / min
Linear range / (µg L-1)
Correlation coeficient
(r)
Repeatability* / (%)
LOD / (µg L-1)
LOQ / (µg L-1)
Recovery / (%)
1 µg L-1 2 µg L-1 4µg L-1 8 µg L-1 16 µg L-1
28 10.59 1-16 0.9945 11.8 0.54 1.65 71 97 82 118 86
52 11.43 1-16 0.9900 5.0 0.74 2.24 71 81 99 125 79
74 13.10 1-16 0.9884 10.3 0.80 2.42 76 97 111 126 78
101 14.19 1-16 0.9933 11.3 0.61 1.84 82 109 103 129 83
118 16.34 1-16 0.9959 5.9 0.47 1.43 89 116 101 113 87
128 19.23 0.5-16 0.9989 6.4 0.24 0.73 88 127 98 103 97
138 18.21 1-16 0.9974 6.5 0.38 1.14 96 126 101 108 91
153 17.26 1-16 0.9970 4.9 0.41 1.23 92 127 102 108 93
156 20.35 0.5-16 0.9997 8.5 0.16 0.50 92 122 96 100 100
170 22.91 0.5-16 0.9995 8.5 0.17 0.51 90 121 96 101 99
180 21.38 0.5-16 0.9996 9.1 0.15 0.45 91 120 94 99 102
187 19.05 1-16 0.9980 10.0 0.33 1.00 91 128 93 107 93
*Measure with 5 replicates of breast milk spiked with 4 µg L-1.
Table 2. Performance of the HS-SPME-GD-MS method for PCB analysis
PCB # Retention time / min
Linear range / ( µg L-1)
Correlation coeficient
(r)
Repeatability* / (%)
LOD / (µg L-1)
LOQ / (µg L-1)
Recovery / (%)
1 µg L-1 2 µg L-1 4µg L-1 8 µg L-1 16 µg L-1
28 10.90 1-16 0.9959 4.27 0.79 2.41 126 112 91 83 121
52 12.07 1-16 0.9967 10.95 0.71 2.16 122 102 112 84 114
74 14.10 1-16 0.9985 4.92 0.48 1.46 132 117 88 92 110
101 15.30 1-16 0.9967 4.88 0.72 2.17 100 128 109 109 88
118 17.70 1-16 0.9965 9.97 0.73 2.22 115 121 116 105 90
128 21.26 0.5-16 0.9949 5.12 1.04 3.16 110 127 108 95 99
138 19.90 1-16 0.9941 2.53 0.96 2.91 123 123 110 94 98
153 18.80 1-16 0.9926 10.21 1.07 3.26 103 118 103 119 82
156 22.68 0.5-16 0.9929 7.40 1.23 3.74 106 121 119 95 96
170 24.10 0.5-16 0.9885 6.95 1.58 4.78 84 117 137 107 83
180 23.45 0.5-16 0.9894 10.42 1.51 4.57 93 126 117 112 82
187 21.08 1-16 0.9865 10.85 1.71 5.18 93 126 108 105 84
common in the environment and consequently in human tissues and luids, as breast milk. This product had been extensively used in several industrial applications, such as electrical capacitors, hydraulic luids, adhesives and rubber plasticizers. A review study published in 2007 related that around 250.000 to 300.000 t of Aroclor still have been
used in Brazil, mainly in industrial centers as São Paulo.41
Many cases of oil leak were detected in inactive electric power stations in the state of São Paulo. This problem is yet bigger due to the dificulty to manage industrial and municipal residues. In a study performed in sewage sludge from wastewater treatment in the state of Rio de Janeiro
(approximately 450 km from São Paulo) 57.6 mg kg-1 to the
digested sludge and 145.0 mg kg-1 to the activated sludge
were found. With regards to the indicator-PCB, a limiting
value of 0.2 mg kg-1 of congener (d.w.) is recommended,
which means that the values found in Brazilian sludge
samples by far exceed this limit.42
All the PCB found in this study could be classiied as non-dioxin-like congeners as described in the majority of
the papers. Due to their higher chemical stability, PCB 153
and 180 are usually detected in breast milk samples6,8,43
being also the most common in this study: PCB 153 was
found in all samples from the city of São Paulo and PCB
180 in two of these samples. All the donors from São Paulo
lived in the district of Santo Amaro and neighborhoods. In the 1970’s and 1980’s, this region was the primary industrial center of the city but it has recently changed with industries moving to the countryside. In 2005, the Company of Technology and Environmental Sanitation (CETESB) from São Paulo sealed off several deep wells in this region because of the conirmation of subterranean and supericial
Table 3. Concentration of PCB (µg L-1) in the 20 breast milk samples obtained in the four studied regions
Median ΣPCB PCB 28
PCB 52
PCB 74
PCB 101
PCB 118
PCB 128
PCB 138
PCB 153
PCB 156
PCB 170
PCB 180
PCB 187
São Paulo
1 0.5 5.8 - < LOQ* < LOQ - - - < LOQ 4.6 - - -
-2 2.3 4.7 - < LOQ - - - 4.4 - - -
-3 1.1 4.8 - < LOQ < LOQ - - - - 3.3 - - -
-4 2.7 5.3 - - - 4.1 - - 1.2
-5 3.1 13.9 - 6.2 < LOQ - - - - 4.2 - - 1.4
-Total 2.3 34.5 - 7.8 2.9 - - - < LOQ 20.6 - - 2.6
-Vitória
1 0.7 3.4 - < LOQ < LOQ - - - - < LOQ - 0.7 -
-2 0.9 6.2 - 4.0 < LOQ - - - < LOQ < LOQ - - -
-3 0.6 0.6 - - - 0.6 -
-4 0.9 5.9 - 4.7 < LOQ - - - 0.9 -
-5 1.0 3.3 - < LOQ < LOQ - - - 2.2 -
-Total 0.9 19.4 - 11.1 < LOQ - - - < LOQ < LOQ - 4.4 -
-Florianópolis
1 - - -
-2 - - -
-3 2.1 2.1 - - - 2.1
4 1.0 2.0 - - - 1.7 < LOQ - - -
-5 5.9 11.8 - 10.7 < LOQ - - -
-Total 2.1 15.9 - 10.7 < LOQ - - - 1.7 < LOQ - - - 2.1
Rio Branco -
-1 - - -
-2 - - -
-3 - - -
-4 - - -
-5 - - -
-Total - - -
water contamination with chlorinated substances.44 It is
still more worrying since the dam which distributes water for the whole metropolitan region is located in this area. Figure 1C shows a typical chromatogram of a São Paulo
breast milk sample contaminated with 4.1 µg L-1 of PCB
153 and 1.2 µg L-1 of PCB 180. Throughout this study, the
maximum of contamination (11.78 µg L-1 of PCB) was
found in a sample from São Paulo with 6.19 µg L-1 of PCB
52, 4.18 µg L-1of PCB 153 and 1.41 µg L-1 of PCB 180.
All the samples collected in Vitória were contaminated by some PCB: however, the most common in these samples
was PCB 170 which was quantiied in 80% of the samples.
Vitória is an island and two big harbors support the local economy besides steelworks and mining industries. Two of the mothers reported they lived near steelworks industries and another mother mentioned the presence of a rubber industry in the vicinity. Furthermore, the donors informed they used to eat sea ish and crustaceans at least once a week, which could be another contamination source.
Florianopolis just like Vitória, is situated on an island, although, in this case, the economy is based mainly in tourist and leisure activities, and the big industries are settled in other cities of the state. 60% of contamination was found in these samples, all of which were provided by donors from the countryside of the state of Santa Catarina.
One of these samples was contaminated with 10.7 µg L-1 of
PCB 52: this donor informed she used to eat sea ish and
crustaceans more than once a week. In addition, her family does not have water and sewage treatment in their district. Possibly, in this state, the contamination is distributed to the countryside according to the industries distribution.
In Rio Branco, no contamination at quantiication levels was found. These mothers reported they used to eat ish from local rivers at least once a week. Probably, the PCB levels are lower in this region than in the others because it is located in a remote area within the Amazon region.
Conclusions
The HS-SPME-GC-ECD method developed and applied in this study proved to be a simple, fast and convenient tool for the simultaneous determination of twelve PCB congeners in breast milk samples. The use of an optimized HS-SPME condition allowed the increase in the eficiency of the proposed method. Acceptable results of linearity, precision, recovery, selectivity, LOD and LOQ were obtained in the validation process. The sample analysis revealed that no PCB was found in breast milk samples from the Amazon region. On the other hand, all samples from industrialized cities like São Paulo and Vitória showed some contamination. An extensive study will be
necessary to map the whole country and, afterwards to investigate the development of these children. However, the practice of breast-feeding should not be discouraged because of well-recognized advantages.
Acknowledgments
This study was funded by State of São Paulo Research Foundation (FAPESP) and by the National Council for Technological and Scientiic Development (CNPq). C. Kowalski thanks the - Brazilian Federal Agency for Support and Evaluation of Graduate Education (CAPES) for the scholarship. The authors also thank Roger Wagner for the assistance in GC-MS analysis, as well as the donors and the Human Milk Banks for the participation in the study.
References
1. WHO (World Health Organization); Air Quality Guideline, No. 2, WHO: Copenhagen, 2000.
2. Lambropoulou, D. A.; Konstantinou, I. K.; Albanis, T. A.; J. Chromatogr., A2006, 1124, 97.
3. Safe, S.; Crit. Rev. Toxicol.1994, 24, 87.
4. Llompart, M.; Pazos, M.; Landín, P.; Cela, R.; Anal. Chem. 2001, 73, 5858.
5. Ahlborg, U. G.; Becking, G. C.; Birnbaum, L. S.; Brouwer, A.; Derks, H. J. G. M.; Feeley, M.; Golor, G.; Hanberg, A.; Larsen, J. C.; Liem, A. K. D.; Chemosphere1994, 28, 1049.
6. Jaraczewska, K.; Lulek, J.; Covaci, A.; Voorspoels, S.; Kaluba-Skotarczak, A.; Drews, K.; Schepens, P.; Sci. Total Environ. 2006, 372, 20.
7. Hong, J. E.; Pyo, H.; Park, S. J.; Lee, W.; Anal. Chim. Acta 2005, 539, 55.
8. Norén, K.; Meironyté, D.; Chemosphere2000, 40, 1111. 9. Heck, M. C.; Santos, J. S.; Bogusz Jr, S.; Costabeber, I.;
Emanuelli, T.; Food Chem. 2007, 102, 288.
10. Costabeber, I.; Santos, J. S.; Xavier, A. A. O.; Weber, J.; Leães, F. L.; Bogusz Jr, S.; Emanuelli, T.; Food Chem. Toxicol.2006, 44, 1.
11. Johansen, P.; Muir, D.; Asmund, G.; Riget, F.; Sci. Total Environ. 2004, 331, 189.
12. Schecter, A.; Cramer, P.; Boggess, K.; Stanley, J.; Olson, J. R.; Chemosphere1997, 34, 1437.
13. Basheer, C.; Lee, H. K.; Obbard, J. P.; J. Chromatogr., A2004, 1022, 161.
14. WHO (World Health Organization); Polychlorinated Biphenyls and Terphenyls; Environmental Health Criteria. No. 140, WHO: Geneva, 1993.
16. Furst, P.; Furst, C.; Wilmers, K.; Environ. Health Perspect.1994, 102, 187.
17. Ingerido, A. M.; Ballard, T.; Dellatte, E.; di Domenico, A.; Ferri, F.; Fulgenzi, A. R.; Herrmann, T.; Iacovella, N.; Minero, R.; Papke, O.; Porpora, M. G.; Felip, E. D.; Chemosphere 2007, 67, 301.
18. Yu, Z.; Palkovicova, L.; Drobna, B.; Petrik, J.; Kocan, A.; Trnovec, T.; Hertz-Picciotto, I.; Chemosphere2007, 66, 1012. 19. Vukavic, T.; Miloradov, M. V.; Ristivojevic, A.; Hlpka, J.;
Environ. Toxicol. Pharmacol.2008, 25, 176.
20. Gonzales, M. J.; Jiménez, B.; Hernández, L. M.; J. High Resolut. Chromatogr. 1995, 16, 129.
21. Di Muccio, A.; Camino, I.; Dommarco, R.; Santilio, A.; Ausili, A.; Rizzica, M.; Gibli, B.; Calzolari, C.; Ann. Inst. Super. Sanitá 1990, 26, 155.
22. US-EPA, (US Environmental Protection Agency); Non-Dioxin-Like PCBs: Effects and Consideration in Ecological Risk
Assessment; National Center for Environmental Assessment, Office of Research and Development: Cincinnati, OH, NCEA-C-1340, 2003.
23. Ahmed, F. E. In Environmental Contaminants in Food; Moffat, C. F.; Whittle, K. J., eds.; Shefield Academic Press: England, 1999.
24. Pereira, M. S.; Kuch, B.; Chemosphere2005, 60, 844. 25. http://www.anvisa.gov.br/toxicologia/dioxina_leite.doc,
accessed in March 2008.
26. Valsamaki, V. I.; Boti, V. I.; Sakkas, V. A.; Albanis, T. A.; Anal. Chim. Acta2006, 573, 195.
27. Arthur, C. L.; Pawliszyn, J.; Anal. Chem.1990, 62, 2145. 28. Augusto, F.; Valente, A. L. P.; Trends Anal. Chem.2002, 21,
428.
29. Montes, R.; Ramil, M.; Rodriguez, I.; Rubí, E.; Cela, R.; J. Chromatogr., A2006, 1124, 43.
30. Penalver, A.; Pocurull, E.; Borrull, F.; Marcé, R. M.; Trends Anal. Chem.1999, 18, 557.
31. Kowalski, C. H.; Silva, G. A.; Poppi, R. J.; Godoy, H. T.; Augusto, F.; Anal. Chim. Acta2007, 585, 66.
32. López, R.; Goñi, F.; Etxandia, A.; Millán, E.; J. Chromatogr., A 2007, 846, 298.
33. Sundberg, S. E.; Ellington, J. J.; Evans, J. J.; J. Chromatogr., B 2006, 831, 99.
34. Verenitch, S. S.; deBruyn, A. M. H.; Ikonomou, M. G.; Mazumder, A.; J. Chromatogr., A2007, 1142, 199.
35. Popp, P.; Keil, P.; Montero, L.; Ruckert, M.; J. Chromatogr., A 2005, 1071, 155.
36. Potter, D. W.; Pawliszyn, J.; Environ. Sci. Technol. 1994, 28, 298.
37. Röhrig, L.; Meisch, H. U.; Fresenius J. Anal. Chem.2000, 366, 106.
38. Miller, J. M.; Chromatography: Concepts and Contrasts, 2nd
ed., Wiley: New Jersey, 2005.
39. ICH (International Conference on Harmonisation); Validation of Analytical Procedures: Methodology, Q2B (CPMP/ ICH/281/95), 1995.
40. Criado, M. R.; Pereiro, I. R.; Torrijos, R. C.; Talanta2004, 63, 533.
41. Almeida, F. V.; Centeno, A. J.; Bisinoti, M. C.; Jardim, W. F.; Quim. Nova2007, 30, 1976.
42. Pereira, M. S.; Kuch, B.; Chemosphere2005, 60, 844. 43. She, J.; Petreas, M. X.; Visita, P.; McKinney, M.; Sy, F. J.;
Winkler, J. J. K.; Hooper, K.; Stephens, R. D.; Chemospere 1998, 37, 431.
44. http://www.cetesb.sp.gov.br/noticentro/2005/11/23_jurubatuba.htm, accessed in March 2009.
Received: June 8, 2009
Web Release Date: December 11, 2009