Genome-Wide Analysis of Simple Sequence
Repeats and Efficient Development of
Polymorphic SSR Markers Based on Whole
Genome Re-Sequencing of Multiple Isolates
of the Wheat Stripe Rust Fungus
Huaiyong Luo1,2, Xiaojie Wang1,2*, Gangming Zhan1,2, Guorong Wei1,2, Xinli Zhou1,2, Jing Zhao1,2, Lili Huang1,2, Zhensheng Kang1,2*
1College of Plant Protection, Northwest A&F University, Yangling, Shaanxi, People's Republic of China,
2State Key Laboratory of Crop Stress Biology for Arid Areas, Yangling, Shaanxi, People's Republic of China
*kangzs@nwsuaf.edu.cn(ZK);wangxiaojie@nwsuaf.edu.cn(XW)
Abstract
The biotrophic parasitic fungusPuccinia striiformisf. sp.tritici(Pst) causes stripe rust, a devastating disease of wheat, endangering global food security. Because thePst popula-tion is highly dynamic, it is difficult to develop wheat cultivars with durable and highly effec-tive resistance. Simple sequence repeats (SSRs) are widely used as molecular markers in genetic studies to determine population structure in many organisms. However, only a small number of SSR markers have been developed forPst. In this study, a total of 4,792 SSR loci were identified using the whole genome sequences of six isolates from different re-gions of the world, with a marker density of one SSR per 22.95 kb. The majority of the SSRs were di- and tri-nucleotide repeats. A database containing 1,113 SSR markers were estab-lished. Throughin silicocomparison, the previously reported SSR markers were found mainly in exons, whereas the SSR markers in the database were mostly in intergenic re-gions. Furthermore, 105 polymorphic SSR markers were confirmedin silicoby their identi-cal positions and nucleotide variations with INDELs identified among the six isolates. When 104in silicopolymorphic SSR markers were used to genotype 21Pstisolates, 84 produced the target bands, and 82 of them were polymorphic and revealed the genetic relationships among the isolates. The results show that whole genome re-sequencing of multiple isolates provides an ideal resource for developing SSR markers, and the newly developed SSR markers are useful for genetic and population studies of the wheat stripe rust fungus.
Introduction
Wheat stripe (yellow) rust is a devastating disease causing calamitous production losses of wheat, one of the most important cereal crops worldwide [1], endangering global food security.
a11111
OPEN ACCESS
Citation:Luo H, Wang X, Zhan G, Wei G, Zhou X, Zhao J, et al. (2015) Genome-Wide Analysis of Simple Sequence Repeats and Efficient Development of Polymorphic SSR Markers Based on Whole Genome Re-Sequencing of Multiple Isolates of the Wheat Stripe Rust Fungus. PLoS ONE 10(6): e0130362. doi:10.1371/journal.pone.0130362
Academic Editor:David D Fang, USDA-ARS-SRRC, UNITED STATES
Received:February 16, 2015
Accepted:May 18, 2015
Published:June 12, 2015
Copyright:© 2015 Luo et al. This is an open access article distributed under the terms of theCreative Commons Attribution License, which permits unrestricted use, distribution, and reproduction in any medium, provided the original author and source are credited.
Data Availability Statement:All relevant data are within the paper and its Supporting Information files.
It is caused by the obligate biotrophic parasitic fungusPuccinia striiformisf. sp.tritici(Pst) and occurs in most wheat areas with cool and moist weather conditions during the growing season [2].Pstrequires living host (wheat/grasses and Berberis/Mahonia spp.) to complete the asexual and sexual phases of its life cycle [3]. Its dikaryotic urediniospores are the main spores that in-fected wheat and are able to spread via the wind up to thousands of kilometers from the initial infection sites [4–6].Pstpopulations often possess a high genetic diversity and virulence vari-ability [7], giving them the ability to circumvent specific resistance genes incorporated in wheat cultivars within only a few years after release [5,8,9]. Understanding the mechanisms of the pathogen diversity and virulence variability is important for control of the disease.
Simple sequence repeats (SSRs), also known as microsatellites, are tandem repeats of 2–6 base pairs of DNA flanked by sequences that are generally unique in the genome, but conserved in the organism populations [10,11]. The unique flanking sequences may provide templates that facilitate the development of specific primers for amplifying SSR alleles by polymerase chain reaction (PCR). Allelic differences identified in this manner indicate variable numbers of repeat units present at SSR loci. SSRs have been used as molecular markers in many organisms because they are abundant, highly polymorphic and repeatable. Because SSR markers are often co-dominant, they are preferred over dominant markers for genetic studies of diploid or higher ploidy organisms [12–19].
ForPst, SSR markers have been developed using microsatellites enrichment DNA library [20] and expression sequence tag (EST) libraries [21–23], as well as genomic sequences [24], and are the primary molecular markers used in genetic and population studies. For example, SSR markers were used to reveal the existence of the sexual and parasexual cycles [25–27], esti-mate the genetic diversity of differentPstpopulations [28–31] and analyze the origin, migra-tion routes and worldwide populamigra-tion structures ofPst[32]. However, only a small number of SSR markers were used in these studies. For more sophisticated studies, more SSR markers are needed.
Whole-genome sequence of multiple isolates can provides data for developing genetic markers. The first reportedPstgenome is that of isolate PST-130 in the USA, which was ob-tained through next generation sequencing [33]. Bailey et al. [24] reported 25 SSR markers de-rived from the sequences of this isolate. The genome of the CYR32, one of the most dominant
Pstraces in China, was assembled using a 'fosmid-to-fosmid' strategy to reduce the affect of ge-nome heterozygosity [34]. The assembled genome of CYR32 (~110 Mb) was larger than the draft genome of PST-130 (~64.8 Mb), but was comparable with the genome of PST-78 (~117Mb), another sequenced isolate from the USA (http://www.broadinstitute.org, unpub-lished). The genome assembly of CYR32 is suitable for the genome-wide analysis of SSRs.
In this study, we identified 4,792 SSR loci from the CYR32 genome sequence and deter-mined the distribution patterns of SSRs in this isolate and five additional isolates from different countries. To provide thePstcommunity with more markers for more sophisticated studies, we developed a SSR marker database containing 1,113 SSR markers based on the genomes of the six isolates. We also validated 82 polymorphic SSR markers.
Materials and Methods
2.1
Pst
Isolates
The sequence reads of sixPstisolates, 104E137A from Australia, CYR23 and CYR32 from China, Hu09-2 from Hungary, PK-CDRD from Pakistan and PST-78 from the USA, were used to identify polymorphic SSR loci [34]. For SSR marker validation, 21 isolates collected from the USA, Hungary and China were used (Table 1). Urediniospores were multiplied on wheat from a single urediniospore for each isolate and used for DNA extraction.
science and technology, Shaanxi to XW. The funders had no role in study design, data collection and analysis, decision to publish, or preparation of the manuscript.
2.2
Pst
genome sequences and INDEL discovery
The previously published genome sequence of CYR32 [34] was used as the reference genome. Sequence reads used in this study were obtained from PE (paired ends) libraries with 500bp in-serts using the Illumina whole genome sequencing technology. High quality reads were ex-tracted with NGSQCToolkit_v2.3.3 [35], SolexaQA_v.2.2 [36] and FASTX_Toolkit (http:// hannonlab.cshl.edu/fastx_toolkit/) software, and were aligned against the CYR32 reference ge-nome using BWA-0.7.9a [37] software. The GATK [38] duplicate removal, INDEL (insertions or deletions) realignment and base quality score recalibration, and performed INDEL discovery across all six isolates were conducted simultaneously according to GATK Best Practices recom-mendations [39,40]. The average re-sequencing depth was 18.98, and genome coverage was 95.52%. A consensus genome sequence for each isolate was generated using Samtools-0.1.19 [41] software. The joint INDEL discovery across all six isolates was performed using Samtools-0.1.19. Only concordance INDELs, which were discovered by both methods [42] and passed a quality filter (QD>2.0, FS<200.0, ReadPosRankSum>-20.0) [39,40], were used to identify
candidate polymorphic SSR loci.
2.3 SSR identification and primer design
The flow chart presented in supporting informationS1 Figillustrates the main steps used to de-velop SSR markers. SSR motifs were identified in the six genomes using a MISA script down-loaded fromhttp://pgrc.ipkgatersleben.de/misa/. Only perfect SSRs, including di-, tri-, tetra-,
Table 1. Description of thePuccinia striiformisf. sp.triticiisolates used to evaluate the polymorphism of SSR markers.
ID Isolates Geographic origin
1 PST-1 USA
2 PST-17 USA
PST-43 USA
4 PST-78 USA
5 PST-114 USA
6 XIONG Hungary
7 CYR20 China
8 CYR23 China
9 CYR31 China
10 CYR32 China
11 HA-7 Xinjiang, China
12 G148-2 Xinjiang, China
13 G149-2 Xinjiang, China
14 G150-14 Xinjiang, China
15 G164-26 Xinjiang, China
16 G167-10 Xinjiang, China
17 G167-12 Xinjiang, China
18 G167-14 Xinjiang, China
19 GL17-2 Gansu, China
20 DT-6 Qinghai, China
21 G862-34 Tibet, China
penta-, and hexa-nucleotide motifs with numbers of uninterrupted repeat units greater than 7, 6, 5, 4, and 4, respectively, were included in this study.
In order to identify SSR loci with unique flanking sequences, repeat motifs and 300bp flank-ing sequences on each side were used for BLASTN search against the genomic sequences (e-value cut-off of 1e-10), and filtered with>90% identity and>85% alignment length of the
flanking sequences. SSR loci with a single hit were identified as candidate loci for marker devel-opment. Primer pairs of SSR markers were designed using Primer 3 software (http://primer3. sourceforge.net/) with the following parameters: minimum, maximum, and optimal sizes were 18, 27, and 20 nt, respectively; minimum and maximum GC content were 20% and 80%, re-spectively; minimum, maximum, and optimal Tm were 57, 63, and 60°C, rere-spectively; and product size range was from 100 to 300 bp.
The specificity of designed primers was confirmed through electronic polymerase chain re-action (E-PCR) [43,44] in the genomes using following parameters: the word size was 9, the discontinuous word was 1, the maximal deviation of observed product size to expected size was 100, both the number of mismatches and gaps allowed per primer were 1. The 84 previously publishedPstSSR markers [20–24] were downloaded and amplified by E-PCR for comparison.
In addition, the genomic locations of SSRs were annotated. The exon, intron, and intergenic region were determined based on the original annotation of the CYR32 reference genome. The promoter regions were designated at 2 kb upstream of the start site of first exon. A protein was designated“secreted”if it contained a signal peptide and“pathogenicity-related”if it showed high similarity to a protein in the PHI database [45,46]. Moreover, a custom Perl script was used to directly identify polymorphic SSRs by the identical sequence position and nucleotide variation of identified INDELs and of developed SSR markers.
2.4 Experimental validation of polymorphic SSR markers
To experimentally validate putative polymorphic SSR markers, 104 primer pairs were synthe-sized by Sangon Biotech (Shanghai) Co., Ltd. Twenty-onePstisolates inTable 1were used in this experiment. Genomic DNA was extracted from urediniospores using a Fungal gDNA Kit (Biomiga). PCR reactions were performed in a 25μl volume containing 2.0μl template DNA
(50ng/μl), 2.5μl reaction buffer (10×, Mg2+ free), 2.0μl Mg2+ (25mM), 2.0μl dNTPs (2.5mM),
1μl each primer (10mM), 0.2μl Taq DNA polymerase (5U/μl, Thermo Scientific) and 14.3μl
ddH2O. The PCR conditions were as follows: 95°C for 4min; 35 cycles of 94°C for 45s, 55–58°C
Results
3.1 The abundance of SSRs in the Pst genome
A total of 4,792 unique SSR loci were identified by searching through the genomes of the six
Pstisolates from five countries with the MISA script. The number of SSRs varied among the different isolates (Table 2), ranging from 4,536 in PST-78 to 4,665 in CYR32 with the average of 4,576. Of the total of unique SSRs, 4,310 were common in all six isolates, and 492 in one or more, but not all isolates. Of the repeat motifs observed, the di-nucleotide motif was the most abundant (46.87%), followed by tri- (32.32%), penta- (9.39%), hexa- (5.95%), and tetra-(5.47%) nucleotide motifs (Table 3). The average intervals for di-, tri-, tetra-, penta-, and hexa-nucleotide SSRs were 51.04, 74.32, 445.34, 257.61, and 411.99 kb, respectively (Table 2). Con-sidering the total of 4792 loci, the average interval was estimated as 22.95 kb, indicating the high abundance of SRRs in thePstgenome.
The SSRs were found to be 170 repeat types (S1 Table), some of which were dominant. Of the three di-nucleotide motifs (Fig 1A), AG/CT was the most abundant (1523, 67.81%) fol-lowed by AT/AT (546, 24.31%), while AC/GT was the least frequent (177, 7.88%). Of the ten types of tri-nucleotide motifs (Fig 1B), ATC/ATG was the most frequent (404, 26.08%), fol-lowed by AAG/CTT (312, 20.14%) and AAC/GTT (291, 18.79%), while other seven types were lower in frequency (2–121, 0.13–7.81%). There were 22 types of tetra-nucleotide motifs, of
Table 2. Numbers and density of the SSR loci identified in the genomes of sixPuccinia striiformisf. sp.triticiisolates.
SSR numbers SSR interval (kb)
Isolates DNR* TNR* TTR* PNR* HNR* Total DNR* TNR* TTR* PNR* HNR* Total
CYR32 2211 1510 257 424 263 4665 49.75 72.85 428.02 259.43 418.25 23.58
CYR23 2175 1471 248 429 273 4596 50.57 74.78 443.55 256.41 402.93 23.93
PK-CDRD 2147 1487 244 426 271 4575 51.23 73.97 450.82 258.22 405.90 24.04
104E137A 2134 1475 245 425 264 4543 51.55 74.58 448.98 258.82 416.67 24.21
Hu09-2 2138 1467 242 429 267 4543 51.45 74.98 454.55 256.41 411.99 24.21
PST-78 2124 1469 246 432 265 4536 51.79 74.88 447.15 254.63 415.09 24.25
Average 2155 1480 247 427 267 4576 51.04 74.32 445.34 257.61 411.99 24.04
Total 2246 1549 262 450 285 4792 48.98 71.01 419.85 244.44 385.96 22.95
Common 2039 1410 228 391 242 4310 53.95 78.01 482.46 281.33 454.55 25.52
*DNR, TNR, TTR, PNR, and HNR indicate di-, tri-, tetra-, penta-, and hexa-nucleotide SSRs, respectively.
doi:10.1371/journal.pone.0130362.t002
Table 3. Numbers and percentages of the identified SSR loci and developed SSR markers
Total identified SSR loci Newly developed SSR markers 105 polymorphic SSR markers
Motifs Number Percentage (%) Number Percentage (%) Number Percentage (%)
DNR* 2246 46.87 563 50.58 70 66.67
TNR* 1549 32.32 305 27.40 23 21.90
TTR* 262 5.47 84 7.55 4 3.81
PNR* 450 9.39 99 8.89 4 3.81
HNR* 285 5.95 62 5.57 4 3.81
Total 4792 100.00 1113 100.00 105 100.00
*DNR, TNR, TTR, PNR, and HNR indicate di-, tri-, tetra-, penta-, and hexa-nucleotide SSRs, respectively.
which the top three types (AAAT/ATTT, AAAG/CTTT and AAAC/GTTT) accounted for 20.99% (55), 19.47% (51) and 14.50% (38), respectively, while other types ranged from 0.38% (1) to 7.63% (20). Of the 53 types of penta-nucleotide motif, AAAAC/GTTTT (68, 15.11%), and AAAAG/CTTTT (53, 11.78%) were the most common, while others ranged from 0.22% (1) to 9.78% (44). ACACTC/AGTGTG was the most common repeat type (39, 13.68%) of the 82 types of hexa-nucleotide motifs, and others ranged from 0.35%(1) to 6.67%(19). In addition, the AG/CT di-nucleotide repeat unit had the highest repeat number (40) of all identified SSRs.
Fig 1. Percentage of different repeat types of di- and tri-nucleotide SSRs in isolate CYR32 ofPuccinia striiformisf. sp.tritici
The average repeat lengths varied among repeat types, ranging from 15.32bp for AC/GT to 51.00bp for AAGGAG/CCTTCT.
3.2 Screening for SSR candidate loci and developing Pst SSR markers
In order to identify candidate loci for marker development, all 4792 SSR motifs, together with their 300bp flanking sequences on each side were used for a BLASTN search against the geno-mic sequence. 1,446 loci (30.18%) produced single hits based on our cutoff across all sixPst iso-lates. Primers were designed for the 1,446 candidate loci with Primer3 software, and the specificity of these primers was validatedin silicousing E-PCR software, which result in 1113 primer pairs "amplified" expected bands and the remaining 333 "amplified" multiple bands or produced false matches (S2 Table). The 1113 SSR markers with specific primers form a new da-tabase ofPstSSR markers. This database accounts for 23.23% of the total 4792 identified loci (Table 3). In the database, SSRs with di-, tri-, tetra-, penta-, and hexa- nucleotide motifs ac-counted for 50.58%, 27.40%, 7.55%, 8.89%, and 5.57% of the SSRs, respectively (Table 3).
3.3 In silico comparison with previously reported SSR markers
A total of 84 SSR markers had been reported forPst(S3 Table) prior to the present study. Through E-PCR, 34 SSR markers were found to have unique primer binding sites (S2B Fig), 23 had two primer binding sites (S3B Fig), 5 had three primer binding sites (S4A Fig), and the re-maining 22 markers had no proper primer binding sites (S4 Table). The 34 SSR markers with unique binding sites "amplified" 30 SSR loci in 29 scaffolds in thePstgenome (S2B Fig). Among the 30 SSR loci, 14 loci also could be amplified with 14 newly developed SSR markers, as shown inS2C Fig. In addition, we found that markers CPS02, CPS10, CPS13, and PstP001 mapped to the same loci as RJ3N, RJ8N, RJ13N, and Pst002, respectively (S2B Fig). These re-sults should be helpful in selecting SSR markers by reducing the possibility of using "different" primers to amplify the same SSR loci.
3.4 Distribution of SSR markers in different genomic regions
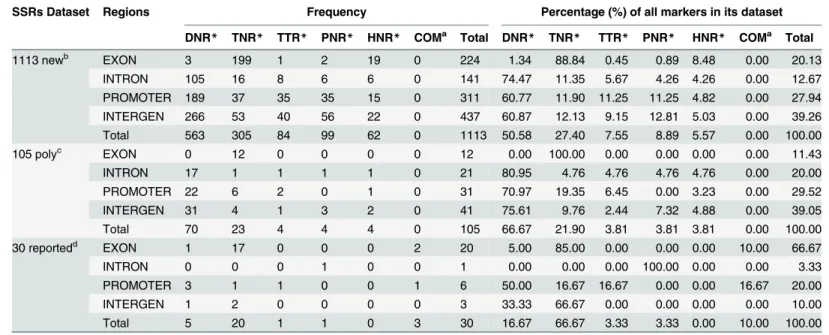
In order to investigate the distribution of SSR markers among different genomic regions, we mapped them to exon, intron, intergenic and promoter regions based on the original annota-tions of the CYR32 reference genome (Table 4). A high percentage of markers in our SSR marker database were located in intergenic region (39.26%), followed by promoter region (27.94%) and exon (20.13%), while those in intron were the fewest(12.67%). The 30 previously reported SSR markers were found mostly in exon (66.67%), because most were identified from EST libraries. Therefore, the newly identified SSR markers should provide more information in non-transcribed regions of thePstgenome.
The SSRs containing tri-nucleotide repeats were the most frequent (>88.84%) among the
five repeat types found in exon. Of the SSRs in exon, tri- and hexa-nucleotide SSRs that would not cause a frameshift accounted for 97.32%, while only 2.68% had potential to change the gene structure. We also calculated the frequency and percent of amino acids encoded by tri-nucleotide repeats in the corresponding 179 genes. These tri-tri-nucleotide repeats encoded 11 kinds of amino acid (Table 5). Polar amino acids (QSTNG) accounted for 54.31% of those en-coded, followed by acidic amino acids (ED,24.87%) and basic amino acid (HK,9.14%).
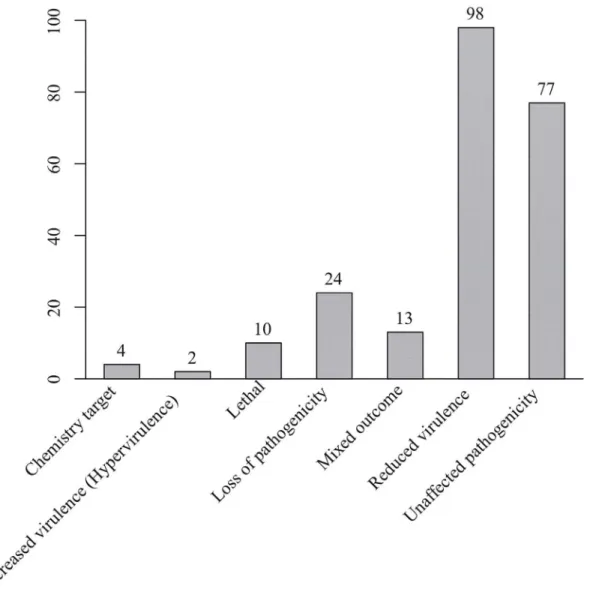
genes were related to reduced virulence or loss of pathogenicity (Fig 2), indicating that the genes may play important roles in infection and development process of the stripe rust patho-gen [45,46,49]. These SSR markers may therefore facilitate the genetic study of these genes in
Pstpopulations. In contrast, only 10 out of 30 previously reported markers were linked to PHI homologous genes, and only 1 marker was linked to a secreted proteins. These results further indicated the usefulness of the database in studyingPst.
Table 5. Frequency and percent of amino acids encoded by tri-nucleotide motifs in their corresponding genes.
Amino Acid FREQ* PCT* Full Name Property
Q 38 19.29 Glutamine Polar
S 33 16.75 Serine Polar
T 18 9.14 Threonine Polar
N 12 6.09 Asparagine Polar
G 6 3.05 Glycine Polar
E 27 13.71 Glutamic acid Acid
D 22 11.17 Aspartic acid Acid
H 14 7.11 Histidine Basic
K 4 2.03 Lysine Basic
P 17 8.63 Proline Nonpolar
A 6 3.05 Alanine Nonpolar
*FREQ: frequency; PCT: percentage (%).
doi:10.1371/journal.pone.0130362.t005
Table 4. Distribution of SSR markers in different genomic regions ofPuccinia striiformisf. sp.tritici.
SSRs Dataset Regions Frequency Percentage (%) of all markers in its dataset
DNR* TNR* TTR* PNR* HNR* COMa Total DNR
* TNR* TTR* PNR* HNR* COMa Total
1113 newb EXON 3 199 1 2 19 0 224 1.34 88.84 0.45 0.89 8.48 0.00 20.13
INTRON 105 16 8 6 6 0 141 74.47 11.35 5.67 4.26 4.26 0.00 12.67
PROMOTER 189 37 35 35 15 0 311 60.77 11.90 11.25 11.25 4.82 0.00 27.94
INTERGEN 266 53 40 56 22 0 437 60.87 12.13 9.15 12.81 5.03 0.00 39.26
Total 563 305 84 99 62 0 1113 50.58 27.40 7.55 8.89 5.57 0.00 100.00
105 polyc EXON 0 12 0 0 0 0 12 0.00 100.00 0.00 0.00 0.00 0.00 11.43
INTRON 17 1 1 1 1 0 21 80.95 4.76 4.76 4.76 4.76 0.00 20.00
PROMOTER 22 6 2 0 1 0 31 70.97 19.35 6.45 0.00 3.23 0.00 29.52
INTERGEN 31 4 1 3 2 0 41 75.61 9.76 2.44 7.32 4.88 0.00 39.05
Total 70 23 4 4 4 0 105 66.67 21.90 3.81 3.81 3.81 0.00 100.00
30 reportedd EXON 1 17 0 0 0 2 20 5.00 85.00 0.00 0.00 0.00 10.00 66.67
INTRON 0 0 0 1 0 0 1 0.00 0.00 0.00 100.00 0.00 0.00 3.33
PROMOTER 3 1 1 0 0 1 6 50.00 16.67 16.67 0.00 0.00 16.67 20.00
INTERGEN 1 2 0 0 0 0 3 33.33 66.67 0.00 0.00 0.00 0.00 10.00
Total 5 20 1 1 0 3 30 16.67 66.67 3.33 3.33 0.00 10.00 100.00
*DNR, TNR, TTR, PNR, and HNR indicate di-, tri-, tetra-, penta-, and hexa-nucleotide SSRs, respectively. a
COM indicate compound SSRs which containing more than one repeat type within 100bp. b
The newly developed database containing 1113 SSR markers.
cThe 105 polymorphic SSR markers identifiedin silicousing INDELs information. d
The 30 SSR loci located by E-PCR with the previously reported SSR markers.
3.5 Identification of polymorphic SSR markers using INDEL variation
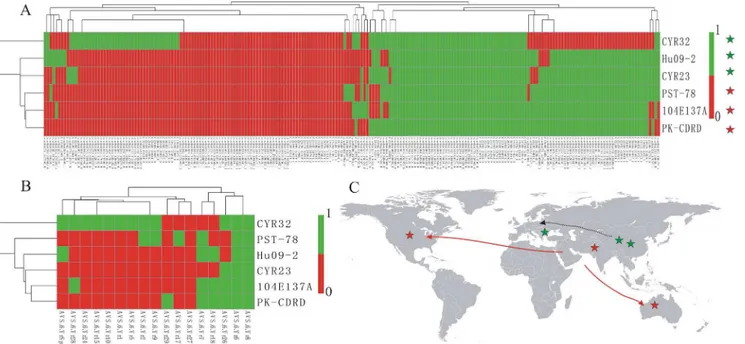
In order to identify SSR markers with polymorphism, we identified INDELs present in the six isolates using GATK and Samtools software. As shown inS5 Fig, there are 13,143 concordance INDELs, 4,975 unique-to-GATK INDELs and 2,555 unique-to-Samtools INDELs. Because concordance INDELs were more robust than unique-to-method INDELs [42], we focused on concordance INDELs for the sake of accuracy. The identical sequence positions and nucleotide variations of the putative INDELs and of the SSRs directly revealed the presence of polymor-phisms for 105 SSRs (S5 Table), accounting for 9.43% of the newly developed SSR markers. The tree based on these INDELs (Fig 3A) showed a similar topology to the virulence-based tree (Fig 3B) for the six isolates except PST-78 from the USA, which harbored INDEL polymor-phisms similar to isolates from Pakistan and Australia but had a much different virulence pat-tern. Moreover, the INDEL-based tree showed some correlation with geographical origin. The tree suggested that PST-78 (USA), 104E137A (Australia), and PK-CDRD (Pakistan) had the same origin, and that CYR23 (China), CYR32 (China), and Hu09-2 (Hungary) might have
Fig 2. Functional categories ofPuccinia striiformisf. sp.triticigenes closely linked with SSRs using the PHI database
another origin (Fig 3C), which is consistent with a recent worldwide population structure study ofPst[32].
The SSRs with di-, tri-, tetra-, penta-, and hexa-nucleotide motifs accounted for 66.67%, 21.90%, 3.81%, 3.81%, and 3.81% of these 105 SSRs, respectively (Table 3). Of the 105 polymor-phic SSR markers, 12 markers were in exons, 21 in introns, 31 in promoter regions, and 41 in intergenic regions (Table 4). Among them, 11 were associated with secreted proteins, while 24 were associated with pathogenicity-related genes. Moreover, only marker scaffold532-150474 shared a locus with a previously reported marker (SUNIPst09-40) (S2 Fig). Therefore, there are 104 markers would amplify loci which are not targeted by the previously reported 84 SSR markers.
3.6 SSR markers validated for quality and polymorphism
After excluding the SSR marker scaffold532-150474 sharing the locus which could be amplified with a previously reported marker SUNIPst09-40, the other 104in silicopolymorphic SSR markers were experimentally validated with 21 isolates (Table 1). Eighty-four of the markers generated specific bands, while 20 primer pairs failed to produce stable or clear bands due to a lack of sequence specificity in the genomic DNA samples. Of the 84 primer pairs, 82 revealed allelic difference among the 21 isolates tested (Fig 4, details are presented inS6 Table). For these polymorphic SSR markers, the motif length ranged from 14 to 42bp with an average of 19.48bp. Repeat numbers ranged from 4 to 15 units with an average of 7.96. In total, 477 alleles were amplified, with a range of 2–12 alleles at an average of 5.82 alleles. Product sizes ranged from 116 to 307bp. Polymorphic information content (PIC) values ranged from 0.17 to 0.88 with an average of 0.71. Observed heterozygosity (Ho) ranged from 0.00 to 0.95 with an aver-age of 0.31, and expected heterozygosity (He) ranged from 0.17–0.88 with an average of 0.71.
Fig 3. Relationships among sixPuccinia striiformisf. sp.tritici(Pst) isolates.(A) Heat map and race relationship of sixPstisolates according to the INDEL variation in the 105 polymorphic SSRs using Pheatmap software. The presence and absence of bands were recorded as 1 and 0, respectively. (B) Heat map and relationship of the sixPstisolates according to their virulence on 17 differential cultivars downloaded from published paper using same method. The susceptible and resistant were recorded as 1 and 0, respectively. (C) Relative position of the sixPstisolates and their reported geographical origins.
Fig 4. Experimental validation of five representative SSR markers in 21Puccinia striiformisf. sp.triticiisolates.Gel images are shown from the analyses performed with the QiaxcelScreenGel software. Lane M, a size marker; Lane NC, a negative control; and Lanes 1–21, the PCR products of 21
corresponding isolates. DNR, TNR, TTR, PNR, and HNR indicate di-, tri-, tetra-, penta-, and hexa-nucleotide SSRs.
Six markers were dominant in these 21 isolates, and the other 76 markers were co-dominant. The relatively high PIC and relatively low observed heterozygosity could be due to a higher conservation of these SSR loci among the 21 isolates, achieved by selecting unique flanking se-quences in multiplePstgenomes. Based on the molecular genotypes of the 82 polymorphic SSR markers, both principal component analysis and cluster analysis separated these 21 isolates into four groups (Fig 5): group Ga with only two isolates from the US; group Gb with isolates from the US, China and Hungary; group Gc with isolates from Xinjiang, Qinghai and Tibet in China; and group Gd with isolates from Xinjiang and Gansu in China. This result was consis-tent with previous report that thePstpopulations of China and the US in general evolved inde-pendently [31]. These results indicated that newly developed SSR markers were informative and useful; approximately 80.77% of the primers in our SSR database were effective. It was highly efficient (97.62%) to identify polymorphic SSR markers using the INDEL data based on whole genome re-sequencing of multiple isolates.
Discussion
SSRs are abundant and dispersed throughoutPstgenomes. A total of 4,792 SSR loci were iden-tified from sixPstisolates from five countries. This number is much larger than the 1,889 loci found in another genome-derived SSR identification [24] using the PST-130 sequence that cover only about 60% of thePstgenome [33]. The much larger number was achieved through the much better coverage of the sequence data from six isolates. This abundance of SSRs inPst
is neither the highest nor the lowest reported for fungi [50]. In thePstgenome, the di- and tri-nucleotide SSR motifs were more abundant than tetra-, penta-, and hexa-tri-nucleotide motifs. SSR densities for different types of motifs varied from 51.04 to 411.99 kb. Moreover, we found that the AG/CT and ATC/ATG repeats were the most abundant di- and tri-nucleotide SSRs, respectively, inPst. The abundance of AG/CT motifs is similar to the reports for other fungi, but our finding of abundant ATC/ATG motifs inPstis different from other fungi [17,50], sug-gesting thatPstshares some common features in SSR loci formation and structure with other fungi, but also has its unique features. SSRs containing tri-nucleotide repeats were the most fre-quent (>88.84%) among the five repeat types found in exon, which was consistent with other
reports [51–54]. Such phenomenon maybe due to the selection against frameshift mutations in coding regions [55]. More studies on the exon tri-nucleotide repeat SSR loci in comparison with other SSR loci may lead to a better understanding of thePstevolution.
Fig 5. Relationship of 21 isolates based on genotypes of 82 experimentally validated SSR markers.(A) Principal component analyses. (B) Dendrogram showing the similarities based on the UPGMA; the number at each branch shows the bootstrap value with 1,000 replications.
validation, 82 primer pairs were polymorphic among 21 isolates tested, and we determined the genetic relationships of the isolates using markers. Therefore, SSR markers identified in this study should be useful in a variety of applications, such as studying of population structures, mapping avirulence genes or genes for other important traits, and tagging or monitoring par-ticular populations, virulence, and pathotypes of the pathogen.
Pstpopulations possess a high genetic diversity and virulence variability [7], giving them the ability to counteract the specific resistance genes in wheat cultivars [5,8,9]. Therefore, mon-itoring the pathogen populations is important for control of the disese. Traditionally, thePst
populations are monitored through virulence surveys [60] or just using a small number of mo-lecular markers [28–31]. The availability of more markers can differentiate isolates better and improve our understanding of the genetic diversity and population structure ofPstin various agro-ecosystems. The population dynamics ofPstmay provide useful information for rational deployment of resistance gene in wheat cultivars.
It is highly efficient to identify potential polymorphic markers by finding identical sequence positions and nucleotide variations of SSRs and of INDELs using whole genome re-sequencing of multiple isolates. In the present study, we identified 13,143 concordance INDELs using GATK and Samtools software across sixPstisolates from different countries. Then, 105 poly-morphic SSR markers were identifiedin silicousing proof of short tandem repeat INDELs from 1,113 SSR loci. From 84 markers generated specific bands, 82 primer pairs (97.62%) were polymorphic. In comparison, experimental testing those directly from potential markers usual-ly results in less than 20% pousual-lymorphic markers [20–24]. Therefore, the strategy used in the present study further makes the development of useful SSR markers through the approach of genome re-sequencing of multiple isolates more efficient.
In conclusion, whole genome re-sequencing of multiple isolates is efficient for the develop-ing SSR markers. Usdevelop-ing the approach, we identified 4,792 SSR loci at an average interval of 22.95 kb for the stripe rust pathogen. We developed a database containing 1,113 SSR markers and validated the polymorphisms of 82 markers using 21 isolates. The SSR markers should be useful in various studies for a better understanding of the pathogen in order to more effectively control strip rust. The approach and methods shown in this study are applicable in developing SSR markers for any other organisms.
Supporting Information
S1 Fig. Flow chart describing the main steps used to develop SSR markers inPuccinia strii-formisf. sp.tritici.
(TIF)
S2 Fig. Genomic location of 34 previously reported SSR markers with single E-PCR primer binding site.(A) Location of newly developed SSR markers within silicopolymorphic (in green color). (B) Location of 34 previously reported SSR markers (in blue color). (C) Location of newly developed SSR markers in the database containing 1,113 SSR markers (in red color; location of 14 shared loci between previously reported and newly developed SSR makers were highlighted in blue color).
(TIF)
S3 Fig. Genomic location of 23 previously reported SSR markers with two E-PCR primer binding sites.(A) Location of newly developed SSR markers within silicopolymorphic (in green color). (B) Location of 23 previously reported SSR markers (in blue color). (C) Location of newly developed SSR markers in the database containing 1,113 SSR markers (in red color). Links were used to connect the two primer binding sites of a marker.
S4 Fig. Genomic location of five previously reported SSR markers with three E-PCR primer binding sites.(A) Location of five previously reported SSR markers (in blue color); (B) Loca-tion of newly developed SSR markers in the database containing 1,113 SSR markers. Links in same color were used connect the three primer binding sites of a marker.
(TIF)
S5 Fig. SSRs indentified with INDELs called by GATK and Samtools.GATK-INDELs repre-sents the INDELs called by GATK; Samtools-INDELs reprerepre-sents INDELs called by Samtools; and SSR_Database represents the 1,113 newly developed SSR markers.
(TIF)
S1 Table. The number of SSRs in different repeat types in thePuccinia striiformisf. sp. tri-ticigenome.
(XLSX)
S2 Table. The 1,113 SSR markers within silicospecificity.Lines (font in red) indicate loci shared with the reported SSR markers.
(XLSX)
S3 Table. The 84 reported SSR markers downloaded from 4 published papers.
(XLSX)
S4 Table. E-PCR primer binding sites and genomic locations of the 84 reported SSR mark-ers.
(XLSX)
S5 Table. The 105 polymorphic SSR markers and their corresponding INDELs.
(XLSX)
S6 Table. Details of the 82 SSR markers experimentally validated in 21Puccinia striiformis f. sp.triticiisolates.Including primer sequences, annealing temperature, number of alleles, product size range (bp), polymorphic information content (PIC), observed heterozygosity (Ho) and expected heterozygosity (He).
(XLSX)
Acknowledgments
We thank Professor Xianming Chen, from Wheat Genetics, Quality, Physiology, and Disease Research Unit, USDA-ARS, and Department of Plant pathology, Washington State University, for revising this paper. We thank the anonymous reviewers for constructive comments on this manuscript.
Author Contributions
Conceived and designed the experiments: HL XW LH ZK. Performed the experiments: HL. Analyzed the data: HL. Contributed reagents/materials/analysis tools: GZ GW XZ JZ. Wrote the paper: HL XW ZK. Prepare the PST isolates: GZ GW. Contributed the preparation of re-agents and Qiagen system: JZ XZ.
References
1. Shewry PR (2009) Wheat. J Exp Bot 60: 1537–1553. doi:10.1093/jxb/erp058PMID:19386614 2. Chen W, Wellings C, Chen X, Kang Z, Liu T (2014) Wheat stripe (yellow) rust caused by Puccinia
3. Chen W, Wellings C, Chen X, Kang Z, Liu T (2013) Wheat stripe (yellow) rust caused byPuccinia strii-formisf. sp.tritici. Mol Plant Pathol 15: 433–446.
4. Kolmer JA (2005) Tracking wheat rust on a continental scale. Curr Opin Plant Biol 8: 441–449. PMID: 15922652
5. Brown JK, Hovmoller MS (2002) Aerial dispersal of pathogens on the global and continental scales and its impact on plant disease. Science 297: 537–541. PMID:12142520
6. Hovmoller MS, Yahyaoui AH, Milus EA, Justesen AF (2008) Rapid global spread of two aggressive strains of a wheat rust fungus. Mol Ecol 17: 3818–3826. doi:10.1111/j.1365-294X.2008.03886.x
PMID:18673440
7. Hovmoller MS, Sorensen CK, Walter S, Justesen AF (2011) Diversity ofPuccinia striiformison cereals and grasses. Annu Rev Phytopathol 49: 197–217. doi:10.1146/annurev-phyto-072910-095230PMID: 21599494
8. Wellings CR, McIntosh RA (1990)Puccinia striiformisf.sp.triticiin Australasia: pathogenic changes during the first 10 years. Plant Pathol 39: 316–325.
9. Bayles RA, Flath K, Hovmøller MS, Vallavieille-Pope Cd(2000) Breakdown of theYr17resistance to yellow rust of wheat in northern Europe. Agronomie 20: 805–811.
10. Ellegren H (2004) Microsatellites: simple sequences with complex evolution. Nat Rev Genet 5: 435–445.
PMID:15153996
11. Schlotterer C (1998) Genome evolution: are microsatellites really simple sequences? Curr Biol 8: R132–134. PMID:9501977
12. Sweet MJ, Scriven LA, Singleton I (2012) Microsatellites for microbiologists. Adv Appl Microbiol 81: 169–207. doi:10.1016/B978-0-12-394382-8.00005-8PMID:22958530
13. Vik U, Halvorsen R, Ohlson M, Rydgren K, Carlsen T, Korpelainen H, et al. (2012) Microsatellite mark-ers forHylocomium splendens(Hylocomiaceae). Am J Bot 99: e344–346. doi:10.3732/ajb.1200028
PMID:22922400
14. Gow JL, Tamkee P, Heggenes J, Wilson GA, Taylor EB (2011) Little impact of hatchery supplementa-tion that uses native broodstock on the genetic structure and diversity of steelhead trout revealed by a large-scale spatio-temporal microsatellite survey. Evol Appl 4: 763–782. doi:10.1111/j.1752-4571. 2011.00198.xPMID:25568021
15. Dempewolf H, Kane NC, Ostevik KL, Geleta M, Barker MS, Lai Z, et al. (2010) Establishing genomic tools and resources forGuizotia abyssinica(L.f.) Cass.-the development of a library of expressed se-quence tags, microsatellite loci, and the sequencing of its chloroplast genome. Mol Ecol Resour 10: 1048–1058. doi:10.1111/j.1755-0998.2010.02859.xPMID:21565115
16. Johansson H, Surget-Groba Y, Gow JL, Thorpe RS (2008) Development of microsatellite markers in the St Lucia anole,Anolis luciae. Mol Ecol Resour 8: 1408–1410. doi:10.1111/j.1755-0998.2008. 02206.xPMID:21586060
17. Dutech C, Enjalbert J, Fournier E, Delmotte F, Barres B, Carlier J, et al. (2007) Challenges of microsat-ellite isolation in fungi. Fungal Genet Biol 44: 933–949. PMID:17659989
18. Gow JL, Johansson H, Surget-Groba Y, Thorpe RS (2006) Ten polymorphic tetranucleotide microsatel-lite markers isolated from the Anolis roquet series of Caribbean lizards. Mol Ecol Notes 6: 873–876. 19. Gow JL, Noble LR, Rollinson D, Jones CS (2005) A high incidence of clustered microsatellite mutations
revealed by parent-offspring analysis in the African freshwater snail,Bulinus forskalii(Gastropoda, Pul-monata). Genetica 124: 77–83. PMID:16011005
20. Enjalbert J, Duan X, Giraud T, Vautrin D, de Vallavielle-Pope C, Solignac M (2002) Isolation of twelve microsatellite loci, using an enrichment protocol, in the phytopathogenic fungusPuccinia striiformisf.sp tritici. Mol Ecol Notes 2: 563–565.
21. Cheng P, Chen XM, Xu L, See D (2012) Development and characterization of expressed sequence tag-derived microsatellite markers for the wheat stripe rust fungusPuccinia striiformisf. sp.tritici. Mol Ecol Resour 12: 779–781. doi:10.1111/j.1755-0998.2012.03155.xPMID:22642264
22. Chen CQ, Zheng WM, Buchenauer H, Huang LL, Lu NH, Kang ZS (2009) Isolation of microsatellite loci from expressed sequence tag library ofPuccinia striiformisf. sptritici. Mol Ecol Resour 9: 236–238.
doi:10.1111/j.1755-0998.2008.02423.xPMID:21564613
23. Bahri B, Leconte M, de Vallavieille-Pope C, Enjalbert J (2009) Isolation of ten microsatellite loci in an EST library of the phytopathogenic fungusPuccinia striiformisf.sptritici. Conserv Genet 10: 1425–1428. 24. Bailey J, Karaoglu H., Wellings C., Park R. (2013) Isolation and characterisation of 25 genome-derived
25. Mboup M, Leconte M, Gautier A, Wan AM, Chen W, de Vallavieille-Pope C, et al. (2009) Evidence of genetic recombination in wheat yellow rust populations of a Chinese oversummering area. Fungal Genet Biol 46: 299–307. doi:10.1016/j.fgb.2008.12.007PMID:19570502
26. Rodriguez-Algaba J, Walter S, Sorensen CK, Hovmoller MS, Justesen AF (2014) Sexual structures and recombination of the wheat rust fungusPuccinia striiformisonBerberis vulgaris. Fungal Genet Biol 70: 77–85. doi:10.1016/j.fgb.2014.07.005PMID:25042987
27. Cheng P, Chen XM (2014) Virulence and molecular analyses support asexual reproduction ofPuccinia striiformisf. sp.triticiin the U.S. Pacific Northwest. Phytopathology 104: 1208–1220. doi:10.1094/ PHYTO-11-13-0314-RPMID:24779354
28. Ali S, Gautier A, Leconte M, Enjalbert J, de Vallavieille-Pope C (2011) A rapid genotyping method for an obligate fungal pathogen,Puccinia striiformisf.sp.tritici, based on DNA extraction from infected leaf and Multiplex PCR genotyping. BMC Res Notes 4: 240. doi:10.1186/1756-0500-4-240PMID:
21774816
29. Zhan G, Zhuang H, Wang F, Wei G, Huang L, Kang Z (2013) Population genetic diversity ofPuccinia striiformisf. sp.triticion different wheat varieties in Tianshui, Gansu Province. World J Microbiol Bio-technol 29: 173–181. doi:10.1007/s11274-012-1170-7PMID:23054697
30. Duan X, Tellier A, Wan A, Leconte M, de Vallavieille-Pope C, Enjalbert J (2010)Puccinia striiformisf. sp.triticipresents high diversity and recombination in the over-summering zone of Gansu, China. Mycologia 102: 44–53. PMID:20120228
31. Zhan G, Chen X, Kang Z, Huang L, Wang M, Wan A, et al. (2012) Comparative virulence phenotypes and molecular genotypes ofPuccinia striiformisf. sp.tritici, the wheat stripe rust pathogen in China and the United States. Fungal Biol 116: 643–653. doi:10.1016/j.funbio.2012.03.004PMID:22658310 32. Ali S, Gladieux P, Leconte M, Gautier A, Justesen AF, Hovmoller MS, et al. (2014) Origin, migration
routes and worldwide population genetic structure of the wheat yellow rust pathogenPuccinia striifor-misf.sp.tritici. PLoS Pathog 10: e1003903. doi:10.1371/journal.ppat.1003903PMID:24465211 33. Cantu D, Govindarajulu M, Kozik A, Wang M, Chen X, Kojima KK, et al. (2011) Next generation
se-quencing provides rapid access to the genome ofPuccinia striiformisf. sp.tritici, the causal agent of wheat stripe rust. PLoS One 6: e24230. doi:10.1371/journal.pone.0024230PMID:21909385 34. Zheng W, Huang L, Huang J, Wang X, Chen X, Zhao J, et al. (2013) High genome heterozygosity and
endemic genetic recombination in the wheat stripe rust fungus. Nat Commun 4: 2673. doi:10.1038/ ncomms3673PMID:24150273
35. Dai M, Thompson RC, Maher C, Contreras-Galindo R, Kaplan MH, Markovitz DM, et al. (2010) NGSQC: cross-platform quality analysis pipeline for deep sequencing data. BMC Genomics 11 Suppl 4: S7. doi:10.1186/1471-2164-11-S4-S7PMID:21143816
36. Cox MP, Peterson DA, Biggs PJ (2010) SolexaQA: At-a-glance quality assessment of Illumina second-generation sequencing data. BMC Bioinformatics 11: 485. doi:10.1186/1471-2105-11-485PMID:
20875133
37. Li H, Durbin R (2009) Fast and accurate short read alignment with Burrows-Wheeler transform. Bioin-formatics 25: 1754–1760. doi:10.1093/bioinformatics/btp324PMID:19451168
38. McKenna A, Hanna M, Banks E, Sivachenko A, Cibulskis K, Kernytsky A, et al. (2010) The Genome Analysis Toolkit: a MapReduce framework for analyzing next-generation DNA sequencing data. Ge-nome Res 20: 1297–1303. doi:10.1101/gr.107524.110PMID:20644199
39. Van der Auwera GA, Carneiro MO, Hartl C, Poplin R, del Angel G, Levy-Moonshine A, et al. (2013) From FastQ Data to High-Confidence Variant Calls: The Genome Analysis Toolkit Best Practices Pipe-line. Current Protocols in Bioinformatics: John Wiley & Sons, Inc. pp. 11.10.11–11.10.33.
40. DePristo MA, Banks E, Poplin R, Garimella KV, Maguire JR, Hartl C, et al. (2011) A framework for varia-tion discovery and genotyping using next-generavaria-tion DNA sequencing data. Nat Genet 43: 491–498.
doi:10.1038/ng.806PMID:21478889
41. Li H, Handsaker B, Wysoker A, Fennell T, Ruan J, Homer N, et al. (2009) The Sequence Alignment/ Map format and SAMtools. Bioinformatics 25: 2078–2079. doi:10.1093/bioinformatics/btp352PMID: 19505943
42. Shigemizu D, Fujimoto A, Akiyama S, Abe T, Nakano K, Boroevich KA, et al. (2013) A practical method to detect SNVs and indels from whole genome and exome sequencing data. Sci Rep 3: 2161. doi:10. 1038/srep02161PMID:23831772
43. Rotmistrovsky K, Jang W, Schuler GD (2004) A web server for performing electronic PCR. Nucleic Acids Res 32: W108–112. PMID:15215361
45. Winnenburg R, Urban M, Beacham A, Baldwin TK, Holland S, Lindeberg M, et al. (2008) PHI-base up-date: additions to the pathogen host interaction database. Nucleic Acids Res 36: D572–576. PMID: 17942425
46. Winnenburg R, Baldwin TK, Urban M, Rawlings C, Kohler J, Hammond-Kosack KE (2006) PHI-base: a new database for pathogen host interactions. Nucleic Acids Res 34: D459–464. PMID:16381911 47. Rohlf F (2008) NTSYSpc: Numerical Taxonomy and Multivariate Analysis System. Exeter Software,
New York. doi:10.1080/10934529.2012.645784PMID:22320688
48. Nelson RJ, Baraoidan MR, Cruz CMV, Yap IV, Leach JE, Mew TW, et al. (1994) Relationship between Phylogeny and Pathotype for the Bacterial-Blight Pathogen of Rice. Appl and Environ Microbiol 60: 3275–3283. PMID:16349380
49. Urban M, Pant R, Raghunath A, Irvine AG, Pedro H, Hammond-Kosack KE (2015) The Pathogen-Host Interactions database (PHI-base): additions and future developments. Nucleic Acids Res 43: D645–655.
doi:10.1093/nar/gku1165PMID:25414340
50. Karaoglu H, Lee CM, Meyer W (2005) Survey of simple sequence repeats in completed fungal ge-nomes. Mol Biol Evol 22: 639–649. PMID:15563717
51. Huang J, Li YZ, Du LM, Yang B, Shen FJ, Zhang HM, et al. (2015) Genome-wide survey and analysis of microsatellites in giant panda (Ailuropoda melanoleuca), with a focus on the applications of a novel microsatellite marker system. BMC Genomics 16: 61. doi:10.1186/s12864-015-1268-zPMID:
25888121
52. Cai G, Leadbetter CW, Muehlbauer MF, Molnar TJ, Hillman BI (2013) Genome-wide microsatellite iden-tification in the fungusAnisogramma anomalausing Illumina sequencing and genome assembly. PLoS One 8: e82408. doi:10.1371/journal.pone.0082408PMID:24312419
53. Xu J, Liu L, Xu Y, Chen C, Rong T, Ali F, et al. (2013) Development and characterization of simple se-quence repeat markers providing genome-wide coverage and high resolution in maize. DNA Res 20: 497–509. doi:10.1093/dnares/dst026PMID:23804557
54. Liu SR, Li WY, Long D, Hu CG, Zhang JZ (2013) Development and characterization of genomic and ex-pressed SSRs in citrus by genome-wide analysis. PLoS One 8: e75149. doi:10.1371/journal.pone. 0075149PMID:24204572
55. Metzgar D, Bytof J, Wills C (2000) Selection against frameshift mutations limits microsatellite expansion in coding DNA. Genome Res 10: 72–80. PMID:10645952
56. Hasan M, Friedt W, Pons-Kuehnemann J, Freitag NM, Link K, Snowdon RJ (2008) Association of gene-linked SSR markers to seed glucosinolate content in oilseed rape (Brassica napusssp.napus). Theor Appl Genet 116: 1035–1049. doi:10.1007/s00122-008-0733-3PMID:18322671
57. Pembleton LW, Wang J, Cogan NOI, Pryce JE, Ye G, Bandaranayake CK, et al. (2013) Candidate gene-based association genetics analysis of herbage quality traits in perennial ryegrass (Lolium per-enne L.). Crop Pasture Sci 64: 244–253.
58. Xia W, Xiao Y, Liu Z, Luo Y, Mason AS, Fan HK, et al. (2014) Development of gene-based simple se-quence repeat markers for association analysis inCocos nucifera. Mol Breeding 34: 525–535. 59. Ma HY, Jiang W, Liu P, Feng NN, Ma QQ, Ma CY, et al. (2014) Identification of Transcriptome-Derived
Microsatellite Markers and Their Association with the Growth Performance of the Mud Crab (Scylla paramamosain). Plos One 9.