Sequence Tag-Derived Simple Sequence Repeat Markers
for Ramie (
Boehmeria nivea
L. Gaud)
Touming Liu1, Siyuan Zhu1, Lili Fu1, Qingming Tang1, Yongting Yu1, Ping Chen1, Mingbao Luan1, Changbiao Wang2, Shouwei Tang1*
1Institute of Bast Fiber Crops and Center of Southern Economic Crops, Chinese Academy of Agricultural Sciences, Changsha, China,2Biotechnology Research Center, Shanxi Academy of Agricultural Sciences, Taiyuan, China
Abstract
Ramie (Boehmeria niveaL. Gaud) is one of the most important natural fiber crops, and improvement of fiber yield and
quality is the main goal in efforts to breed superior cultivars. However, efforts aimed at enhancing the understanding of ramie genetics and developing more effective breeding strategies have been hampered by the shortage of simple sequence repeat (SSR) markers. In our previous study, we had assembled de novo43,990 expressed sequence tags (ESTs). In the present study, we searched these previously assembled ESTs for SSRs and identified 1,685 ESTs (3.83%) containing 1,878 SSRs. Next, we designed 1,827 primer pairs complementary to regions flanking these SSRs, and these regions were designated as SSR markers. Among these markers, dinucleotide and trinucleotide repeat motifs were the most abundant types (36.4% and 36.3%, respectively), whereas tetranucleotide, pentanucleotide, and hexanucleotide motifs represented ,10% of the markers. The motif AG/CT was the most abundant, accounting for 28.74% of the markers. One hundred EST-SSR markers (97 EST-SSRs located in genes encoding transcription factors and 3 EST-SSRs in genes encoding cellulose synthases) were amplified using polymerase chain reaction for detecting 24 ramie varieties. Of these 100 markers, 98 markers were successfully amplified and 81 markers were polymorphic, with 2–6 alleles among the 24 varieties. Analysis of the genetic diversity of all 24 varieties revealed similarity coefficients that ranged from 0.51 to 0.80. The EST-SSRs developed in this study represent the first large-scale development of SSR markers for ramie. These SSR markers could be used for development of genetic and physical maps, quantitative trait loci mapping, genetic diversity studies, association mapping, and cultivar fingerprinting.
Citation:Liu T, Zhu S, Fu L, Tang Q, Yu Y, et al. (2013) Development and Characterization of 1,827 Expressed Sequence Tag-Derived Simple Sequence Repeat Markers for Ramie (Boehmeria niveaL. Gaud). PLoS ONE 8(4): e60346. doi:10.1371/journal.pone.0060346
Editor:Girdhar Kumar Pandey, University of Delhi South Campus, India
ReceivedOctober 8, 2012;AcceptedFebruary 25, 2013;PublishedApril 2, 2013
Copyright:ß2013 Liu et al. This is an open-access article distributed under the terms of the Creative Commons Attribution License, which permits unrestricted use, distribution, and reproduction in any medium, provided the original author and source are credited.
Funding:This work was supported by the National Natural Science Foundation of China (31101189), http://www.nsfc.gov.cn/; Natural Science Foundation of Hunan Province (10JJ3063), http://www.hnst.gov.cn/zxgz/zkjj/; National Modern Agro-industry Technology Research System (nycytx-19-E16), http://119.253.58. 231/. The funders had no role in study design, data collection and analysis, decision to publish, or preparation of the manuscript.
Competing Interests:The authors have declared that no competing interests exist. * E-mail: [email protected]
Introduction
Ramie (Boehmeria nivea), popularly called ‘‘China grass,’’ is a perennial diploid (2n = 28) herbaceous plant that belongs to the familyUrticaceae. It is one of the most important natural fiber crops. Ramie fibers, which are stripped from the stem bast, are smooth, long, and have excellent tensile strength. This high fiber quality is the major reason ramie is widely cultivated in China, India, and other Southeast Asian and Pacific Rim countries. In China, ramie is the second most important fiber crop, with its growth acreage and quantity of fiber production being second only to those of cotton.
Because of the high economic potential of ramie, high fiber yield and excellent fiber quality are the main goals in ramie breeding initiatives. However, improvement of fiber traits has been severely hindered by the poor understanding of the genetic basis of fiber traits. This limited knowledge is largely due to the lack of specific genetic maps and quantitative trait loci (QTLs) for fiber-related traits. Recently, some markers that are not specific for location, such as sequence-related amplified polymorphism (SRAP),
ran-dom amplified polymorphic DNA (RAPD), and inter simple sequence repeat (ISSR) markers, were used to analyze the genetic diversity in ramie [1–3]. However, these markers have the common shortcomings of poor repeatability and dominance. An alternative type of marker–simple sequence repeat (SSR) markers– has the following advantages: these markers are located at specific locations in the genome; they can be detected with high reproducibility; and they are multiallelic, codominant, analytically simple, and readily transferable [4,5]. Therefore, SSR markers have been widely applied in the characterization and certification of plant materials, identification of varieties with agronomic potential, genetic mapping, and in crop-breeding programs [6–9]. To date, fewer than 100 SSR markers have been identified for ramie, including the markers generated for SSR-enriched genomic libraries and the expressed sequence tags (ESTs) deposited in public databases [10,11].
from ESTs). Whereas genomic SSRs are not necessarily expected to either have genetic function or be closely linked to transcribed regions of the genome, EST-SSRs are tightly linked with functional genes that may influence certain important agronomic characters. Identification of SSRs has usually involved large-scale sequencing of the genome, the SSR-enriched parts of the genome, or EST libraries. However, this process is expensive, laborious, and time consuming. Next-generation sequencing technologies have enabled rapid identification of SSR loci derived from ESTs, which can be identified in any emergent species [12–14]. Our previous study, wherein we used sequencing andde novoassembly via Illumina paired-end sequencing, provided the first report of the ramie transcriptome [15]. The raw sequencing data from that study were deposited in the NCBI Sequence Read Archive (accession number SRA057664), and 43,990 ramie EST sequences were identified [15]. In the present study, these 43,990 ESTs were used to detect SSRs for the large-scale development and characterization of SSR markers. Development of SSR markers will facilitate genetic and genomic studies of ramie.
Materials and Methods
Plant Materials and DNA Extraction
Twenty-four ramie accessions collected from 9 provinces of China were used for the polymorphic analysis of SSR markers (Table 1). All 24 varieties were grown in the experimental fields of the Institute of Bast Fiber Crops, Chinese Academy of Agricultural Sciences, Changsha, China. Fresh leaves of each variety were collected for DNA extraction according to the cetyltrimethyl ammonium bromide (CTAB) method [16].
Identification of SSR Loci and Development of Markers
Mining for putative SSRs was performed using the AutoSSR software [17]. The default criteria were used to select a minimum of 8 repeats for dinucleotide motifs, 6 repeats for trinucleotide motifs, 5 repeats for tetranucleotide motifs, and 4 repeats for pentanucleotide and hexanucleotide motifs. The EST sequences were used to design primers flanking the putative SSRs. Input criteria for the Primer 3.0 software for designing primers [18] were as follows: length, 17–23 bp; GC content, 40–60%; and estimated amplicon size, 100–300 bp.
Classification of Cluster of Orthologous Groups (COG) Functions
All EST sequences that contained an SSR motif were classified into eukaryotic COGs categories according to the results of BLASTX searches against amino acid sequences in the COG data set (http://www.ncbi.nlm.nih.gov/COG/) [19]. These sequence similarities were judged to be significant when the E-value was less than 1E –10.
Amplification of SSR-containing Regions and Detection of Polymorphisms
One hundred SSR markers (Table S1) selected for genotyping of 24 ramie varieties were amplified as previously described [10], and the SSR assay was carried out as described by Wu and Tanksley [20].
Determination of Genetic Relationships among 24 Ramie Accessions
To assess the usefulness of the SSR primer pairs developed in this study, we analyzed the genetic relatedness among the 24 ramie accessions by using these SSR markers. The allelic data were converted into a binary matrix, with the scores 1 and 0 denoting the presence or absence of a given allele, respectively. The data were analyzed using the Numerical Taxonomy Multivariate Analysis System (NTSYS-pc) version 2.10 software [21]. Genetic similarity (GS) coefficients were calculated based on the coefficient for similarity matching by using the SIMQUAL module of the software. Using the GS matrix, we constructed a dendrogram by the unweighted pair group method with arithmetic average (UPGMA) to determine genetic relationships among the 24 genotypes.
Results
Development of SSR Markers
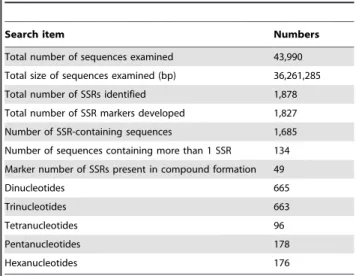
A total of 43,990 EST sequences with a total size of 36.26 Mb were used to detect SSR loci by using the AutoSSR software (Table 2); 1,878 SSR loci were identified in 1,685 of the 43,990 EST sequences (Table 2). This shows that of the 43,990 ESTs, 3.83% contained at least 1 SSR. The frequency of occurrence for EST-SSRs was 1 SSR per 19.3 kb of EST sequence. The functions of the ESTs that contained SSRs were classified
Table 1.Accessions used for diversity analysis.
Accessions Abbreviation Origin Cluster Accessions Abbreviation Origin Cluster
Qingyezhuma QZM Hainan, China I Wayaozhuma WZM Guangxi, China I
Zhongzhu 1 ZZ1 Guangxi, China I Gangza 2 GZ2 Jiangxi, China I
Hejiangqingma HQM Sichuan, China III Miaobazhuma MZM Chongqing, China I
Madarentuma MTM Hunan, China I Simaohongzhuma SZM Yunnan, China II
Bijieqingma BQM Guizhou, China I Shuiqingqingma SQM Guangxi, China II
Pingguangbaima PBM Guizhou, China II Yichuntongpichun YTC Jiangxi, China I
Hongganma HGM Guangxi, China II Yachibaima YBM Guizhou, China I
Longtanbaima LBM Sichuan, China I Rongchangzhuma RZM Chongqing, China I
Jinxiqingma JQM Guangxi, China I Qingpima QPM Sichuan, China I
Yichunjigubai YGB Jiangxi, China I Shizhuanbaiganma SBM Shanxi, China I
Boyangqingyema BYM Jiangxi, China I Liangjiangjiama LJM Sichuan, China I
Hongpi 1 HP1 Sichuan, China I Fenyiqingyema FQM Jiangxi, China I
according to COG, and 1,685 sequences were assigned to 23 COG functional categories (Figure 1). Among the 1,685 ESTs examined, 127 sequences contained 2 SSR loci, 6 sequences contained 3 SSR loci, and 1 sequence contained 4 SSR loci. In addition, 49 ESTs contained SSRs that were present in compound formation with several SSR motifs. Finally, 1,827 primer pairs complementary to sequences that flank SSR regions were designed for identifying the SSR markers (Table S2).
Characterization of SSR Markers
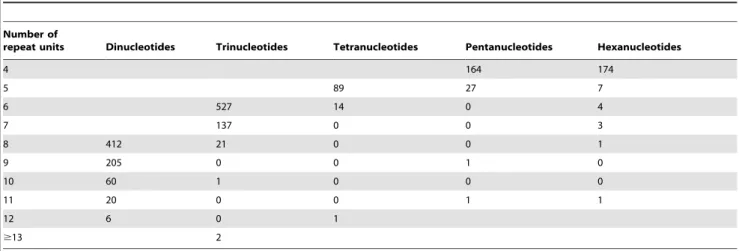
Next, we analyzed the frequencies, types, and distributions of the 1,827 SSRs amplified using the primers designed in this study. For these 1,827 markers, dinucleotide and trinucleotide repeat motifs were the most abundant types (665 [36.4%] and 663 [36.3%], respectively) (Table 2). Only 96 tetranucloetide, 178 pentanucleotide and 176 hexanucleotide SSR markers were identified (Table 2). In addition, 49 markers contained a compound motif (Table 2). The dinucleotide to hexanucleotide motifs were further analyzed to characterize the SSR length (or number of repeat units, Table 3). The lengths of most (77.6%) SSRs ranged from 16 to 20 bp, followed by those in the 21 to 24 bp length range (372 SSRs, 19.8%). Twenty-two SSRs were longer than 30 bp.
Within the developed SSR markers, 151 motif sequence types were identified. Among these, there were 3, 10, 18, 44, and 76 motifs containing dinucleotide, trinucleotide, tetranucleotide, pentanucleotide, and hexanucleotide repeats, respectively. The AG/CT dinucleotide repeat was the most abundant motif detected in the SSRs (525, 28.74%), followed by the motifs AAG/CTT (156, 8.54%), AT/TA (108, 5.91%), AAC/GTT (97, 5.31%), CCG/CGG (85, 4.65%), AC/GT (70, 3.83%), AAT/ ATT (65, 3.56%), AGG/CCT (59, 3.23%), ACC/GGT (57, 3.12%), AGC/CGT (53, 2.90%), ACG/CTG (49, 2.68%), AGT/ ATC (42, 2.30%), and ACT/ATG (33, 1.81%) (Figure 2). The remaining 131 types of motifs accounted for 24.63% of all the SSRs analyzed (Figure 2).
Analysis for Detection of Polymorphism in the SSR Markers
To assess the quality of the SSR markers for detection of 24 ramie varieties, 97 SSRs located in genes that encode transcription factors (TFs) and 3 SSRs located in genes that encode cellulose synthases (CesAs) were amplified using poly-merase chain reaction (PCR) (Table S1). Successful amplifica-tion was achieved for 98 primer pairs. Three SSRs (RAM0590, RAM0667, and RAM0818) and 1 SSR (RAM0787) were amplified at 2 and 3 loci, respectively. Among the 103 loci that were successfully amplified by the 98 SSR markers, 46, 32, 6, 1, and 1 loci had 2, 3, 4, 5, and 6 alleles, respectively, in the 24 varieties, whereas the remaining 17 loci showed no polymor-phism among the 24 ramie varieties (Figure 3). Considering 2
Figure 1. Functional classifications of ESTs that contain SSRs, based on COG searches. doi:10.1371/journal.pone.0060346.g001
Table 2.Results of searches for EST-SSRs.
Search item Numbers
Total number of sequences examined 43,990
Total size of sequences examined (bp) 36,261,285
Total number of SSRs identified 1,878
Total number of SSR markers developed 1,827
Number of SSR-containing sequences 1,685
Number of sequences containing more than 1 SSR 134
Marker number of SSRs present in compound formation 49
Dinucleotides 665
Trinucleotides 663
Tetranucleotides 96
Pentanucleotides 178
Hexanucleotides 176
varieties as a variety pair, 276 variety pairs were found among the 24 varieties. Whereas 247 variety pairs (89.5%) showed polymorphisms with the ratio ranging from 35% to 55%, 18 and 11 variety pairs (6.5% and 4.0%, respectively) showed a polymorphic ratio less than 35% and more than 55%, respectively (Figure 4). Among 276 variety pairs, the largest polymorphic ratio (62%) was observed between SZM and YTC and the smallest polymorphic ratio (27%) was observed between QZM and ZZ1 (Table S3).
Evaluation of Genetic Relationships among 24 Ramie Varieties
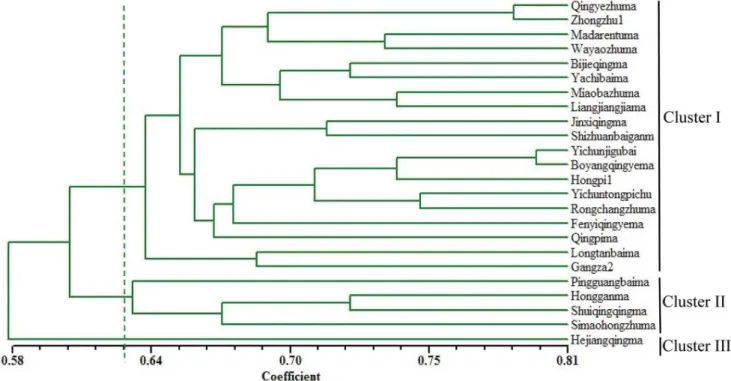
A total of 223 SSR bands from 81 polymorphic primer pairs were used to evaluate genetic diversity and relatedness among the 24 ramie genotypes. Similarity coefficients were used to examine their genetic relationships. All possible genotypes showed similarity coefficients ranging from 0.51 to 0.80. The smallest similarity coefficient (0.51) was observed between SZM and YTC, and the largest similarity coefficient (0.8) was found for 2 local varieties YGB and BYM, which originated from the Jiangxi Province, China. Taking a GS score of 0.62 as the threshold, the 24 ramie accessions could be distinctly classified into 3 clusters (Table1, Figure 5). Cluster I was the major group comprising 19 varieties and cluster II comprised 4 varieties,
PBM, HGM, SZM, and SQM. Cluster III comprised only 1
variety, HQM.
Table 3.Length distribution of EST-SSRs based on the number of repeat units.
Number of
repeat units Dinucleotides Trinucleotides Tetranucleotides Pentanucleotides Hexanucleotides
4 164 174
5 89 27 7
6 527 14 0 4
7 137 0 0 3
8 412 21 0 0 1
9 205 0 0 1 0
10 60 1 0 0 0
11 20 0 0 1 1
12 6 0 1
$13 2
doi:10.1371/journal.pone.0060346.t003
Figure 2. Frequency distribution of EST-SSRs based on motif sequence types.
doi:10.1371/journal.pone.0060346.g002
Figure 3. Distribution of the number of alleles per locus. doi:10.1371/journal.pone.0060346.g003
Discussion
Development of 1,827 EST-SSR Markers for Ramie
The current shortage of SSR markers is a major obstacle for genetic and breeding studies in ramie. Fewer than 100 SSR markers have been reported in ramie [10,11], which is far from sufficient for effective genetic mapping and marker-assisted breeding. The lack of a genetic map for ramie and the absence of QTLs for agronomically important traits have resulted in a large gap in the understanding of the genetic basis for the desirable features of ramie.
In this study, we identified 1,827 EST-SSR markers based on ramie ESTs that had been assembled in our previous transcrip-tome sequencing study [15]. A few instances of primer mismatch occurred, and in such cases, some EST-SSRs might have failed to amplify because the primers were designed across splice sites or because large introns were present within the target amplicon [13,22–24]. In order to evaluate the quality of the EST-SSR primers designed in this study, 100 SSRs were amplified, and 98 primer pairs successfully amplified their target sequences (98% success rate). Given that 100 EST-SSR markers were chosen for amplification according to the function of the gene in which the SSR was located (i.e., in a gene that encodes either a TF or CesA), and the functions of the specific genes did not influence the PCR amplification of the marker, the 98% success observed for the amplification could be extrapolated to mean that 1,827 markers can be successfully amplified using PCR. In addition, the polymorphism analysis showed that 81 of 98 SSRs had polymor-phisms with 2–6 alleles among the 24 ramie varieties. The 81 polymorphic EST-SSR markers permitted elucidation of the genetic diversity and relationships among the 24 ramie genotypes. These results suggest that the EST-SSR markers developed in this study are of excellent quality. To our knowledge, the present study represents the first successful development of SSR markers in ramie on a large scale. These markers will provide a valuable
resource for future genetic mapping, QTL analysis, comparative genetic studies, and molecular marker-assisted selection breeding (MAS).
EST-SSR Frequency and Distribution
Among 43,990 ramie ESTs, approximately 3.83% contained SSRs. This frequency is higher than those reported for grapes (2.5%) [6], flax (3.5%) [24], and barley (2.8%) [22], but lower than those reported for coffee (18.5%) [25] and wheat (7.41%) [26]. The average distance (in kb) between 2 EST-SSRs is 3.4 in rice, 5.46 in wheat, 6.3 in barley, 7.4 in soybean, 8.1 in maize, 11.1 in tomato, 13.8 inArabidopsis, 14 in poplar, 16.5 in flax, and 20 in cotton [23–27]. The observation that the 19.3-kb interval found for the ramie EST-SSRs suggests that EST-SSRs are less prevalent in ramie than in other plant species. Dinucleotide and trinucle-otide motifs were the 2 most abundant motifs (36.4% and 36.3%, respectively), and this finding was in agreement with the EST-SSR distribution that has been reported in peach, pumpkin, coffee, spruce, and kiwi fruit [25,28–31]. However, the number of EST-SSRs, the average distance between EST-EST-SSRs, and the abun-dance of dinucleotide and trinucleotide motifs are all highly dependent on the use of different SSR search criteria, the size of databases, and the database mining tool used [9,25].
AG/CT was the most abundant motif and accounted for 28.74% of all markers; this frequency was similar to that observed in sweet potato [13]. Among the trinucleotide motifs, AAG/CTT was the most abundant, with a frequency of 8.54%. Interestingly, no SSR of the GC/CG motif was detected in the 43,990 ESTs analyzed. The abundance of CCG/CGG motifs was reported to be a specific feature of monocot genomes [26]. It appears that GC-rich SSR motifs are more frequent in ESTs from monocots than in those from dicots, where AG/CT and AT/AT were the most frequent dinucleotide motifs, and CTT/AAG was the most frequent trinucleotide motif [6,24,27,29–31]. Thus, the results obtained in ramie were corroborated by other studies.
Potential Application in Ramie Breeding
Changes in the lengths of SSRs might affect gene function when the EST-SSR is located in a protein-coding region. Although trinucleotide and hexanucleotide SSRs do not cause frame shifts when present in ESTs because they are found in multiples of 3 (i.e., the number of nucleotides in a codon), the insertion or deletion of a trinucleotide and hexanucleotide motif can cause several changes in the primary structure of a protein, such as substitution, insertion, or deletion of amino acids. Moreover, the length changes due to dinucleotide, tetranucleotide, and pentanu-cleotide motifs SSRs are likely to cause frame shifts, which can disrupt the function of the protein encoded by the gene in which the SSR occurs. When genes that contain SSRs influence agronomically important characteristics, the SSR in the protein-encoding region can be developed as a functional marker for ramie breeding. Even if the EST-SSRs are located in the 59- and 39 -untranslated regions (UTRs) of any gene, these SSRs will be tightly linked with functional genes. These SSR markers will therefore be useful for selecting and pyramiding agriculturally valuable alleles in ramie MAS.
TFs play a key role in regulating gene expression at the mRNA level and regulate many biologically important processes such as progression through the cell cycle, maintenance of metabolic and physiological homeostasis, and responses to environmental stimuli
[32]. In this study, 97 EST-SSRs were found in the coding regions of TFs. Of these 97 EST-SSRs, 79 were polymorphic, with 2–6 alleles among the 24 ramie varieties analyzed (Table S1). Association analysis between EST-SSR markers and traits will probably be useful for identifying how these TFs influence agronomically important traits.
Supporting Information
Table S1 Hundred EST-SSR markers used for PCR
amplification.
(XLS)
Table S2 The information of 1827 EST-SSR markers
developed.
(XLS)
Table S3 The polymorphic ratios among 24 ramie
varieties.
(XLS)
Author Contributions
Conceived and designed the experiments: TL TS. Performed the experiments: TL LF SZ ML. Analyzed the data: TL PC CW. Contributed reagents/materials/analysis tools: QT. Wrote the paper: TL YY.
References
1. Meng Z, Liu L, Peng D (2009) Analysis on genetic diversity of ramie (Boehmeria niveaL. Gaud) wild germplasm by RAPD and ISSR markers. Mol Plant Breed 7: 365–370.
2. Liao L, Li T, Zhao Z, Chen Y, Xu L, et al. (2010) Phylogenetic relationship of ramie and its wild relatives based on SRAP markers. Guihaia 30: 791–795. 3. Qiu C, Cheng C, Zhao L, Li Y, Zang G (2011) Genetic relationship among
Boehmeria spp. revealed by RAPD. Hubei Agric Sci 50: 1499–1501. 4. Rafalski JA, Vogel IM et al. (1996) Generating and using DNA markers in
plants. In: Non mammalian, genic analysis: a practical guide. San Diego: Academic. ISBN: 0121012859, 75–135.
5. He G, Meng RH, Newman M, Gao GQ, Pittman RN, et al. (2003) Microsatellites as DNA markers in cultivated peanut (Arachis hypogaea L.). BMC Plant Biol 3: 3.
6. Scott KD, Eggler P, Seaton G, Rossetto M, Ablett EM, et al. (2000) Analysis of SSRs derived from grape ESTs. Theor Appl Genet 100: 723–726.
7. Bozhko M, Riegel R, Schubert R, Muller-Starck G (2003) A cyclophilin gene marker confirming geographical differentiation of Norway spruce populations and indicating viability response on excess soil-born salinity. Mol Ecol 12: 3147– 3155.
8. Zeng S, Xiao G, Guo J, Fei Z, Xu Y, et al. (2010) Development of a EST dataset and characterization of EST-SSRs in a traditional Chinese medicinal plant, Epimedium sagittatum(Sieb. Et Zucc.) Maxim. BMC Genomics 11: 94. 9. Varshney RK, Graner A, Sorrells ME (2005) Genic microsatellite markers in
plants: features and applications. Trends Biotechnol 23: 48–55.
10. Chen J, Luan M, Song S, Zou Z, Wang X, et al. (2011) Isolation and characterization of EST-SSRs in the Ramie. African J Microbiol Res 5: 3504– 3508.
11. Jiang Y, Jie Y, Zhou J, Xing H, She W (2007) Isolation and characterization of microsatellites from ramie [Boehmeria nivea(L.) Gaud]. ACTA Agronomica Sinica 33: 158–162.
12. Simbaqueba J, Sanchez P, Sanchez E, Nunez Zarantes VM, et al. (2011) Development and characterization of microsatellite markers for the cape gooseberryPhysalis peruviana. PLoS One 6: e26719.
13. Wang Z, Fang B, Chen J, Zhang X, Luo Z, et al. (2010)De novoassembly and characterization of root transcriptome using Illumina paired-end sequencing and development of cSSR markers in sweetpotato (Ipomoea batatas). BMC Genomics 11: 726.
14. Garg R, Patel R, Tyagi A, Jain M (2011) De Novo assembly of chickpea transcriptome using short reads for gene discovery and marker identification. DNA Res 18: 53–63.
15. Liu T, Zhu S, Tang Q, Chen P, Yu Y, et al. (2013)De novoassembly and characterization of transcriptome using Illumina paired-end sequencing and identification of CesA gene in ramie (Boehmeria nivea L. Gaud). BMC Genomics, 14: 125.
16. Murray MG, Thompson WF (1980) Rapid isolation of high molecular weight plant DNA. Nucleic Acids Res 8: 4321.
17. Wang C, Guo W, Zhang T, Li Y, Liu H (2009) AutoSSR: an improved automatic software for SSR analysis from large-scale EST sequences. Cotton Sci 2l: 243–247.
18. Rozen S, Skaletsky HJ (2000) Primer3 on the WWW for general users and for biologist programmers. In: Krawetz S, Misener S (eds) Bioinformatics methods and protocols: methods in molecular biology. Totowa: Humana Press, 365–386. 19. Tatusov RL, Fedorova ND, Jackson JD, Jacobs AR, Kiryutin B, et al. (2003) The COG database: an updated version includes eukaryotes. BMC Bioinform 4: 41–54.
20. Wu KS, Tanksley SD (1993) Abundance, polymorphism and genetic mapping of microsatellites in rice. Mol Gen Genet 241: 225–235.
21. Rohlf FJ (2002) NTSYS-pc. Numerical taxonomy and multivariate analysis system, version 2.10. Exeter Software, New York.
22. Varshney RK, Grosse I, Hahnel U, Siefken R, Prasad M, et al. (2006) Genetic mapping and BAC assignment of EST-derived SSR markers shows nonuniform distribution of genes in the barley genome. Theor Appl Genet 113: 239–250. 23. Thiel T, Michalek W, Varshney RK, Graner A (2003) Exploiting EST databases
for the development and characterization of gene-derived SSR-markers in barley (Hordeum vulgareL.). Theor Appl Genet 106: 411–422.
24. Cloutier S, Niu Z, Datla R, Duguid S (2009) Development and analysis of EST-SSRs for flax (Linum usitatissimumL.). Theor Appl Genet 119: 53–63. 25. Aggarwal RK, Hendre PS, Varshney RK, Bhat PR, Krishnakumar V, et al.
(2007) Identification, characterization and utilization of EST-derived genic microsatellite markers for genome analyses of coffee and related species. Theor Appl Genet 114: 359–372.
26. Peng JH, Lapitan NL (2005) Characterization of EST-derived microsatellites in the wheat genome and development of eSSR markers. Funct Integr Genomics 5: 80–96.
27. Cardle L, Ramsay L, Milbourne D, Macaulay M, Marshall D, et al. (2000) Computational and experimental characterization of physically clustered simple sequence repeats in plants. Genetics 156: 847–854.
28. Fraser LG, Harvey CF, Crowhurst RN, De Silva HN (2004) EST derived microsatellites fromActinidiaspecies and their potential for mapping. Theor Appl Genet 108: 1010–1016.
29. Rungis D, Berube Y, Zhang J, Ralph S, Ritland CE, et al. (2004) Robust simple sequence repeat markers for spruce (Piceaspp.) from expressed sequence tags. Theor Appl Genet 109: 1283–1294.
30. Xu Y, Ma RC, Xie H, Liu JT, Cao MQ (2004) Development of SSR markers for the phylogenetic analysis of almond trees from China and the Mediterranean region. Genome 47: 1091–1104.
31. Gong L, Stift G, Kofler R, Pachner M, Lelley T (2008) Microsatellites for the genus Cucurbita and an SSR-based genetic linkage map ofCucurbita pepoL. Theor Appl Genet 117: 37–48.