Quails / 027-032
http://dx.doi.org/10.1590/1806-9061-2015-0124
Quails
Author(s)
Bai JYI
Pang YZI
Qi YXI
Zhang XHI
Yun XYI
I College of Animal Science and Technology,
Henan University of Science and Technolo-gy, Luoyang 471003, China
Mail Address
Corresponding author e-mail address Jun Yan Bai
College of Animal Science and Technology, Henan University of Science and Technology, Luoyang 471003, China Email: [email protected]
Keywords
Chinese yellow quail, EST-SSR, Bioinformatics,Genetic diversity.
Submitted: August/2015 Approved: November/2015
ABSTRACT
Aiming at accelerating the application of molecular markers in the genetic improvement of quails, six EST-SSR markers were successfully developed using a bioinformatics method. Polymorphisms of three quail populations (Chinese yellow quail, China black quail and Korean quail) were detected. The results showed that there were 2-6 alleles in six EST-SSR markers. Mean polymorphism information contents of Chinese yellow quails, Chinese black quails and Korean quails were determined as 0.5451, 0.4962 and 0.4937, respectively. Average heterozygosity valuesof 0.6134, 0.5759 and 0.5613 were calculated. Among the six EST-SSR markers, three were highly polymorphic, and the other three were moderately polymorphic. The newly-developed six EST-SSR markers may be used to determine the genetic diversity of quails. The six EST-SSR markers identified were related to carbohydrate metabolism and melanin synthesis, but their specific mechanisms need to be further analyzed.
INTRODUCTION
Expressed Sequence Tag-Simple Sequence Repeat (EST-SSR)is a new type molecular marker developed on the basis of expression sequence by microsatellites. EST-SSR technology avoids the tedious steps of constructed genomic DNA library in the SSR development process. It can provide the absolute marker for gene function and fully reflect the similarity degree of the genomic functional area. Its polymorphism can better explain the phenotypic differences. The universality of SSR derived from traditional genomes is very poor between the species. As a part of genes, EST-SSR flanking sequences are highly conserved between species, and therefore, EST-SSR primers can be commonly usedamong species.Therefore, EST sequences are valuable resources for the development of SSR markers. In recent years, as a cnsequence of comprehensive and deep research in different species, a great number of ESTs is accumulated.
The objective of this study were to develop quail EST-SSR markers by bioinformatics methods, and to detect EST-SSR marker polymorphism in three quail populations, which can provide a new marker and theoretical basis for developing quail genetic diversity research, new strain identification, and evaluation and utilization of genetic resources.
MATERIALS AND METHODS
Materials
Seventy-five Chinese black quails, 75 Chinese yellow quails, and 75 Korean quails were randomly chosen on the experimental pasture of Henan University of Science and Technology.
Two mL of blood were collected from the heart. Acid citrate dextrose solution (ACD) was used as anticoagulation agent (blood:ACD=6:1). The sample was preserved at -20ºC in the refrigerator until analyses.
EST-SSR screening
Firstly, all nucleic acid sequences and EST sequences were retrieved from NCBI public database GenBank athttp://www.ncb.inlm.nih.gov/. Then, the microsatellites were searched from these quail sequences using the microsatellite on-line search tool SSRIT athttp://www.gramene.org/db/searches/ssrtool. Finally, the homologous sequences of microsatellite markers were compared according to http://blas.tncb. inlm.nih.gov /Blas.tcgi.
Primers
The following primer design criteria were applied: EST sequence longer than 100bp; the start and terminalends of SSR sequences with not less than 20 BP from 5’ and 3’ ends respectively; primer GC content of 40%~60%, and annealing temperature of 55~56ºC. These criteria were applied avoid primer dimer hairpin structure, mispairing, and continuous 6-base pairing as much as possible.
Polymorphism detection
Microsatelliteprimers were synthesized by Shanghai Sangon Biological Engineering Technology Co. The primer sequences are shown in Table 1.The total size of the PCR reaction system was 12.5μL, including 8.65μL of ddH2O, 1.25μL of 10×buffer, 0.75μL of Mg2+(25
mmol/L), 0.5μL of DNA template, 0.5μL (10 mmol/L) of upstream and downstream primers, 0.25μL of dNTPs, and 0.1μL of Taq enzyme. The PCR amplification process was as follows: denaturation for 3 min at 95°C,
denaturation for 45 s at 94°C, annealing for 60s at X°C, extension for 60s at 72°C, and 30 cycles, extension for 12 min at 72°C, and preserving at 4°C. The annealing temperature is shown in Table 1. The PCR products were processedusing 10% native polyacrylamide gel electrophoresis for 6~8h under stable voltage of 150~180V, and then fixed for silver nitrate staining, development, and other processes. Finally, imaging was performed using a gel imaging system andand the Excel Microsatellite Toolkit was used to calculate the allele frequency and size range. The polymorphic information content (PIC), heterozygosity (He), and effective amount of alleles (Ne) were calculated using Dispan Software (Ota, 1993).
RESULTS
In total, 120 EST-SSR markers were discovered in the published EST quail sequences. The detection rate was 18.9%. The dinucleotide repeat motif, trinucleotide repeat motif, pentanucleotide repeat motif and tetranucleotide repeat motif accounted for 40.0%, 35.8%, 14.2% and 10.0% of the 120 EST-SSR markers, respectively. The hexanucleotide repeat motif EST-SSR was not discovered. Ten eligible EST-SSR markers were selected for primer design and primer sequence syntheses in 120 EST-SSRs (Table 1).
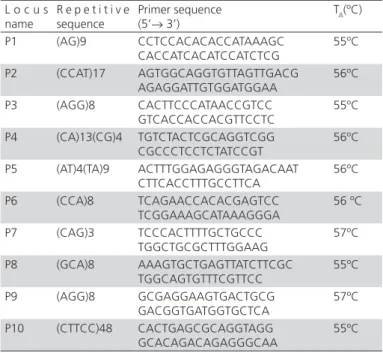
Table 1 – Relational information for microsatellite locus
L o c u s name
R e p e t i t i v e sequence
Primer sequence (5’→ 3’)
TA(ºC)
P1 (AG)9 CCTCCACACACCATAAAGC CACCATCACATCCATCTCG
55ºC
P2 (CCAT)17 AGTGGCAGGTGTTAGTTGACG AGAGGATTGTGGATGGAA
56ºC
P3 (AGG)8 CACTTCCCATAACCGTCC GTCACCACCACGTTCCTC
55ºC
P4 (CA)13(CG)4 TGTCTACTCGCAGGTCGG CGCCCTCCTCTATCCGT
56ºC
P5 (AT)4(TA)9 ACTTTGGAGAGGGTAGACAAT CTTCACCTTTGCCTTCA
56ºC
P6 (CCA)8 TCAGAACCACACGAGTCC TCGGAAAGCATAAAGGGA
56 ºC
P7 (CAG)3 TCCCACTTTTGCTGCCC TGGCTGCGCTTTGGAAG
57ºC
P8 (GCA)8 AAAGTGCTGAGTTATCTTCGC TGGCAGTGTTTCGTTCC
55ºC
P9 (AGG)8 GCGAGGAAGTGACTGCG GACGGTGATGGTGCTCA
57ºC
P10 (CTTCC)48 CACTGAGCGCAGGTAGG GCACAGACAGAGGGCAA
55ºC
of P2 and P3 in quail populationsare shown in Figure 1 and Figure 2, respectively. As shown in Figure 1 and Figure 2, EST-SSR markers presented polymorphism in the quail populations. Polymorphisms of six EST-SSR markers (P1, P2, P3, P4, P5 and P6) were detected in the three evaluated quail populations. Polymorphism was not detected in the other markers.
Figure 1 – Electrophoresis of EST-SSR markers P2 in Chinese black quail
Figure 2 – Electrophoresis of EST-SSR markers P3 in Chinese yellow quail
There were few alleles in which all six EST-SSR markers were detected inChinese yellow quail, Chinese black quail and Korean quail populations. P2 detected the most alleles (6) while P4 and P6 detected the least (2). The mean polymorphism information contents of the six EST-SSR markers in Chinese yellow quail, China black quail and Korean quails were 0.5451, 0.4962, and 0.4937, respectivelt. The mean heterozygosity values were 0.6134, 0.5759 and 0.5613, respectively. The polymorphism information content and the heterozygosity value of Chinese yellow quails were slightly higher than those of the other two quail populations, suggesting that the genetic diversity of Chinese yellow quailsis more abundant. The Hardy-Weinberg equilibrium test showed that the six EST-SSR markers in the three evaluated quail populations deviated significantly from the Hardy-Weinberg law (p<0.01).
Table 2 – Polymorphism information content(PIC) of microsatellite loci
Populations Locus name
Number of alleles locus(Na)
Effective number of alleles (Ne)
Obs. Hom.
Obs. Het.
Exp. Hom.
Exp. Het.
Polymorphism information content(PIC)
Chi-square
Chinese yellow quails
P1 5 3.7520 0.0500 0.9500 0.2604 0.7396 0.6872 52.1835** P2 6 4.7904 0.1333 0.8667 0.2021 0.7979 0.7605 69.3262** P3 4 2.0815 0.6833 0.3167 0.4761 0.5239 0.4779 60.2635** P4 2 1.9651 0.1333 0.8667 0.5048 0.4952 0.3705 34.3432** P5 6 3.1386 0.3167 0.6833 0.3129 0.6871 0.6356 105.9782** P6 2 1.7630 1.0000 0.0000 0.5636 0.4364 0.3391 61.3426** Mean 4.1667 2.9151 0.3861 0.6139 0.3866 0.6134 0.5451
Chinese black quails
P1 5 3.4918 0.3636 0.6364 0.2809 0.7191 0.6606 166.9113** P2 6 3.4476 0.2576 0.7424 0.2846 0.7154 0.6680 76.2231** P3 4 2.2264 0.9848 0.0152 0.4449 0.5551 0.4540 272.4943** P4 2 1.9551 0.1515 0.8485 0.5077 0.4923 0.3692 35.1228** P5 6 2.2541 0.4545 0.5455 0.4394 0.5606 0.4996 37.6175** P6 2 1.6949 1.0000 0.0000 0.5869 0.4131 0.3260 67.4745** Mean 4.1667 2.5117 0.5354 0.4646 0.4241 0.5759 0.4962
Korean quails P1 4 2.3000 0.2800 0.7200 0.4287 0.5713 0.4982 47.9561** P2 6 2.9727 0.7400 0.2600 0.3297 0.6703 0.6098 93.3910** P3 5 3.5186 0.8800 0.1200 0.2770 0.7230 0.6669 166.4048** P4 2 1.9802 0.1000 0.9000 0.5000 0.5000 0.3725 32.6666** P5 5 3.1526 0.3200 0.6800 0.3101 0.6897 0.6260 89.2602** P6 2 1.2677 1.0000 0.0000 0.7867 0.2133 0.1889 54.0689** Mean 4 2.5323 0.5533 0.4467 0.4387 0.5613 0.4937
Table 3 – Genetic differentiation coefficient (Gst) of microsatellite loci
Locus name Total population average heterozygosity(Ht)
Average heterozygosity of different
quail populations(Hs) Genetic differentiation coefficient(Gst)
P1 0.7321 0.6767 0.0757
P2 0.7850 0.7279 0.0728
P3 0.6259 0.6007 0.0403
P4 0.4929 0.4958 -0.0060
P5 0.6949 0.6458 0.0707
P6 0.3761 0.3543 0.0581
The genetic differentiation coefficient, total population heterozygosity, and subpopulation heterozygosity of six EST-SSR markers in the three quail populations are shown in Table 3. As seen in Table 3, the microsatellite locus with highest heterozygosity was P2 in the total population (0.7850) and P6 presented the lowest (0.3761). The average heterozygosity of three subpopulations Chinese black quail, Chinese yellow quail and Korean quail was 0.5835. The total average heterozygosity was 0.6178. The inter-population genetic differentiation coefficient was 0.0519, which means that inter-population genetic variation accounted for 5.19% of the total genetic variation. This indicates that the inter-population genetic variation accounting for the total genetic variation was low and the differentiation degree among the three quail populations was small.
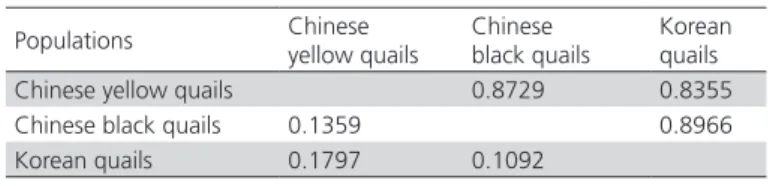
Table 4 shows that the minimum genetic distance between Chinese black quails and Korean quails is 0.1092, suggesting that Chinese black quails and Korean quailspresent the closest relationship. The genetic distance between Chinese yellow quails and Korean quails was larger, with 0.1359. As shown in Figure 1, Chinese black quails are closer to Korean quails than to Chinese yellow quail.
Table 4 – genetic distance and similarity coefficient
Populations Chinese yellow quails
Chinese black quails
Korean quails Chinese yellow quails 0.8729 0.8355 Chinese black quails 0.1359 0.8966 Korean quails 0.1797 0.1092
Nei’s genetic identity (above diagonal) and genetic distance (below diagonal).
DISCUSSION
The microsatellite polymorphism derived from the variation of the core sequence repetitive number. Generally speaking, the more the repetitive number, the bigger the variation, the higher the number of alleles at this locus and the stronger is the polymorphism. For the microsatellite with the same repeat unit, the repetitive number of mammalian microsatellite is generally higher than that of poultry. For example, the repetitive number of the TG microsatellite is only 4~14 in poultry, but more than 20 in mammals (human and mouse) in general. The polymorphism provided by microsatellite markers in mammals is also very high, which is also the advantage of microsatellite markers. Six EST-SSR markers were firstly developed in three quail populations of Chinese black quails, Chinese yellow quails, and Korean quails in this study. The
average number of EST-SSR alleles in the above three quail populations were 4.1667, 4.1667, and 4.000, respectively. The average number of effective alleles were 2.5117, 2.9151, and 2.5323, respectively. The average number of alleles and effective alleles of quail EST-SSR were higher than those of shrimp, developed by Zhang et al. (2010), who obtained 2.4000±0.5477 alleles and 2.0600±0.3287effective alleles, but lower than that of sheep (3.4266), as determined by Wang et al. (2011a). In the present study, except for P6, which was lowly polymorphic, the other five EST-SSR markers were moderately or highly polymorphic in the three quail populations, suggesting that the six newly developed EST-SSR markers may be used as a new molecular marker and are suitable to analyze the genetic diversity of quail populations.
As a part of functional gene, the variation of EST-SSR markers may be correlated with phenotypic traits, which make them valuable for the development of functional markers. Zhang et al. (2014) analyzed the correlation between six EST-SSR markers and litter size and birth weight in sheep. The results showed that the locus 114719418 was correlated with the average lamb birth weight and birth weight; 114720463 and 114758122 loci were correlated with total lamb birth weight and litter size, respectively; 114719622 and 114722561 loci were correlated with the total birth weight; and 47952182 locus was correlated with litter size. The EST-SSR marker loci may be closely linked with the control of the sheep birth weight and litter. The study of Wang et al. (2011b) showed sheep EST-SSR markers locus 33176918 and locus 33176988 had a significant genetic effect on wool natural length and average fiber diameter, respectively (p<0.05). These two loci may be closely linked with the control of wool traits loci.
The comparison between thesix EST-SSR markers developed in the present study with the NCBI website showed that EST-SSR marker P1 and quail melanocortin 4 receptor (MC4R) genes are homologous; P2 and transcription factor Fli are homologous; P3 and GAA1 (acid a-glucosidase) genes are homologous; P4 and TOJ3 genes are homologous; P5 and Brn-1 genes were homologous (1, 2, 8-trihydroxynaphthalene reductase gene); and P6 and aspartic acid are homologous. Therefore, it is speculated that these six EST-SSR markers are related to carbohydrate metabolism and melanin synthesis in quails, but the specific mechanismsstill needs to be further analyzed.
of EST-SSR markers, and therefore these markers have been extensively studied and widely applied. At present, the research on quailsis not well-developed in China compared with other livestock and poultry; in particular, the research on molecular genetic markers is still at the initial stage. The advantages of the use of EST-SSR in genomics are obvious. With the implementation of animal, plant, and other model organism genome projects, studies on functional genomics will be the next focus of research. Although the technique of EST-SSR markers has just started to develop, research using this tool is still at the initial stage, and its range of application is still relatively limited, it has received widespread attention from the scientific community.
ACKNOWLEDGEMENTS
This research was supported by a research cooperation project of Henan Province (2015HNCXY012 ).
REFERENCES
Eujayi T, Sorrells ME, Baum MI. Isolation of EST derived microsatellite markers for genotyping the A and B genomes of wheat. Theoretical and Applied Genetics 2002;104:399-407.
Feng FJ, Li XL, Wang JT, Tang CJ, Wang HL. Bioinformatics analysis of EST segment from goat. China Journal of Bioinformatics 2008;6(1):14-17.
Ju ZL, Wefts MC, Martinez A, Hazlewood L, Walter RB. An in silico mining for simple sequence repeats from expressed sdtquenee tags of zebrafish, medaka. Fundulus, and xiphophorus. In Silico Biology 2005;51:439-453.
Mi Z , Li AX, Ruan CL, Li GN, Du WH, Long YH, et al. Searching and analysis of EST-SSR markers from linkage group 12 of the silkworm Bombyx mori. Acta Entomologica Sinica 2011;54(11):1223-1230.
Ota T. DISPAN: Genetic distance and phylogenetic analysis. State College: Pennsylvania State University; 1993. Available from: http://evolution. genetics.washington.edu/phylip/software.dist.html#DISPAN.
Pen JH, Lapitan N. Characterization of EST-derivedmicro—satellites in the wheat genome and development of SSR markers. Functional & Integrative Genomics 2005;5:80-86.
Perez F, Ortiz J, Zhinaula M, Gonzabay M, Caldéron J, Volckaert FAMJ. Development of EST-SSR markers by data mining in three species of shrimp: topenaeu vanname Litopenaeus tylirostris and Treehypennons birdy. Marine Biotechnology 2005;7:554-565.
Serapion J, Kucuktas H, Feng J, Lui Z. Bioinformatle miring of type I microsatelbtes from expressed sequence tags of channel catfish. Marine Biotechnology 2004;613:54-377.
Thie T, Michalek WT, Varshney K, Graner A. Exploiting EST data bases for the development and characterizatlon of gene-defived SSR-rnarkers in barley (Hordeum vuggare L.)[J]. Theoretical and Applied Genetics 2003;106:411-422.
Wang ZB, Nuerli A, Zhao ZS, Zeng XC, Zhang WX. genetics analyses to three breeds of sheep in xinjiang with EST-SSR polymorphic. Research of Agricultural Modernization 2010;31(2):233-236.
Wang ZB, Zhao ZS, Yu P, Wu HB, Ban Q, Liang YW, et al. The gene ontology and electro localization of ovine skin derived EST-SSR markers. Hereditas 2011a;33(7):731-737.
Wang ZB, Zhao ZS, Wu HB, Yu P, Zhang WX, Zeng XC. Correlation analysis of ovine skin derived EST-SSR markers with wool traits. Journal of Agricultural Biotechnology 2011b;19(6):1056-1062.
Yan QL, Zhang YH, Li HB, Wei CH, Du LX. Analysts of microsatell ite markers from sheep unigene. Journal of Northwest A F University 2007;35(11):15-18.
Zhang Q. Correlation analysis vannamei EST-SSR genetic polymorphism and growth traits [thesis]. Xianyang (CN): Northwest Agriculture and Forestry University; 2010.
Zhang WX, Wang ZB, Zhao ZS, Li DQ, Jia B, Nuerli A. Correlation analysis of ovine brain and ovary derived EST-SSR markers with litter size and birth weight. Acta Veterinaria et Zootechnica Sinica 2014;45(7):1084-1090.