Crop Breeding and Applied Biotechnology 7: 242-252, 2007
Brazilian Society of Plant Breeding. Printed in Brazil
Received 22 September 2006
Accepted 10 May 2007
ABSTRACT - The Andean blackberry belongs to the genus Rubus, the largest of the Rosaceae family and one of the most diverse of the plant kingdom. In Colombia Rubus glaucus Benth, known as the Andean raspberry or blackberry, is one of the nine edible of the genus out of forty-four reported species. In this study wild and cultivated genotypes, collected in the Central Andes of Colombia were analyzed by AFLP and SSR markers. Sexual reproduction seems to play an important role in maintaining the genetic variability in R. glaucus, and the viability of using the SSR of Rubus alceifolius to characterize Colombian Rubus species was clearly demonstrated. All species evaluated produced very specific banding patterns, differentiating them from the others. Both AFLP and SSR produced bands exclusive to each of the following species: R. robustus, R. urticifolius, R. glaucus, and R. rosifolius. The SSR markers differentiated diploid and tetraploid genotypes of R. glaucus.
Key words: AFLP, SSR, genetic diversity, Rubus spp.
Genetic diversity of wild and cultivated
Rubus s
pecies
in Colombia using AFLP and SSR markers
Marta Leonor Marulanda1*, Ana María López1, and Sandra Bibiana Aguilar1
INTRODUCTION
The Colombian and Ecuadorian Andes are the natural habitat of the Rubus genus, with almost 700 species the largest of the Roseaceae family and one of the most diverse of the plant kingdom (Romoleroux 1992). The ploidy level of this interesting group of plants ranges from diploid to dodecaploid, mostly apomictic and highly heterozygous.
Rubus has been divided into 12 subgenera of which only few species have been domesticated. The subgenus Idaeobatus contains the “raspberries” that are distributed in the Northern Hemisphere, mainly Asia, Africa, Europe, and North America; the subgenus Rubus includes species found in Europe, Asia, and North America, whereas the subgenus Orobatus is exclusive to South America. Representatives of the subgenera
Rubus, Orobatus, and Idaeobatus are found in the Colombian and Ecuadorian Andes (Ballington et al. 1993).
Rubus has spread over the tropical highlands, usually at over 800 meters above sea level. Rubus glaucus fruits are produced from Mexico to Ecuador; they are consumed fresh and processed for products such as jellies and beverages. Also known as the Andean blackberry, this species is widely distributed in the three Cordilleras of Colombia and combines traits of the
subgenera Idaeobatus and Rubus. It is a fertile
amphidiploid or allotetraploid, originated by the genome fusion of two species (Ballington et al. 1993, Jennings 1988). Rubus glaucus is the only native species of the genus used for commercial production in Colombia (Ballington et al. 1993). Rubus has a wide altitudinal
and geographical distribution in Colombia. Vargas (2002) reports six species: R. bogotensis, R. glaucus, R. macrocarpus, R. nubigenus, R. porphyromallus, and R. urticaefolius. Romoleroux (1992) further mentions the existence of nine edible species in Colombia of the 44 species reported. Due to natural crosses, up to 500 varieties can be identified.
In the areas where Rubus species are grown, wild species are found in areas of secondary growth, forest margins, and along roadsides. Cultivated and wild plants have the potential to interact in several ways. Cultivars can influence the genetic diversity of natural populations through gene loss and transfer by pollen. Wild populations can also serve as host plants of pests and their natural predators. Additionally, wild populations are also a potential source of breeding material for improvement programs (Graham et al. 1997b). However, very little information is available on the nature and extent of the interactions and relationships between wild and cultivated populations of Rubus species (Graham et al. 1977b).
Studies on the genetic diversity of temperate Rubus species have been carried out, such as R. idaeus (Parent and Fortin 1993, Graham and Mcnicol 1995, Graham et al. 1997b) and R. occidentalis (Parent and Page 1998), as well as Asian species (Amsellem et al. 2000). These studies used RAPD (Random Amplified Polymorphic DNA), RFLP (Restriction Fragment Lenght polymorphism), and SCAR (Sequence Characterized Amplified Region) markers as well as SSR (Single Sequence Repeats) (Antonius-Klemola 1999). Hybrids of R. idaeus and R. caesius were also studied using Internal Transcribed Spacer (ITS) markers (Alice et al. 1997), this markers made it possible to confirm the genetic origin of the hybrids and to further phylogenetic and evolutionary studies in Rubus (Alice 2002). Major advances have recently been made by using molecular markers in temperate Rubus species, i.e., DNA fingerprinting, genotype characterization, development of linkage maps, use of marker-assisted selection, and QTL (Quantitative Trait Loci) mapping (Antonius-Klemola 1999, Graham et al. 2002).
This paper reports the results of a molecular analysis carried out with AFLP and SSR (simple sequence repeat) markers of wild and cultivated Rubus species collected in the Central Andes of Colombia. Strategies were established for the sustainable use and conservation of genetic resources of Rubus glaucus
and related wild species, generating information on the current status of populations, their uses and distribution, as well as other data considered indispensable to launch an improvement program for R. glaucus.
MATERIAL AND METHODS
Plant material and DNA extraction
Fifty-one samples of cultivated and wild Rubus species were analyzed collected from 27 localities in Caldas, Quindío and Risaralda (departments in the Central Andes of Colombia, at altitudes between 1511 and 2851 m asl). Plants of the following species were analyzed: R. glaucus (27), R. adenotrichos (1), R. bogotensis (1), R. robustus, (4), R. rosifolius, (3), and R. urticifolius (15). Total genomic DNA was isolated according to the protocol described by Doyle and Doyle (1990).
Analysis with AFLP markers
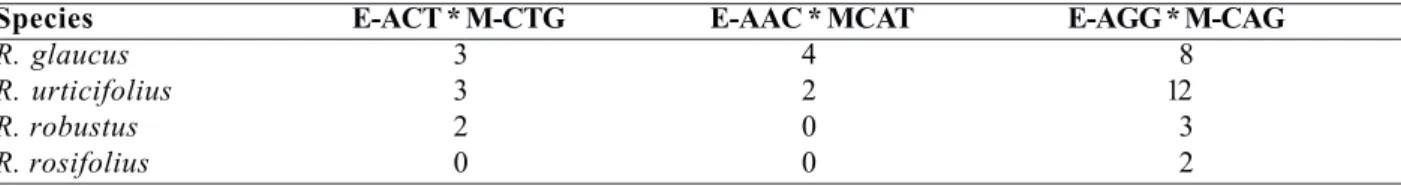
The AFLP Analysis System I Kit (Invitrogen, Carlsbad, CA, USA) (Vos et al. 1995) was used for the AFLP analysis, and PCR products were electrophorized under denaturing conditions in 6% acrylamide gels (containing 7 M urea), which were silver-stained, according to the procedure described by Bassam et al. (1991). The primer-enzyme combinations with highest polymorphism were E-AGG * MCAG, E-ACT * M-CTG, and E-AAC * M-CAT (Table 1).
AFLP and SSR products were scored qualitatively (Ghosh et al. 1997). Only clear and apparently unambiguous bands were scored for AFLP and SSR. Groups of genetic diversity were determined by calculating the genetic similarity (GSij) between each genotype pair by the formulas of Dice (1945) and Nei and Li (1979), based on the proportion of shared alleles using the subprogram simqual of the NTSYS-pc version 2.02i (Rohlf 1989). The resulting distance matrix data were used to construct the dendrogram using the Unweighted Pair-Group Method with Arithmetic Mean (UPGMA), NTSys subprogram (Rohlf 1993).
SSR analysis
results described by Amsellem et al. (2001) (Table 2). Amplification reactions were performed in a final
volume of 25 ml, with 5 ng genomic DNA, 0.3 mM of
each primer, 1X reaction buffer (10 mM Tri-HCl, pH 8.3,
50 mM KCl), 200 mM of each of the dNTP, 2 mM MgCl2
and 1.0 unit of Amplitaq DNA polymerase. The allelic diversity of the SSR was evaluated by determining the polymorphism information content (PIC) value, as described by Bonstein et al. (1980) and cited and modified by Anderson et al. (1993), as expressed below:
Where Pij is the frequency of the jth pattern, i is the sum, and n are the patterns. The test of Mantel (Mantel 1967) was used to correlate the matrixes.
To measure the utility of the marker systems, the mean heterozygosity, expected and observed heterozygosity (Weir and Cockerham 1984) and FST-values (Wright’s fixation index, Brown and Weir, 1983), were calculated using ARLEQUIN version 3.1 (Excoffier et al. 2006) with significances based on a permutation process. The genetic variation within and among the formed groups was determined by analysis of molecular variance (AMOVA) using SSR markers (Excoffier et al. 2006) with the same software.
RESULTS AND DISCUSSION
The DNA fingerprinting database was prepared using the two different PCR-based markers (SSR and AFLP) systems for 51 Rubus samples.
Genetic variability detected by AFLP markers
A total of 229 bands were obtained with the three primer-enzyme combinations evaluated. The band size ranged between 30 to 330 base pairs (Table 1), and 91.6% polymorphism was obtained.
The genetic groupings and distances that produced the polymorphic bands are shown in the dendrogram (Figure 1), which differentiates six similarity groups. When compared with other species species R. bogotensis (34), group 6 of the dendogram, stood out as well as several individuals (genotypes 42, groupe3; genotype 5, groupe 4; and genotype 45, group 6) because of large differences. Two main groups were formed, with 28% similarity. A first group (1) consisted of R. urticifolius plants (genotypes 3, 103, 107, 67, 37, 55, 82, 47, 79, and 52), R. glaucus (genotypes 35, 90, 87, 99, 101, 7, 22, and 10), R. robustus (genotypes 18 and 33), R. adenotrichos 85, and R. rosifolius 63.
A second group (2) contained three R. glaucus plants (genotypes 3, 13, and 18) with one of R. robustus (88) separated from the main group. The rest of the group comprised mainly R. glaucus plants (genotypes 9, 54, 100, 80, 46, 83, 102, 86, 95, 97, 50, 65, 21, and 5) with higher similarity indices (50 and 100%). The species R. urticifolius was also represented (genotypes 41, 107, 68, 64, and 44) as well as R. rosifolius (32 and 59) and R. robustus (36).
The lowest similarity values, however, were found in the first group (1). The highest similarity indexes in the second group (2) were observed between R. urticifolius 107 and R. glaucus 100 (70%), R. glaucus 54 and R. robustus 36 (90%), R. glaucus 83 and R. rosifolius 59 (95%), R. glaucus 9 and R. urticifolius 41 (70%), and R. urticifolius 68 and R. glaucus 83 (80%). The results of this study are similar to those reported by Kollmann et al. (2000), who studied the influence of reproduction on the variability of European Rubus species, using AFLP markers.
Kollmann et al. (2000) concluded that genetic variability in Rubus is determined by the plant propagation system and demonstrated that there is an effect of cross-pollination between polyploid Rubus species. This type of crossbreeding influences seed and
Table 1. Number of polymorphic bands obtained per primer combination, with AFLP
Enzyme-primer Number of total Number of polymorphic
Polymorphism (%) combinations bands bands
E-ACT * M-CTG 89 819 1.011
E-AAC * MCAT 75 648 5.333
E-AGG * M-CAG 65 649 8.461
Tota l2 292 09
fruit quality positively, whilst increasing the ploidy levels and taxonomic proximity.
This phenomenon could also occur with Rubus species in the Central Andes of Colombia and may explain the very high similarity indexes observed between different species such as R. urticifolius and R. glaucus, R. glaucus and R. robustus, and R. rosifolius and R. robustus, which belong to different subgenera, and between R. glaucus and R. rosifolius, which belong to the same subgenera. In cases of very high similarities between different individuals of R. glaucus with individuals of other species, such as R. robustus and R. urticifolius, these genotypes could be hybrids between both species or share a common ancestor, as reported by Kollmann et al. (2000) in pollination studies with R. armeniacus. Hybridization in Rubus occurs mostly between closely related species and, in some instances, between subgenera (Gustafsson 1942, Jennings 1978, Weber 1995, Alice et al. 1997, Alice and Campell 1999). AFLP markers also produced several bands or private alleles, which were exclusive to each species and serve to quickly identify genotypes or interspecific hybrids of interest in the early stages of an improvement program (Table 3).
Genetic variability with SSR markers
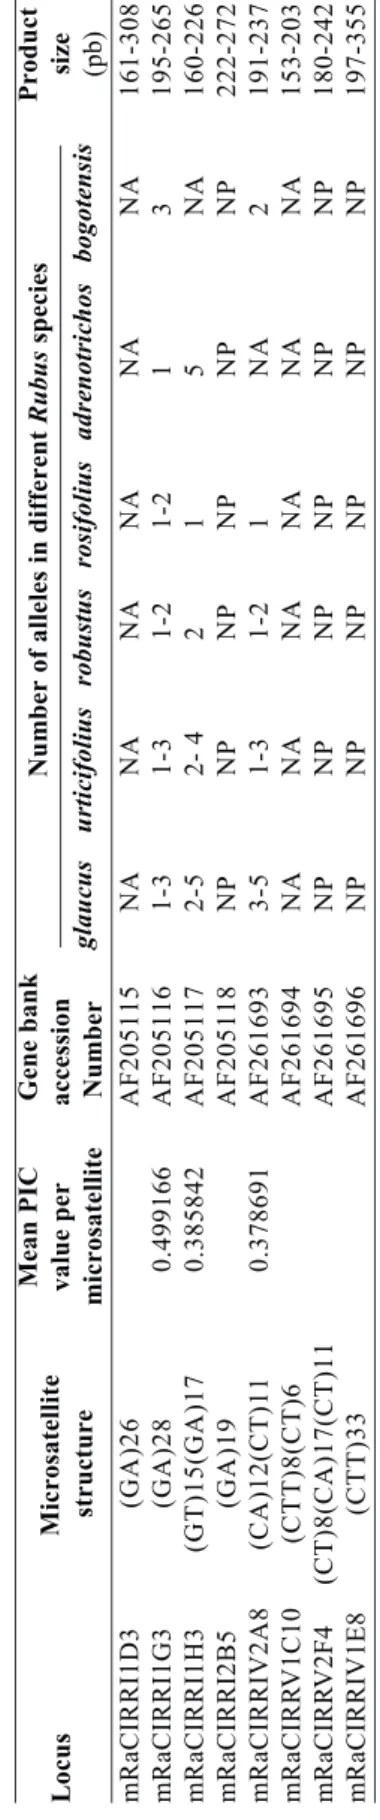
Twenty loci and positive amplification were obtained with the following SSR markers: mRaCIRRI1H3, mRaCIRRI1G3, mRaCIRRI2B5, mRaCIRRIV2A8, mRaCIRRV2F4, and mRaCIRRIV1E8. Amplification was not positive with the following markers: mRaCIRRI1D3 and mRaCIRRV1C10. SSRs with highest polymorphism were mRaCIRRI1H3, mRaCIRRI1G3, and mRaCIRRIV2A8 (Table 2). A mean of 8.167 polymorphic loci per primer were detected, out of the 20 total loci. The number of polymorphic bands was highest in R. urticifolius with 16, followed by R. glaucus with 14, R. robustus with 13, and R. rosifolius with 6 (Table 4).
The bands obtained were similar in weight and number to those obtained by Amsellem et al. (2001) in Asian species. SSR also made it possible to differentiate groups within R. glaucus (intraspecific variability) as well as between Rubus species (interspecific variability). Seven private or exclusive alleles were detected for several subgenera, providing a molecular profile for genotypes based on their banding pattern. Amsellem et al. (2000) observed the amplification of three to four
T
able 2
.
SSR loci and primers used in
Rubus
species and respective number of alleles, product size and PIC (Polymorphic Information Content)
Locus
Microsatellite
Mean PIC Gene bank
Number of alleles in different
Rubus
species
Product
structure
value per accession
glaucus urticifolius robustus rosifolius adrenotrichos bogotensis
size
microsatellite Number
(pb) mRaCIRRI1D3 (GA)26 AF205115 NA NA NA NA NA NA 161-308 mRaCIRRI1G3 (GA)28 0.499166 AF205116 1-3 1-3 1-2 1-2 1 3 195-265 mRaCIRRI1H3 (GT)15(GA)17 0.385842 AF205117 2-5 2- 4 2 1 5 NA 160-226 mRaCIRRI2B5 (GA)19 AF205118 NP NP NP NP NP NP 222-272 mRaCIRRIV2A8 (CA)12(CT)11 0.378691 AF261693 3-5 1-3 1-2 1 NA 2 191-237 mRaCIRR V1C10 (CTT)8(CT)6 AF261694 NA NA NA NA NA NA 153-203 mRaCIRR V2F4 (CT)8(CA)17(CT)11 AF261695 NP NP NP NP NP NP 180-242 mRaCIRRIV1E8 (CTT)33 AF261696 NP NP NP NP NP NP 197-355
Table 3. Exclusive markers for Rubus species obtained with AFLP
Species E-ACT * M-CTG E-AAC * MCAT E-AGG * M-CAG
R. glaucus 3 4 8
R. urticifolius 3 2 12
R. robustus 2 0 3
R. rosifolius 0 0 2
Table 4.Genetic diversity in populations of Rubus species
Rubus species Nr. of Nr. of P* Hs Dst Ht Gst
accessions loci
R. robustus 4 20 13 0.038 -0.020 0.31286 -7.03
R. adenotrichos 1 20 0 0.000 0.31286 0.31286 1
R. bogotensis 1 20 0 0.000 0.31286 0.31286 1
R. glaucus 27 20 14 0.27863 0.03423 0.31286 0.1
R .rosifolius 3 20 3 0.200 0.11286 0.31286 0.3607
R. urticifolius 15 20 15 0.25333 0.05953 0.31286 0.190
* Polymorphic loci (P), Expected heterozygosity (Hs), Genetic diversity within population (Dst), Total heterozygosity (Ht), Differentiation at the locus level (Gst)
alleles per individual in R. alceifolius, which confirmed the hypothesis that this is a tetraploid species. In this paper, R. robustus, R. rosifolius, and R. bogotensis produced between one and two alleles, while R. glaucus
produced between three and five alleles, and R.
urticifolius between two and three alleles, whereas R. adenotrichos amplified five alleles. These results suggest that the last three species have higher ploidy levels than the others. In phylogeny studies with internal transcribed spacers (ITS) Rubus Alice and Campbell (1999) describe R. robustus and R. rosifolius as diploid species and subgenus Orobatus as hexaploid. In contrast, the ploidy level in the Rubus subgenus ranges from diploid to tetraploid, while the subgenus Idaeobatus presents both diploid and tetraploid species. According to morphological and molecular descriptions made by the abovementioned authors on other Rubus species, the ploidy level among Rubus genotypes can vary greatly. The results presented here, using two different molecular markers, agree with the highly variable ploidy level found in other Rubus species.
With some SSR markers, e.g., mRaCIRRI1H3 and mRaCIRRI1G3, R. glaucus amplified only two alleles, as in the case of the genotypes 5, 6, 21, 22, 35, 42, 45, 46, 50, 54, 65, 80, 83, 86, 87, 95, 97, and 102 while the R. glaucus genotypes 7, 9, 10, 13, 90, 99, 100, and 101 amplified three, four and five alleles. Several R. urticifolius genotypes (3, 64, 103, 106, and 107) amplified
more than two alleles with these same SSR markers, suggesting that there are both diploid and tetraploid genotypes of R. glaucus and R. urticifolius in the wild and cultivated germplasm. According to Jennings (1988) and Jennings and McGregor (1988), R. glaucus is a species that combines traits of Idaeobatus (leaf morphology, plant growth habit and chemical fruit characteristics) with the external traits of fruits and inflorescences of subgenus Rubus. The morphological description of R. glaucus at the molecular level is quite similar to results of AFLP as well as SSR markers, which evidences the great inter-relatedness between species at the subgenus level.
mRaCIRRI1H3 amplified six loci, one of which is exclusive to R. rosifolius 32. The other five loci were shared by all species, except R. bogotensis. Rubus adenotrichos as well as R. glaucus (genotypes 99, 100, and 101) produced amplification in five of the six loci.
mRaCIRRI1G3 amplified seven loci, two of which were exclusive to R. robustus 18. One band was shared by R. urticifolius 82 and R. robustus 33 only and another band was shared by R. robustus 33 and R. urticifolius (82 and 52). A final band was shared by R. glaucus genotypes (5, 6, 7, 9, 10, 13, 21, 22, 65, 83, 87, 95, 99, 100, 101, and 102) and R. urticifolius genotypes (37, 64, 67, and 103).
in only two plants of R. urticifolius (106 and 107). One locus amplified only in R. robustus 18, R. bogotensis 34, and R. urticifolius 37. The SSRs achieved cumulative polymorphism information content (PIC) of 0.4056466, and individual values for each locus between 0.27332005 and 0.499166 (Table 2). In comparison, Ishii and McCouch (2000) obtained mean PIC values of 0.267 when evaluating rice SSRs and Cordeiro et al. (2000) obtained PIC values between 0.48 and 0.8 when evaluating sugarcane SSRs. These PIC values demonstrated that, in spite of the low number of primers used, the SSR were sufficiently polymorphic and informative.
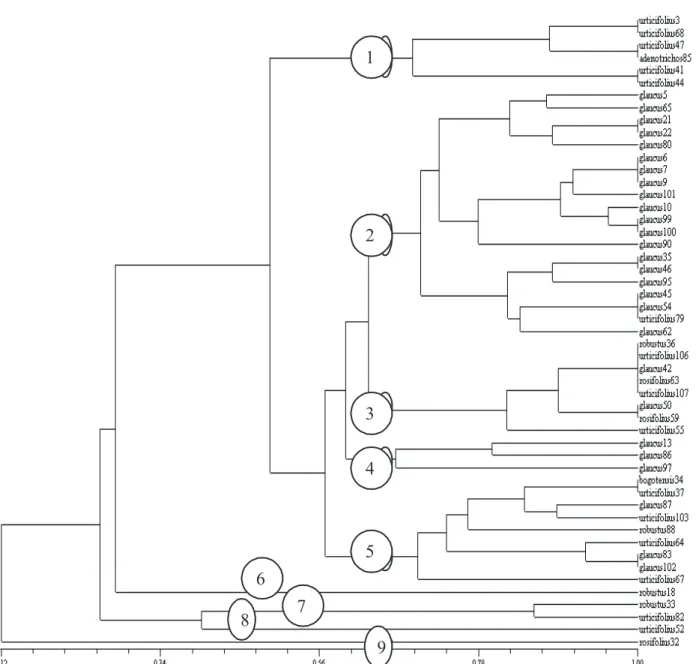
Apart from demonstrating that R. alceifolius SSR can be used to study and evaluate the diversity of Colombian Rubus species, our results evidenced that the SSR markers developed by Amsellem et al. (2001) can be a powerful tool to help classify Rubus species. All study species produced very specific banding patterns, differentiating them from the other species, besides seven private alleles for recognition at the subgenus and species level. Molecular results were consistent with the taxonomic description of Aguilar (2006), whose data were based on morphological traits. The dendrogram (Figure 2) shows the major genetic differences between R. robustus (genotype 18
of group 6 and genotype 33 of group 7) and R.
urticifolius (genotype 82 of group 7 and genotype 52 of group 8). Rubus rosifolius 32 (group 9) was isolated from all other species, with only 12% similarity.
Three closely related groups were formed, with high similarity indexes. The first group (1) contained R. urticifolius (3, 41, 44, 47, and 68) and R. adenotrichos 85. The second group (2) was formed by 20 individuals of R. glaucus from different origins, with high similarity indexes, together with R. urticifolius 79. A third group (3) united R. robustus 36, R. urticifolius (55, 106, and 107), R. glaucus (42 and 50), and R. rosifolius (59 and 63) a most peculiar species combination.
The R. glaucus genotypes 13, 86, and 97 presented the lowest similarities values of all species and form a fourth group (4). A fifth group (5), separated from the other four, joins R. bogotensis 34, R. urticifolius (37, 64, 67, and 107), R. glaucus (83, 87, 88, and 102), and R. robustus 88, with similarity indexes between 70 and 100%.
Genetic diversity within and among populations
The analysis of molecular variation (AMOVA) revealed differences in partitioning variation within and among groups. SSR markers showed greater variance within than among groups (Table 5). The variance found within groups for Rubus with SSR (80.4) is quite similar to that obtained by Saini et al. (2004) for rice populations (76.93). As described by Brown and Weir (1983), mean expected heterozygosity (He) and total heterozygosity (Ht) were estimated as a measure of polymorphism and usefulness of the marker systems used in this study (Table 4). Mean total heterozygosity (Ht) was 0.31286. The mean expected heterozygosity within populations varied from 0.00000 to 0.33333 for R. robustus, which presented the highest heterozygosity. Rubus glaucus, R. rosifolius, and R. urticifolius showed similar values: 0.27863, 0.20000, and 0.25333, respectively. The genetic diversity (Dst) or polymorphism within each population (Nei 1987) varied from 0.020 to 0.31286 (Table 4).
The differentiation of a simple locus is defined by Nei (1973) as gst, whereas the relative magnitude of differentiation between populations is measured as GST. Nei (1987) recommends the estimation of GST when calculating the differentiation for the whole genome. In this study with Rubus, the mean GST was 0.4042, a rather high value that evidences the high differentiation between populations or, in this case, between species (Table 4).
Studies with Pueraria lobata (Fabaceae) showed values of expected heterozygosity between 0.290 and
Table 5. Partitioning of variance derived from the analysis of molecular variance (AMOVA) with SSR markers
Source Degrees Sum of Variance Percentage of Variation of freedom Squares components of variation
Among Populations 5 34.520 0.66031 Va 19.60
Within populations 45 121.911 2.70914 Vb 80.40
Total 50 156.431 3.36945
Figure 2.Cluster analysis of 51 accessions of Rubus sp., based on the matrixof genetic similarity calculated based on SSR markers. The UPGMA method was the grouping criterion
1
2
3
4
5
6
7
8
Diversidade genética de espécies cultivadas e silvestres
de
Rubus
na Colômbia.
RESUMO -A amora pertence ao gênero Rubus, o maior da família das Rosaceae e é um dos mais diversos tipos do reino vegetal. Na Colômbia, a espécie Rubus glaucus Benth conhecida como amora dos Andes ou amora de Castilha é uma das nove espécies comestíveis deste gênero, de 44 espécies reportadas. No presente trabalho se realizou uma análise molecular com 0.213 (Pappert et al. 2000). Selander (1976) found mean
values of polymorphic loci (P) and heterozygosity (H) of 0.344 and 0.078 for allogamous plants. The respective values were 0.405 and 0.312 for Rubus. In contrast, in studies with Lycopodiaceae conducted by Frankel et al. (1995), the following values were obtained: Ht, 0.071; Hs, 0.051; and GST, 0.284, with four sub-populations and 13 loci. These values are relatively low compared with those obtained in Rubus—a very interesting result because once again the reproductive pattern of this plant group affects the genetic variability.
The AMOVA analysis reveals that high genetic variability does exist among and within Rubus species in the study population. In addition, the R. glaucus genotypes studied showed high genetic variability, where the greatest differences were observed in wild genotypes. The SSRs produced bands that were exclusive to R. robustus, R. urticifolius, R. glaucus, and R. rosifolius. SSR markers differentiated the subgenera Rubus and Idaeobatus, and distinguished two groups between R. glaucus and R. urticifolius. Further research will indicate whether the samples of R. glaucus and R. urticifolius with high similarity index, as determined via AFLP, are potentially interspecific hybrids.
The differentiation among populations (Nei 1986), is determined by the fixation index (FST) which can vary from 0 to 1. Close-to-zero values indicate a larger number of heterozygotes while higher values indicate a larger number of homozygotes. FST values of 0.282 were reported in studies carried out with other vegetable species such as Lycopodeaceae, whereas values of 0.6 were reported for crustaceans. The FST value of 0.19597 obtained in Rubus therefore evidences the presence of a high number of heterozygotes in the study population. The Mantel test (1967) did not show a statistically significant positive correlation for the AFLP and SSR matrixes, which can be attributed to the fact that most widely adopted marker technologies, such AFLP and SSR, amplify different regions of the genome. The
advantages and disadvantages of each technology should be carefully assessed before being effectively deployed in diversity analysis (Saini et al. 2004). The markers target different genomic fractions involving repeat and/or unique sequences, which are differentially evolved or preserved in the course of natural or human selection (Saini et al. 2004). Virk et al. (2000) reported differences between AFLP and ISSR marker techniques when classifying 42 rice accessions, which agree with reports of Parsons et al. (1997).
Saini et al. (2004) emphasize, on the other hand, the fact that marker-based differences in genetic relationships among rice genotypes indicate the need to use a combination of different marker systems for comprehensive genetic analysis. Furthermore, the hypervariability in loci usually observed with SSR can be attributed to a mechanism of replication slippage, which occurs more frequently than point mutation and insertion/deletion events in AFLP polymorphism (Tautz et al. 1986). The usefulness of the SSR technique for co-dominant, mapped and publicly available microsatellite sequences will increase in the near future (Saini et al. 2004). AFLP and SSR were found to be complementary because their joint analysis provided additional elements to explain the complex inter-relationship between wild and cultivated Rubus species in a region of high genetic diversity for this plant group, such as the Colombian Andes.
ACKNOWLEDGEMENTS
REFERENCES
Aguilar SB (2006) Caracterización de la variabilidad
ge-nética de Rubus glaucus en el eje cafetero utilizando
AFLP. MSc Thesis. Universidad Tecnológica de
Pereira-Universidad del Quindío-Pereira-Universidad de Caldas, 88p.
Alice LA (2002) Evolutionary relationships in Rubus (Rosaceae)
based on molecular data. Acta Horticulturae 585: 79-83.
A l i c e L A a n d C a m p b e l l C S ( 1 9 9 9 ) P h y l o g e n y o f R u b u s
( R o s a c e a e ) b a s e d o n n u c l e a r r i b o s o m a l D N A i n t e r n a l
transcribed spacer region sequences. American Journal of
Botany 86: 81-97.
Alice LA, Eriksson T, Eriksen B and Campbell CS (1997) Intersubgeneric hybridization between a diploid raspberry,
R u b u s i d a e u s, a n d a t e t r a p l o i d b l a c k b e r r y, R . c a e s i u s
(Rosaceae). American Journal of Botany 84: 171.
Amsellem L, Dutech C and Billote N (2001) Isolation and
characterization of polymorphic microsatellite loci in Rubus
alceifolius Poir. (Rosaceae), an invasive weed in La Reunion
Island. Molecular Ecology Notes 1: 33-35.
Amsellem L, Noyer JL, Le Bourgeois T and Hossaert-Mckey M (2000) Comparison of genetic diversity of the invasive weed
Rubus alceifolius Poir. (Rosaceae) in its native range and in areas of introduction, using amplified fragment length
polymorphism (AFLP) markers. Molecular Ecology 9:
443-4 5 5 .
Anderson JA, Churchill GA, Autrique JE, Tanksley SD and Sorrells ME (1993) Optimizing parental selection for genetic
linkage maps. Genome 36: 181-186.
A n t o n i u s - K l e m o l a K ( 1 9 9 9 ) M o l e c u l a r m a r k e r s i n R u b u s
(Rosaceae) research and breeding. Journal of Horticultural
Science and Biotechnology 74: 149-160.
Ballington JR, Luteyn MM, Thompson K, Romoleroux K and
Castillo R (1993) Rubus and Vacciniaceous germplasm
r e s o u r c e s i n t h e A n d e s o f E c u a d o r. P l a n t G e n e t i c
Resources Newsletter 93: 9-15.
Bassam BJ, Caetano-Anolles G and Gresshoff PM (1991) Fast and sensitive silver staining of DNA in polyacrylamide gels.
Analytical Biochemistry 196: 80-83.
Bonstein D, White RL, Skolnick ME and Davis RW (1980) Construction of a genetic linkage map in man using restriction
f r a g m e n t l e n g t h p o l y m o r p h i s m . A m e r i c a n J o u r n a l o f
Human Genetics 32: 314-331.
marcadores AFLP e SSR de materiais silvestres e cultivados, cuja colheita foi feita na região cafeeira colombiana. O estudo permitiu concluir que a variabilidade genética observada em R. glaucus deve-se a que a reprodução sexual cumpre um importante papel mantendo a variabilidade. Demonstrou-se a aplicabilidade dos microsatélites de Rubus alceifolius na caracterização de Rubus spp. Colombianas. Todas as espécies estudadas deram padrões de banda muito específicos, diferenciando-as das demais. Os microsatélites deram como resultado bandas exclusivas por espécie para R. robustus, R. urticifolius, R. glaucus e R. rosifolius. Os SSR diferenciaram dois grupos de R. glaucus: genótipos diplóides e tetraplóides.
Palavras-chave:AFLP, Microsatélites, Diversidade genética, Rubus spp.
Brown A and Weir B (1983) Measuring genetic variability in p l a n t p o p u l a t i o n s . I n : Ta n k s l e y S a n d O r t o n T ( e d s . )
I s o z y m e s i n p l a n t g e n e t i c s a n d b r e e d i n g. E l s e v i e r , Amsterdam, Part A, p. 219-287.
Cordeiro GM, Taylor GO and Henry RJ (2000) Characterization
of microsatellite markers from sugarcane (Saccharum sp.),
a highly polyploidy specie. Plant Science 155: 161-168.
Dice IR (1945) Measures of the amount of ecological association
between species. Ecology 26: 295-302.
Doyle JJ and Doyle JL (1990) Isolation of plant DNA from
fresh tissue. Focus 12: 13-15.
Excoffier L, Laval G and Schneider S (2006) Arlequin ver 3.1.
An Integrated Software Package for Population Genetics Data Analysis, 145p.
Frankel OH, Brown AHD and Burdon JJ (1995) Conservation
of plant biodiversity. Cambridge University Press, United Kingdom, 299p.
Ghosh S, Karanjawala ZE, Hauser ER, Ally D, Knapp JI, Rayman JB, Musick A, Tannenbaum J, Shapiro CS, Eldridge W, Musick T, Martin C, Smith JR, Carpten JD, Brownstein MJ, Powell JI, Whiten R, Chines P, Nylund SJ, Magnuson VL, Boehnke M , a n d C o l l i n s F S ( 1 9 9 7 ) M e t h o d s f o r p r e c i s e s i z i n g , automated binning of alleles, and reduction of error rates in large-scale genotyping using fluorescently labeled dinuclotide
markers. Genome Research 7: 165-178.
Graham J and McNicol RJ (1995) An examination of the ability of RAPD markers to determine the relationships within and
between Rubus species. Theoretical and Applied Genetics
90: 1128-1132.
G r a h a m J , S m i t h K , Wo o d h e a d M a n d R u s s e l l J ( 2 0 0 2 )
Development and use of SSR markers in Rubus species.
Molecular Ecology 2: 250-252.
Graham J, Squire GR, Marshall B and Harrison RE (1997b) Spatially dependent genetic diversity within and between
colonies of wild raspberry Rubus idaeus detected using RAPD
markers Molecular Ecology 6: 1001-1006.
Gustafsson A (1942) The origin and properties of the European
blackberry flora. Hereditas 28: 249- 277.
I s h i i T a n d M c C o u c h S R ( 2 0 0 0 ) M i c r o s a t e l l i t e s a n d
microsynteny in the chloroplast genomes of Oryza and eight
o t h e r G r a m i n e a e s p e c i e s . T h e o re t i c a l a n d A p p l i e d
Jennings DL (1978) The blackberries of South America—an
u n e x p l o r e d r e s e r v o i r o f g e r m p l a s m . F r u i t Va r i e t i e s
Journal 32: 61-63.
Jennings DL (1988) Raspberries and blackberries: Their
breeding, diseases and gro w t h. Academic Press, New York, 230p.
Jennings DL and McGregor GR (1988) Resistance to cane spot (Elsinoe veneta) in red raspberry and its relationship to
r e s i s t a n c e t o y e l l o w r u s t (P h r a g m i d i u m r u b i - i d a e i) .
Euphytica 37: 173-180.
Kollmann, J, Steinger T and Roy BA (2000) Evidence of
sexuality in European Rubus (Rosaceae) species based on
AFLP and allozyme analysis. American Journal of Botany
87: 1592-1598.
Mantel NA (1967) The detection of disease clustering and a
generalized regression approach. Cancer Research 27:
209-2 209-2 0 .
Nei M and Li WH (1979) Mathematical model for studying genetic variation in terms of restriction endonucleases.
Proceedings of the National Academy of Sciences of the USA 76: 5267-5273.
N e i M ( 1 9 7 3 ) . A n a l y s i s o f g e n e d i v e r s i t y i n s u b d i v i d e d
populations. Proceedings of the National Academy of
Sciences of the USA 70: 3321-3323.
Nei M (1986) Definition and estimation of fixation indexes.
Evolution, 40: 643-645.
Nei M (1987) Molecular Evolutionary Genetics. Columbia
Univ. Press, New York, 512p.
P a p p e r t R , H a m r i c k J L a n d D o n o v a n L ( 2 0 0 0 ) G e n e t i c
variation in Pueraria lobata (fabaceae), an introduced,
clonal, invasive plant of the southeastern United States.
American Journal of Botany 87: 1240–1245.
Parent JG and Fortin MG (1993) Identification of raspberry cultivars by random amplified polymorphic DNA (RAPD)
analysis. Canadian Journal of Plant Science 73:
1115-1 1115-1 2 2 .
P a r e n t J G a n d P a g e D ( 1 9 9 8 ) I d e n t i f i c a t i o n o f r a s p b e r r y cultivars by sequence characterized amplified region DNA
analysis. Hortscience 33: 140-142.
Parsons JB, Newbury HT, Jackson MT and Fort-Lloyd BV (1997) Contrasting genetic diversity relationships are
revealed in rice (Oryza sativa L.) using different marker
types. Molecular Breeding 3: 115-125.
R o h l f F J ( 1 9 8 9 ) N T S Y S - p c N u m e r i c a l Ta x o n o m y a n d
M u l t i v a r i a t e A n a l y s i s S y s t e m, Ve r s i o n 1 . 5 0 . E x e t e r Publications, New York, USA.
R o l h f F J ( 1 9 9 3 ) N T S Y S - p c N u m e r i c a l Ta x o n o m y a n d
Multivariate Analysis System, Version 1.70 New York, USA. Exeter Software.
Romoleroux K (1992) Rosaceae in the Paramos of Ecuador. In:
B a l s l e v H a n d L u t e y n J L (eds.) P a r a m o : A n A n d e a n
E c o s y s t e m u n d e r H u m a n I n f l u e n c e. A c a d e m i c P r e s s , London, p. 85-94.
Saini N, Jain N, Jain S and Jain R (2004) Assessment of genetic diversity within and among Basmati and non-Basmati rice
varieties using AFLP,ISSR and SSR markers Euphytica 140:
133-146.
Selander RK (1976) Genetic variation in natural populations.
In: Ayala FJ (ed.) Molecular Evolution Sinauer, Sunderland,
Mass, p. 21-45.
Tautz D, Trick and Grover GA (1986) Cryptic simplicity in
DNA is a major source of variation. Nature 322: 652-656.
Va rg a s W ( 2 0 0 2 ) G u í a i l u s t r a d a d e l a s p l a n t a s d e l a s
m o n t a ñ a s d e l Q u i n d í o y l o s A n d e s c e n t r a l e s. Universidad de Caldas y Corporación Autónoma Regional del Quindío, Manizales, Colombia, 813p.
Virk PS, Zhu HJ, Newbury GJ, Bryan MT, Jackson and Ford – L l o y d B V ( 2 0 0 0 ) E f f e c t i v e n e s s o f d i f f e r e n t c l a s s e s o f molecular markers for classifying and revealing variation in
rice (Oryza sativa) germplasm. Euphytica 112: 275-284.
Vos P, Hogers R, Bleeker M, Reijans M, T Van de Lee, Hornes M, Frijters A, Peleman J Pot, Kuiper M and Zabeau M (1995)
AFLP: A new technique for DNA fingerprinting. Nucleic
Acids Research 23: 4407-4414.
We b e r H E ( 1 9 9 5 ) R u b u s L . I n : We b e r H E ( e d . ) Hegi G,
Illustrierte Flora von Mittleleuropa. vol 4, Part 2, 3rd Ed. Blackwell Wissenschafts-Verlag, Berlin, p. 285-595.
Weir BS and Cockerham CC (1984.) Estimating F- statistics for