DEVELOPMENT OF A HETEROGENIC DISTRIBUTED ENVIRONMENT
FOR SPATIAL DATA PROCESSING USING CLOUD TECHNOLOGIES
A.S. Garov a , I.P. Karachevtseva a *, E.V. Matveev a, A.E. Zubarev a, I.V. Florinsky b
a
Moscow State University of Geodesy and Cartography (MIIGAiK), MIIGAiK Extraterrestrial Laboratory (MExLab), 105064 Moscow, Russian Federation – [email protected]
b
Institute of Mathematical Problems of Biology – Branch, The Keldysh Institute of Applied Mathematics, Russian Academy of Sciences Pushchino, Moscow Region, 142290, Russia
Commission IV, WG IV/8
KEY WORDS: Web-GIS, cloud-based distributed computing, Earth and planets remote sensing data, DEM/DTM, three-dimensional visualization, virtual globe
ABSTRACT:
We are developing a unified distributed communication environment for processing of spatial data which integrates web-, desktop- and mobile platforms and combines volunteer computing model and public cloud possibilities. The main idea is to create a flexible working environment for research groups, which may be scaled according to required data volume and computing power, while keeping infrastructure costs at minimum. It is based upon the “single window” principle, which combines data access via geoportal functionality, processing possibilities and communication between researchers. Using an innovative software environment the recently developed planetary information system (http://cartsrv.mexlab.ru/geoportal) will be updated. The new system will provide spatial data processing, analysis and 3D-visualization and will be tested based on freely available Earth remote sensing data as well as Solar system planetary images from various missions. Based on this approach it will be possible to organize the research and representation of results on a new technology level, which provides more possibilities for immediate and direct reuse of research materials, including data, algorithms, methodology, and components. The new software environment is targeted at remote scientific teams, and will provide access to existing spatial distributed information for which we suggest implementation of a user interface as an advanced front-end, e.g., for virtual globe system.
1. INTRODUCTION 1.1 Concept
Based on idea of 3D-web-GIS as online laboratory for remote scientific groups in geoscience (Garov et al., 2015a) we are proposed a concept of distributed communication environment using new software architecture to develop an innovative information system that have the following main features:
1. The functionality of the system not limited to the Web- site, plug-in, or a set of components. The system is developing as an application for the three types of platforms: desktop (Windows, Linux, OSX), Web-based platform (any HTML5 browser) and mobile application (Android, iOS).
2. The system will operate on advanced user interface using high-resolution remotely sensed data of celestial bodies as well as various digital products (DEMs with different resolution and extent; global orthomosaics and individual high-resolution orthoimages of surfaces of celestial bodies; catalogues of control points; catalogues of small craters and other topographic features, including morphometric parameters).
3. A unified metadata provide global search in the system and quick access to spatial data based on developed planetary data model. Using online planetary maps (http://bit.ly/Lunohod_1) the intelligent search of spatial data that will be integrated in new version of system has been developed (Garov et al., 2015b).
1.2 Background
For the realisation of the proposed concept the principles existing in free open source software (FOSS) industry should be applied. New online resources providing interactive access to spatial results of scientific research are needed (sort of “Github for geoscience”). For example, in the field of using GIS for planetary exploration the actual research areas are the following:
- Alignment and fusion of multi-scale images, obtained from orbital spacecraft and from cameras, installed on rovers, navigating planet surface (Morley et al., 2014).
- Creation of environments with virtual-reality “immersion” effect within (Traxler et al., 2015) which qualitative and quantitative geological analyses can be performed by researcher (Barnes, et al., 2015) using 3D-tools ( http://www.provide-space.eu/interactive-virtual-3d-tool/).
- Using GIS for work with multi-temporal data (introducing time dimension). Accumulated over the past years amount of planet surface observation data makes possible to overlay different epoch data (starting from mid-70), to discover and explore surface changes, such as: fresh impact craters (Muller et al., 2015), Recurring Slope Lineae (RSLs) (Ojha L. et al., 2014), gas geysers, gullies, boulder movements and a host of ice-related phenomena.
- Using 3D-GIS to work with geological cross-section data and with sub-surface data, obtained from radar sounding (i.e.
instruments MARSIS/SHARAD
(http://www.ig.utexas.edu/sharad_marsis/).
- Tendency at integration of GIS/VO (Virtual Observatory) technologies, which not only leads to the discovery of new data, but also expands scientific audience and extends its capabilities in the field of planetary research. This potentially facilitates developing new cross-discipline use cases for integrated GIS/VO systems, which can be used not only for 3D-modelling of planet surface, but in the field of atmospheric and plasma-magnetosphere research as well.
- Developing application within GIS-systems ( http://www.i-mars.eu/web_gis) for monitoring of planetary surface and dynamics of craters (Muller et al., 2015).
-
Move to heavy-usage of GIS-technologies for direct visual planning of future scientific missions: Bepi-Colombo to Mercury (http://sci.esa.int/bepicolombo/) or ExoMars (http://www.cross-drive.eu/public/project).The important areas of research in the field of using and distribution of spatial data are the development, improvement, and unification of standards for storage, processing, and transmission of spatial information. One example of this is the evolution of Planetary Data System standard (PDS) with current move to PDS4 (Crichton, 2012), with extended geometry metadata, which now can include, for example, attributes of the lighting and viewing angles of observations, position and velocity vectors of a spacecraft relative to Sun and observing body at the time of observation.
Another example is proposed extension of FITS standard (http://fits.gsfc.nasa.gov/fits_standard.html), used in astronomy and astrophysics, to include metadata for planetary sciences, which will make possible use of FITS specific data in GIS-systems, including support of atmospheric data, meteoric showers, other virtual observatory data.
So, new Web-services are actively developing in geoscience last decade due to the powerful technological leap in computer technology. There is a variety of software and technological solutions for the storage and access to the results of the processing of remotely sensed data of satellites and planets, including Web-GIS. To support this trend we are developing distributed communication environment for processing of spatial data which integrate web-, desktop- and mobile platforms and combine volunteer computing model and public cloud possibilities.
2. SOFTWARE ARCHITECTURE 2.1 Cross platform solution
The system will be created with a new software architecture, which has a potential for development and flexibility in reconfiguration that is provided by the following features:
- The system will be designed as an application for the three types of platforms: desktop (Windows, Linux, OSX), web platform (any HTML5 browser), and mobile application (Android, iOS).
- We will implement two physical types of applications: a binary executable application compiled for a specific platform, and web application running within browser based on ASM.JS (a subset of JavaScript optimised in terms of performance).
- We will have a single codebase shared between platforms and use cross compilation for the Web platform.
- Applications will have a unified interface at all platforms.
- Customization for specific problem domain will be possible (loadable domain UI, provided as HTML markup).
- We will use modern solutions in the field of graphics (OpenGL for desktop, OpenGL-ES for mobile platform, WebGL for web platform). Linking of an appropriate library will occur automatically during compilation for the selected platform.
- Developed modules will be based on actors model.
2.2 Network solution
We use hybrid P2P architecture as network solution which implementation has the following characteristics:
- Physical applications as components of the system (including browser application) are equal. They are used as container for functional modules (or service-module). All connection between containers is performed using duplex protocols. This enables every container to act as server.
- For communication between service-modules one of advanced communication libraries (nanomsg, ZeroMQ) will be used. The library will provide necessary abstraction layer above concrete physical protocol, selection of which could be determined by required configuration of the system. Adaptation of the libraries for heterogenic web-app/native-app communication without use of proxy is new technological solution.
- Message exchange between modules is performed via logical communication channel. Single channel can have several service-modules attached, which thus form separate peer-to-peer network. We propose approach allowing the overall network topology to be purely p2p, or form a segmented or hierarchical structure. This is achieved using message routing, performed independently for each channel.
- Overall computing power of the system can be increased with additional container components (running on physical, virtual or cloud “hardware”). We would like to note specifically that end-user application (including browser web-application) also constitutes a full-featured container.
- The novelty of programming solutions is based on supported set of transport protocols, used for messaging within system: we use WebRTC.datachannel and WebSocket (WS/WSS) for heterogenic communication, traditional TCP also supported for messaging between native containers. Service-modules residing in single container communicate using virtual (in-proc) transport.
2.3 Graphics and visualisation approach
The system based on a modern 3D-API (OpenGL, WebGL) using shaders for 2D mapping, which will, in addition to the advantages of unification of code and speed of processing, provide a number of functional advantages:
- The ability to dynamically transform raster (texture), which is commonly used in 3D modelling, will be used for the purposes of 2D mapping, for example, for the dynamic transformation of map projection.
- It will be possible to create a scalable system of dynamic filters for space image processing implemented as shaders written using a standard language.
- The system will use an effective implementation of the co-registration of images by providing each layer as a texture stretched over a single geometry.
- GIS software tools widely used for planetary studies, e.g., Crater Tools (Kneissl et al., 2011) will be used online interactively.
Thus, the system will provide a Web client with a new opportunity to process images (both local and remote) including basic functional of GIS without using a server. Previously, such an opportunity was available only to full-featured professional desktop GIS.
2.4 Distributed computing
For implementation in the project an adapted distributed computing model is planned for use. In this model publically available raster and vector layers are used as source data for work-units instead of input files. Data separation is based upon spatial context, which is traditionally used in GIS applications. Variants of standardized separation with overlap for raster and vector data will be proposed. Using standardized data separation allows us to automate initial setup for organization of distributed processing and make it “transparent” for end user.
The project scope is restricted to spatial data processing, including distributed processing, visualization and providing common on-line environment for the user (this could be formulated as distributed front-end). Creation of spatial data archives goes beyond the scope of the project. Such approach is due to current situation with spatial data sources, which can be divided into several groups:
- data, available in FTP-archives (remote sensing data usually);
- data, available via OGC-services;
- data, which will be available in near future via new technologies/products spread.
One of these technologies is “array database” which provides access to data stored as multi-dimensional array. This form of data organization is suitable for storing of raster data together with additional temporal component. Such products as Rasdaman, SciDB are representatives of this technology.
Supporting processing of such heterogenic data by unified system requires setting up internal data representation/format for work within system. This format should take into account the specifics of its intended use which in our case is distributed processing/computing of spatial data. The format should be simple, compact for transferring data via network (that means binary is preferred) and support main feature for distributed computing – the ease of data separation/merging.
Developed prototype version of the format uses standard tiling for raster data. For vectors special chunking scheme based on use of junction points has been proposed. This technique preserves source vertex order and enables to align content of the chunk with raster tile within single message, which is important for distributed processing. The proposed approach differs from standard polygon triangulation and culling, it does not save
source primitive type, however it is very compact and lightweight. This format currently used on 2D vector layers; also no special data coarsening or generalization techniques have been used. We have preliminary design, which can be combined with described chunking.
3. IMPLEMENTATION 3.1 Current telecommunication solutions
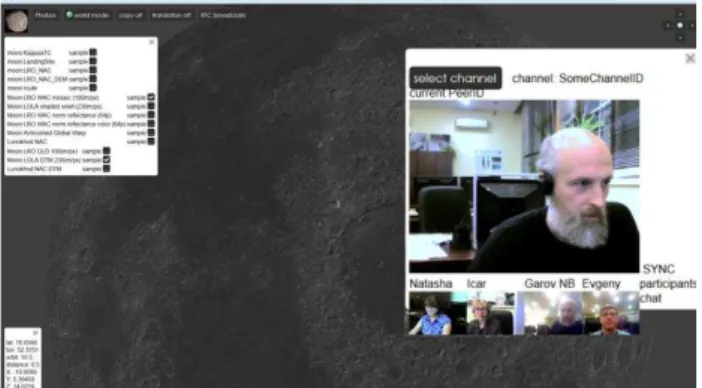
Based on adaptation of existing software and network libraries, we have developed a new user interfaces using teleconferencing mode for communication of the scientific community and educational purposes (online lectures and presentations). Incorporation of new functionality provides online user collaboration in a single software environment using joint spatial context (Fig. 1).
Figure 1. Online communication within a single software environment based on joint user three-dimensional spatial
context
To support this possibilities we use a single compact messaging protocol between the modules within a single process and via the network without the use of middleware, including:
- Scalability protocols used to ensure scalability and performance.
- Ability to easily transfer functional module between the server and the client.
- We use the duplex transport network protocols only.
- Restriction of using HTTP, XHR in favour of WS/WSS and WebRTC (HTTP is used to load the user interface).
- Compatibility mode with WFS, WMS, in which queries and spatial data are converted from internal format of messages to the appropriate standard requests. A module responsible for this functionality can be located on both the client (in the case of a full-featured desktop- or HTML-application), and the server, which is important for mobile platforms, because this can reduce application footprint and minimize network traffic.
- We provide scripting API support for running external scripts and animation written in a simple language (e.g., Lua). It will be possible to transmit a static (set of layers/position of the observer) and dynamic (position script/animation) context through URL or via message.
- We implement a teleconference regime (including video/audio broadcasting) the presence of the scripting API and WebRTC use for communications provides an opportunity to implement such a regime in a peer-to-peer mode. Scripting API provide
context synchronization between the speaker and other participants.
3.2 Further extensions for 3D-visualization
The possibility of three-dimensional visualization has been implemented in testing version of system prototype (Fig.1). To create a realistic 3D representation of a lighting scene, it is necessary to know a bi-directional reflectance distribution function (BRDF) of the ground. The following solutions will be applied if information on the distribution of the soil on the surface of a celestial body is missing:
- In the first approximation, we will use orthoimages with shadows excluded using digital terrain models (BRDF will be replaced by a constant based on the orthophoto) that will be implemented in automatic mode during the modelling: we will use low-pass filtering of the image with the formation of an orthophoto for texturing three-dimensional model (a "textured" images).
- For a more realistic representation, a user will select a desired option from the library of planetary BRDF.
- A microtexturing will also be applied (automatic creation of normal maps for high-frequency components of the "textured" orthophoto) and the result will be used as an additional texture.
- To display the atmospheric planetary bodies (e.g., Mars), we will use three-dimensional textures imitating the presence of the atmosphere.
In addition, we are going add new features based on 3D-visualization, for example, using of the SPICE navigation database (https://naif.jpl.nasa.gov/naif/data.html), the system will include possibilities the data representation based on SPICE tools (Zubarev and Patratiy, 2013), including: a) the location of natural and artificial satellites and modelling of their position (orbit); b) the Sun position and the modelling of lighting conditions; c) the Earth position and modelling of its radio visibility conditions from other celestial bodies that is important for planning of landing missions to the bodies of the Solar system, ect.
4. PRODUCTION AND FUTURE WORK 4.1 Virtual globes
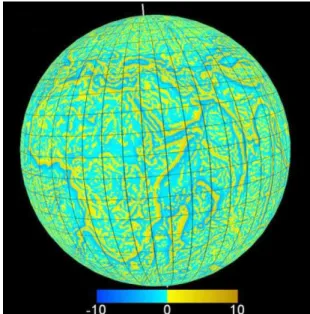
We applied the developing software architecture to demonstrate the global morphometric characteristics of the Earth and the Moon as well as parameters of the other terrestrial planets (Florinsky, 2008) in forms of the virtual globes. For these purposes the morphometric parameters of the Earth, Mars and the Moon were computed using the 15'-gridded global digital elevation models (DEMs) as the initial data (Florinsky and Filippov, 2015). The digital terrain models (DTMs) with morphometric attributes derived from the DEMs were produced by the method for spheroidal equal angular grids (Florinsky, 1998; Florinsky, 2012). To estimate linear sizes of spheroidal trapezoidal windows in DTMs calculation and smoothing, standard values of the major and minor semi-axes of the Krasovsky ellipsoid was used for Earth (Fig. 2); the Moon was considered as a sphere (Fig. 3).
Each DTM with morphometric attributes included 1,036,800 points (the matrix 1440 × 720); the grid spacing was 15'. To deal with the large dynamic range of morphometric variables,
the DTMs were logarithmically transformed; morphometric parameters were computed by the software LandLord (Florinsky, 2012).
Figure 2. One of the Earth morphometric parameters (vertical curvature) derived from SRTM30_PLUS (Becker et al., 2009)
to produce a virtual globe
4.2 Further applications
Using proposed software architecture, we are developing an integrated solution for the processing, analysis, and three-dimensional visualization of spatial data. This solution will be used for creation of information system devoted to the thematic processing of planetary data, designed for exploration. The new architecture supports creation of distributed spatial data processing chain, with possibility of ad-hoc execution of arbitrary user algorithm, using implementation of p2p architecture with fully functional web-support.
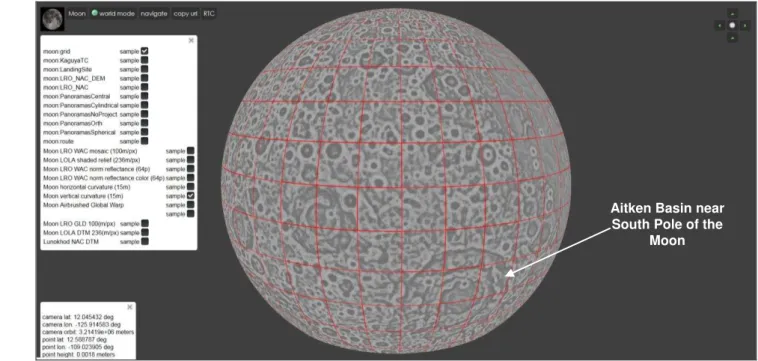
The software architecture can be used as effective solution for presentation of scientific results like virtual globes (Fig. 3) or for implementation of an advanced front-end of data archive, e.g., for Russian segment of the planetary archive or for EarthServer (http://earthserver.eu/), that are developing as remote sensing database. Various tools, e.g., intellectual data search (Matveev et al., 2015) will be integrated as extended plug-ins. Implementation of interactive spatial system can be used to study dynamics of phenomena occurring on celestial bodies and will lead to a better understanding of the surface formation processes, which is the fundamental aim of planetology.
Accomplishment of the software architecture and further development of special tools for thematic tasks can form a kind of “crystallization center” a collection point for research and projects in the field of geosciences, ensuring the next stage in the evolution of GIS systems with the organization of free Internet access to the results of thematic processing.
ACKNOWLEDGEMENTS
This work was supported by Russian Foundation for Basic Research (RFBR): Garov, Karachevtseva and Florinsky by project #15-07-02484; Matveev by project # 16-37-00316; Zubarev by project # 16-37-00319.
Figure 3. User interface of Virtual morphometric globe of the Moon produced using LOLA DEM (Smith et al., 2010) and demonstrated the values of vertical curvature: minimum -10 (black) and maximum +10 (white).
REFERENCES
Barnes R., Gupta S., Giordano M., Morley J.G., J.P. Muller J.P., Tao Y., Sprinks J., Traxler C., Hesina G., Ortner T., Sander K., Nauschnegg B., Paar G., Willner K., Pajdla T. Geological interpretation and analysis of surface based, spatially referenced planetary imagery data using PRoGIS 2.0 and Pro3D. 2015,
EPSC Abstracts Vol. 10, EPSC2015-375,
http://meetingorganizer.copernicus.org/EPSC2015/EPSC2015-375-1.pdf.
Crichton D. PDS4: Developing the Next Generation Planetary Data System. 2012, Planetary Data Workshop, USA, Flagstaff, June.
Cross-Drive: http://www.cross-drive.eu/public/project.
Earth Server: http://earthserver.eu/.
Flexible Image Transport System:
http://fits.gsfc.nasa.gov/fits_standard.html.
Florinsky I.V. and Filippov S.V. Development of virtual morphometric globes using Blender. 2015, arXiv:1512.08511, 14 p.
Florinsky I.V. Derivation of topographic variables from a digital elevation model given by a spheroidal trapezoidal grid. 1998, International Journal of Geographical Information Science, 12: 829-852.
Florinsky I.V. Digital Terrain Analysis in Soil Science and Geology. 2012, Academic Press, Amsterdam, 379 p.
Florinsky I.V. Global morphometric maps of Mars, Venus, and the Moon. In: 2008, Geospatial Vision: New Dimensions in Cartography. Moore A., and Drecki I. (Eds.), Springer, Berlin, pp. 171-192.
Garov A., Karachevtseva I., Kozlova N., Matveev E., Zubarev A., Patratiy V. Web-mapping and intellectualization of the planetary data analysis based on location services in 3D web GIS. 2015a, 12th Symposium on Location Based Services, Augsburg, Germany, September, 16-18.
Garov A.S., Karachevtseva I.P., Matveev E.V., Zubarev A.E., Patratiy V.D. 3D planetary geoportal as online laboratory for geo-collaboraition of scientific community. 2015b, ISPRS
Working Group IV/8 ”Planetary Mapping and Spatial
Databases” meeting, Berlin, Germany, September, 24-25.
http://www.dlr.de/pf/Portaldata/6/Resources/dokumente/abt_pd/ isprs/berlin_2015/Garov_ISPRS_IV8_2015.pdf.
MExLab planetary geoportal: http://cartsrv.mexlab.ru/geoportal
ESA Science & Technology BepiColombo: http://sci.esa.int/bepicolombo/.
i-mars: http://www.i-mars.eu/.
Kneissl T., van Gasselt S., and Neukum G. Map-projection independent crater size frequency determination in GIS environments – new software tool for ArcGIS. 2011, Planetary and Space Science, vol. 59, nos. 11-12, pp. 1243-1254.
Lunokhod map: http://bit.ly/Lunohod_1.
Matveev E.V., Kokhanov A.A., Patraty V.D., Garov A.S., Karachevtseva I.P. The development of the web service for the intelligent search of planetary data. 2015, Proceedings of
conference “Ecology, economy, informatics”. Vol. 3:
Geographic information technologies and space the monitor-ring, pp. 172-179. Rostov-on-Don, Southern Federal University, (in Russian). http://conf-durso.ru/docs/gis_1_2015.pdf.
Morley J., Sprinks J., Muller J.-P., Tao Y., Paar G., Huber B., Bauer A., Willner K., Traxler C., Garov A., Karachevtseva I.
Aitken Basin near South Pole of the
Moon The International Archives of the Photogrammetry, Remote Sensing and Spatial Information Sciences, Volume XLI-B4, 2016
Contextualising and analysing planetary rover image products through the web-based PRoGIS. 2014, Geophysical Research
Abstracts, 2014, Vol. 16, EGU2014-16013,
http://meetingorganizer.copernicus.org/EGU2014/EGU2014-16013.pdf.
Muller J.-P. et aland 11 co-authors. Sidiropoulos P., Yershov V., Gwinner K, van Gasselt S., Walter S., Ivanov A., Morley J., Sprinks J., Houghton R., Bamford S. and Kim J.-R. EU-FP7-iMars: Analysis of Mars Multi-Resolution Images using Auto-Coregistration, Data Mining and Crowd Source Techniques: One year on with a focus on auto-DTM, auto-coregistration and citizen science. 2015, Geophysical Research Abstracts, Vol. 17, EGU2015-10807,
http://meetingorganizer.copernicus.org/EGU2015/EGU2015-10807.pdf.
Ojha L. McEwen,A., Dundas,C., Byrne S., Mattson S., Wray J., Masse M., Schaefer E. HiRISE observations of Recurring Slope Lineae (RSL) during southern summer on Mars. 2014, Icarus, Vol. 231, pp. 365-376. doi:10.1016/j.icarus.2013.12.021/.
PRoViDE: http://www.provide-space.eu/interactive-virtual-3d-tool/.
Becker J.J., Sandwell D.T., Smith W.H.F., Braud J., Binder B., Depner J., Fabre D., Factor J., Ingalls S., Kim S.-H., Ladner R., Marks K., Nelson S., Pharaoh A., Trimmer R., von Rosenberg J., Wallace G., Weatherall P. Global bathymetry and elevation data at 30 arc seconds resolution: SRTM30_PLUS. 2009,
Marine Geodesy, 32, pp. 355-371.
SHARAD & MARSIS:
http://www.ig.utexas.edu/sharad_marsis/.
Smith D.E., Zuber M.T., Neumann G.A., Lemoine F.G., Mazarico E., Torrence M.H., McGarry J.F., Rowlands D.D., Head J.W. III, Duxbury T.H., Aharonson O., Lucey P.G., Robinson M.S., Barnouin O.S., Cavanaugh J.F., Sun X., Liiva P., Mao D.-d., Smith J.C. and Bartels A.E. Initial observations from the Lunar Orbiter Laser Altimeter. 2010, Geophysical Research Letters, 37: L18204. doi: 10.1029/2010GL043751.
SPICE: https://naif.jpl.nasa.gov/naif/data.html
Traxler C., Paar G., Sanjeev Gupta S., Hesina G., Sander K., Barnes R., Nauschnegg B., Muller J-P., and Tao Y. A virtual environment for the accurate geologic analysis of Martian terrain. 2015, Geophysical Research Abstracts, Vol. 17, EGU2015-10346-3.
Zubarev A.E., Patraty V.D. SPICE an effective tool for image processing of celestial bodies. 2013, News of higher
educational institutions (Izvestia vuzov) “Geodesy and
aerophotography”, Moscow, MIIGAiK, №1, pp.59-63, (in
Russian).
http://www.miigaik.ru/journal.miigaik.ru/2013/2013041911513 2-3476.pdf.