Leena Matikainen a, *, Kirsi Karila a, Paula Litkey a, Eero Ahokas a, Anders Munck b, Mika Karjalainen a, Juha Hyyppä a
a Finnish Geodetic Institute, Department of Remote Sensing and Photogrammetry, P.O. Box 15, FI-02431 Masala, Finland – [email protected]
b Agency for Rural Affairs, Opastinsilta 12 B, FI-00520 Helsinki, Finland – [email protected]
KEY WORDS: Mapping, Change Detection, Updating, Automation, Segmentation, Classification, Agriculture, LPIS
ABSTRACT:
Development of change detection methods that are functional and reliable enough for operational work is still a demanding task. This article discusses automated change detection from the viewpoint of one case study: the Finnish Land Parcel Identification System (FLPIS). The objective of the study is to develop a change detection method that could be used as an aid in the updating of the FLPIS. The method is based on object-based interpretation, and it uses existing parcel boundaries and new aerial ortho images as input data. Rules for classifying field and non-field objects are defined automatically by using the classification tree method and
training data. Additional, manually created rules are used to improve the results. Classification tests carried out during the development work suggest that real changes can be detected relatively well. According to a recent visual evaluation, 96% of changes larger than 100 m2 were detected, at least partly. The overall accuracy of the change detection results was 93% when compared with reference data pixel-by-pixel. On the other hand, there are also missing changes and numerous false alarms. The main challenges encountered in the method development include the wide diversity of agricultural fields and other land cover objects locally, across the country, and at different times of the spring and summer, variability in the digital numbers (DNs) of the aerial images, the different nature of visual and automatic interpretation, and the small percentage of the total field area that has really changed. These challenges and possible solutions are discussed in the article.
* Corresponding author
1. INTRODUCTION
1.1 Background and objective of the study
Change detection is a crucial step in the updating of map databases, and its successful automation could increase the efficiency and accuracy of the process. Numerous studies on the topic have thus been carried out during recent years (e.g., Knudsen and Olsen, 2003; Walter, 2004; Steinnocher and Kressler, 2006; Holland et al., 2008). Development of change detection methods that are functional and reliable enough for operational work, however, is still a demanding task. This paper discusses the challenges of automated change detection from the viewpoint of one case study: the Finnish Land Parcel Identification System (FLPIS).
The FLPIS is a nationwide register maintained by the agricultural administration, and it is needed for the payment of farming subsidies. There are also LPIS systems in other countries of the European Union (EU). In Finland, about 1 150 000 field parcels have been digitized in the system. Changes occur in the parcels continuously, and there is thus need for regular updating of the register. The current updating process is based on visual checking and manual digitization of the parcels on the basis of new aerial ortho imagery. The process is laborious and susceptible to human errors. The Agency for Rural Affairs, which is maintaining the FLPIS, is thus interested in the possibility of using automated methods in the updating, especially in the checking phase.
Research on change detection of the FLPIS parcels began at the Finnish Geodetic Institute (FGI) in 2009. The objective is to
study the feasibility of automated change detection and to develop a method that could automatically detect parcels that need updating. After a literature survey and preliminary experiments with edge-based and object-based interpretation approaches, the research has concentrated on further development of the object-based method, which is well suited for detecting non-field objects (changes) inside existing parcels. The idea is that the change detection step would be automated, but checking and digitization of the detected changes would be carried by a human operator.
1.2 Previous literature
Many studies on segmentation and classification of agricultural fields from remotely sensed data can be found in the literature. Studies related to change detection or updating of existing LPIS systems or other agricultural field parcel databases, however, are not so many. Methods presented in these studies can be divided into two main groups: 1) methods focusing on field boundaries, and 2) methods focusing on the inside of the fields.
improved by using the “snakes” approach (Torre and Radeva, 2000; Butenuth and Heipke, 2005).
Heipke and Straub (1999) developed a method for automatically updating GIS vegetation areas from satellite imagery. The method used GIS data to automatically generate spectral signatures for vegetation areas, classified multispectral imagery, and integrated the results into a GIS. Oesterle and Hahn (2004) studied the updating of LPIS systems by using image classification and change detection. A classification case study using the eCognition software was presented. Ruiz et al. (2009) classified objects defined in agricultural and land cover databases. Different types of features were extracted for the objects, and decision trees were applied in the classification. The objective was to detect changes in the classes of the objects. Detection of changes in object boundaries was not discussed. Helmholz and Rottensteiner (2009) studied the verification of cropland and grassland objects. Also in this study, the interest was in the classes of objects. Recently, Buck et al. (2011) presented a two-scale approach for detecting changes in an LPIS. The method utilized aerial images and multitemporal satellite images, and the main idea was to detect non-vegetated areas inside parcels.
Overall, it seems that updating of agricultural field parcel databases is a topic that requires further research and method development. In particular, change detection methods feasible for operational updating workflows of parcel boundaries in different landscapes should be developed, and the quality of the methods should be studied using large areas and different datasets.
2. DATA
2.1 Input data for change detection
Data used in the operational updating process of the FLPIS and also available for our study include new aerial ortho images and existing FLPIS parcels in vector format. The aerial images are acquired with digital cameras and have four multispectral channels (red, green, blue, and near-infrared). Images from the Intergraph Digital Mapping Camera (DMC) and the Vexcel UltraCamXp have been used in our study. The images are available as pan-sharpened true colour and false colour ortho image mosaics with a pixel size of 0.5 m × 0.5 m. In the ortho rectification process, digital terrain models (DTMs) have been used. Nowadays, airborne laser scanning is used in Finland to create DTMs with a grid size of 2 m × 2 m. Each image file covers a map sheet of 6 km × 6 km. Numerous different map sheets have been used in the study. In the tests described in more detail in this article, images acquired with the DMC camera early in spring 2010 were used. At the time of imaging, most agricultural fields were still without vegetation. This is currently the typical season to acquire images for the updating process, which means that methods based on detecting vegetated and non-vegetated areas are not feasible.
2.2 Training points
Training sites with reference points are used to create classification rules. Until now, three training sites, each with 2000–3000 points, have been established in southern Finland. The training site in Siuntio was used in the tests described in this article. Training points in this area were picked manually on the basis of aerial ortho imagery and parcel boundaries.
Points were located inside homogeneous regions and picked from three classes: field, shadows (in the field), and non-field. Shadow points were picked separately to allow their specific
analysis, but field and shadow points together represent the
class field in the classification. Non-field points include any
other objects, e.g., trees, roads, buildings, and water. The possibility of creating training areas automatically using the FLPIS or other map database was also considered, but manual selection proved to be a better choice. For example, not all fields and meadows are included in the FLPIS database, and the use of the outside areas as training data for non-field would thus
lead to problems. When reference points are selected manually, it is also easy to avoid areas that are not up-to-date in the database.
2.3 Reference data
Numerical pixel-based quality evaluations presented in the article were carried out within three map sheets near Kirkkonummi in southern Finland. The boundaries of the parcels in the FLPIS system were carefully checked and improved at the Agency for Rural Affairs to create a reliable reference dataset. The reference dataset was created early in 2010 using aerial ortho images acquired in 2008. Unfortunately, the reference digitization was thus not completely up-to-date compared to the 2010 images used in the latest tests. Many real changes do not occur in parcel boundaries in two years, but the 2008 images were taken later in the growing season, and the appearance of these images was thus significantly different from the 2010 images. For example, some changes compared to an old version of the database were clearly visible in the 2008 images, but not clear in the 2010 images. Parcels with clear changes between 2008 and 2010, such as new buildings, were excluded from the quality evaluation.
3. METHOD FOR CHANGE DETECTION
The change detection method under development is based on region-based segmentation and classification of aerial ortho imagery inside existing parcel boundaries. The main objective is to detect non-field objects (i.e., changes) inside parcels. The analysis concentrates on existing parcels because this is the topic of main interest for the agricultural administration, but the method could be extended to also detect extensions of parcels and new parcels. The method has been implemented with the eCognition (Trimble Geospatial, 2012) and Matlab (The Mathworks, 2012) software.
The first step of the process is segmentation of aerial imagery into homogeneous regions using the multiresolution segmentation method of eCognition (Baatz and Schäpe, 2000). The segments are then classified into classes field and non-field. Non-field objects inside parcels are further classified as changed areas. Rules for classifying field and non-field
segments are created automatically by using the classification tree (decision tree) method presented by Breiman et al. (1984). Classification tree tools in the Matlab Statistics toolbox have been used for creating a classification tree, and the rules in the tree have then been implemented manually in the analysis process in eCognition.
following attributes were provided as input data for the method: mean values, standard deviations and ratios (i.e., mean value in one channel divided by the sum of the mean values in all channels) calculated from different channels; brightness (i.e., mean value of the mean values in the different channels); and the normalized difference vegetation index (NDVI). The method constructs a binary classification tree by repeated splitting of training data (for details of the method, see Breiman et al., 1984). The best attribute and threshold value are selected for each node of the tree by using a splitting criterion (Gini diversity index in our study). Pruning is used to avoid overfitting of training data. The same classes, i.e., field and non-field, are typically represented by several terminal nodes in the
final classification tree, which means that alternative classification rules lead to the same classification result. For example, a non-field segment belonging to a road and a non-field segment belonging to a forest can be recognized as non-field on the basis of different rules. This is carried out
automatically on the basis of the attributes of the segments, without specifying sub-classes. In our approach, training segments for the classification tree method are defined by using training points. If there is a point inside a segment, the entire segment is assumed to belong to the class defined by the point. This approach is flexible and allows the same point set to be applied to different images and segmentations (Matikainen and Karila, 2011).
In the first results, there are typically plenty of false alarms. Additional rules have been developed manually to further analyse changed objects and to reclassify some of them as field.
These postprocessing rules are used to merge changed segments
with their neighbouring field segments on the basis of spectral
similarity. A changed segment can also be classified as field if it
is spectrally similar to the entire field parcel (mean values compared). These rules help to avoid false alarms related to variation within fields. Attempts have also been made to define specific rules for objects that should be detected as changes (ditches, non-field vegetation such as trees or bushes) and objects that should be bypassed (shadows, stripe-like features in fields). The problem, however, is that while these rules correct the classification in many cases, they also produce new misclassifications. For example, some detected real changes are classified as shadows and thus lost. The results presented in this article were produced without object-specific rules, unless otherwise mentioned.
4. CHANGE DETECTION TESTS AND RESULTS
The development of the method has been an iterative process with several tests in different areas. The most intensively used study areas are located in southern Finland (Kirkkonummi and Vihti areas). The results have been evaluated both at the Agency for Rural Affairs and at the FGI. On the basis of visual and numerical analyses, further improvements of the method, especially of the postprocessing rules, have been carried out. Figure 1 shows some examples of correctly detected changes, missing changes and false alarms with the current version of the method in the Kirkkonummi study area.
Table 1 shows a confusion matrix and accuracy estimates from a numerical pixel-based comparison of the results with the reference digitization (see Section 2.3). An old version of the FLPIS database (older than the reference dataset) was used as
input data for change detection. Pixels located inside parcels in the old database were analysed in the quality evaluation. If a pixel was not located inside field parcels in the reference (new) dataset, it was considered as changed and should have been
detected in change detection. The pixel-based comparison provides basic information on the quality of the automated classification when compared directly with the reference digitization.
Table 1. Numerical pixel-based comparison of change detection results with a reference dataset (Compl. is completeness, Corr. is correctness, and Mean acc. is mean accuracy).
Change detection
Reference
Unchanged field
Changed Sum Corr.
Unchanged field
57695563 580179 58275742 99.0%
Changed 3860976 615180 4476156 13.7%
Sum 61556539 1195359 62751898 Compl. 93.7% 51.5%
Mean acc. 96.3% 21.7%
Overall acc. 92.9%
To obtain more information on the percentage of detected changes, a visual analysis of the results in the Kirkkonummi study area was also carried out. A total of 100 changes (located within parcels in the old database but outside parcels in the reference database) were analysed. Because of the different acquisition years of the images used in the change detection tests (2010) and the images used in the digitization of the reference dataset (2008), an additional analysis on the visibility of the changes in the 2010 ortho images was carried out. The changes in the reference dataset were divided into categories:
clearly visible, visible (to some extent) and not visible in the
2010 images. The analysis was also carried out separately for larger and smaller changes (threshold value 100 m2). The results of the analysis are presented in Table 2.
Table 2. Visual analysis on the number and percentage of real changes detected in the change detection.
Change in the reference dataset
Clearly visible
Visible Not visible All
Area > 100 m2
Mostly detected 28 (78%) 5 (42%) 1 (50%) 34 (68%) Partly detected 7 (19%) 6 (50%) 1 (50%) 14 (28%) Not detected 1 (3%) 1 (8%) 0 2 (4%)
Sum 36 12 2 50
Area < 100 m2
Mostly detected 16 (70%) 8 (44%) 0 (0%) 24 (48%) Partly detected 4 (17%) 7 (39%) 2 (22%) 13 (26%) Not detected 3 (13%) 3 (17%) 7 (78%) 13 (26%)
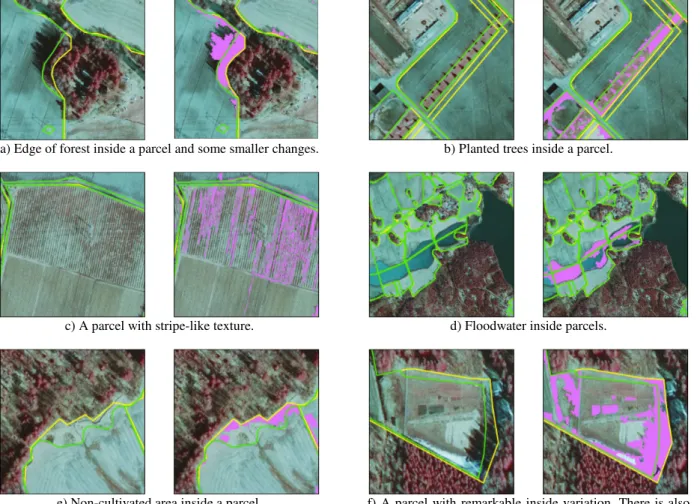
a) Edge of forest inside a parcel and some smaller changes. b) Planted trees inside a parcel.
c) A parcel with stripe-like texture. d) Floodwater inside parcels.
e) Non-cultivated area inside a parcel. f) A parcel with remarkable inside variation. There is also some non-cultivated area and some snow inside the parcel.
Figure 1. Examples of detected changes, missing changes and false alarms. In each image pair, the left picture shows the false colour aerial ortho image, existing parcel boundaries in the old version of the FLPIS database (yellow lines), and desired boundaries according to reference data (green lines). The right picture shows automatically detected changes (violet areas). Aerial ortho images, copyright © National Land Survey of Finland, 2010. Parcel boundaries, copyright © Agency for Rural Affairs.
Another visual analysis of the results was carried out at the Agency for Rural Affairs. The change detection results for part of one map sheet in the Vihti study area were evaluated, and the correctness of each detected change was determined. The evaluation also showed if a given change would be corrected in the current manual updating process of the FLPIS. For example, small changes are not corrected. A summary of this analysis is presented in Table 3. It should be noted that this analysis was carried out with an earlier version of the change detection method, which also contained some object-specific rules (see Section 3).
Table 3. Visual analysis on the correctness of automatically detected changes (not the newest version of the method).
Correctness of detected changes
Correct 106 (27%)
Partly correct 53 (14%)
Incorrect (false alarm) 230 (59%)
Correction of detected changes in the current manual updating process
Would be corrected 46 (12%)
Would be partly corrected 62 (16%)
Would not be corrected 281 (72%)
5. DISCUSSION
5.1 Results of change detection tests
A high detection percentage of changes is a prerequisite for using an automated change detection method in an operational updating process. Classification tests carried out during the development work suggest that real changes can be detected relatively well with the developed method. According to the visual evaluation presented in Table 2, 96% of all large changes and 97% of clearly visible large changes were mostly or partly detected. For smaller changes, the detection percentages were lower, as expected. In the numerical evaluation (Table 1), the detection percentage for changes was lower than in the visual evaluation (completeness 51.5%). This comparison was pixel-based and thus analysed every pixel inside the parcels. Many changes in the reference data result from small corrections in the position of the boundary and are difficult to detect similarly in the automatic classification. The different acquisition times of the images used for change detection and reference digitization also had some effect. In addition, the vectors represent generalized information compared to image data. An example of this can be seen in Figure 1 b. Most trees inside the parcel have been correctly classified as changed, which would
the parcel. Numerically, however, the area classified as changed
does not cover the entire plantation area.
According to the reference data, the area that had really changed covered only about 2% of the total area of the parcels. This means that the false detection rate easily becomes high, i.e., the correctness of changes can be low, even if the classification works well. The overall accuracy of the change detection results was about 93% (Table 1). The completeness of
unchanged fields was about 94%, i.e., only 6% of them were
misclassified as changed. However, this resulted in a much
larger number of changed pixels than the detected real changes,
and the correctness of changes was only about 14%. More
generally, this result shows how the accuracy for an individual class in classification can be low even if the overall accuracy is high. The visual evaluation carried out at the Agency for Rural Affairs (Table 3) gave a slightly more positive result regarding the correctness of changes. It was found that 41% of them were
correct or partly correct. On the other hand, only 28% of detected changes were so remarkable that they would be corrected in the current updating process, at least partly. In practice, the low correctness would diminish the efficiency of the method because a human operator would need to check a large number of false alarms. On the other hand, this might still be less laborious than visually searching for all changes. Large numbers of false alarms have also been observed in some other change detection studies (Knudsen and Olsen, 2003; Holland et al., 2008). Holland (2010) suggested that a correctness of 40% could be sufficient for automated change detection.
5.2 Challenges in method development
An important reason for the remaining classification errors is the wide diversity of agricultural fields and other objects in the images. In images taken early in the spring, there is not much vegetation in fields. Instead, the variation is related, for example, to different soil types, tilling practices, moisture conditions, ditches, and remaining (dead or green) vegetation from the previous season. Some fields can even be covered with floodwater (see Figure 1 d). Such variations become easily classified as changes. This can be a logical classification result,
but considering the desired results of the change detection process, these changes are false alarms. Around the edges of
fields, false alarms can also be caused by tree canopies above the field and shadows of nearby trees. Shadow points are included in the training data of fields, but all shadows are not
correctly classified. Regarding real changes, objects such as roads, non-cultivated field edges and leafless deciduous vegetation can be difficult to distinguish from non-vegetated fields. Some areas that should be bypassed as belonging to fields are actually very similar to some areas that should be detected as changes (see Figure 1 e).
Some images used in the updating work are obtained later in the growing season, and their appearance is significantly different from the early images. There are also local differences in the typical appearance of fields across the country. An important reason for variation in images is also that the images have not been radiometrically calibrated. There are thus differences in the digital numbers (DNs) within individual images, between images, and between different sensors. In the future, the feasibility of using radiometrically calibrated imagery should be investigated to reduce this variation. Different rule sets, however, are probably needed for different times of the growing season. It would also be useful to establish more training sites
in different parts of the country. More research is needed on the number of required training sites and rule sets.
One problem encountered in the method development is the different nature of visual and automatic interpretation. The current processes used when selecting parcels for updating and when digitizing the changes are based on human judgement. There are instructions available for manual digitization, but not exact mathematical criteria that could be applied in the automated method. The acquisition of feasible reference data has also appeared to be laborious. The results of the normal updating process cannot be directly applied. For example, small changes or discrepancies between the database and imagery are not corrected in the normal process. Numerical comparison of the automatically produced results with the updated database would thus give somewhat misleading information on the accuracy.
The ultimate objective of the method development has been a parcel-based classification dividing the parcels into acceptable
and changed parcels. Our current results suggest that
parcel-based classification will be difficult due to the false alarms and the small percentage of the total area that has really changed. Practically, some changes are detected in almost every parcel. However, if parcel-based decisions cannot be made automatically, the individual segments classified as changed
might give useful information for human operators in the updating work. Ideally, visual inspection of the entire area could be avoided. Further research and practical tests are needed to investigate how the results could be best exploited in the updating process. Further information is also needed on the quality of the results, considering operational requirements. Tests should be carried out by using different input images and training sites from different parts of the country.
The results presented in this article were based on interpretation of aerial image data alone. We have also carried out some development and testing by using height data from airborne laser scanning. As expected, the laser scanner data were effective for the detection of high non-field objects, such as trees and buildings. On the other hand, they cannot be used to detect roads or other changes that have the same height as the surrounding field. Currently, the research concentrates on aerial images because up-to-date laser scanner data do not cover the entire country and because it seemed that most changes can also be detected from aerial imagery. Further research, however, could be carried out to develop more advanced methods for combined analysis of aerial image and laser scanner data. For example, laser scanner data could be helpful to recognize some of the detected changes as false alarms.
6. CONCLUSIONS
An automated change detection method for the updating of field parcels for LPIS is under development. Classification tests carried out during the development work suggest that real changes can be detected relatively well. The main problem is the large percentage of false changes. Overall, development of an automated change detection method for an operational, country-wide application has proved to be a challenging task. The main challenges include:
• The wide diversity of agricultural fields and other land cover objects locally, across the country, and at different times of the spring and summer.
• The different nature of visual and automatic interpretation.
• The small percentage of the total field area that has really changed.
Our approach attempts to take the variation in objects into account by using training sites with a large number of reference points. These are used to create classification rules automatically. In the future, different rule sets can be created for different parts of the country and for different times of the growing season. The possibility of using radiometrically calibrated imagery should be investigated to reduce the variation in images. The method could be further developed, for example, by combined analysis of aerial image and laser scanner data.
Further research and practical tests are needed to investigate how the results could be best exploited in the updating process. More information is also needed on the quality of the results, considering operational requirements.
REFERENCES
Baatz, M., Schäpe, A., 2000. Multiresolution segmentation – an optimization approach for high quality multi-scale image segmentation. In: Strobl, J., Blaschke, T., Griesebner, G. (Eds.),
Angewandte Geographische Informationsverarbeitung XII: Beiträge zum AGIT-Symposium Salzburg 2000, Wichmann,
Heidelberg, pp. 12-23.
Breiman, L., Friedman, J. H., Olshen, R. A., Stone, C. J., 1984.
Classification and regression trees. Wadsworth, Inc., Belmont,
California, 358 p. (The Wadsworth Statistics/Probability Series.)
Buck, O., Peter, B., Büker, C., 2011. Zwei-skaliger Ansatz zur Aktualisierung landwirtschaftlicher Referenzkulissen (LPIS).
Photogrammetrie – Fernerkundung – Geoinformation, 5/2011,
pp. 339-348.
Butenuth, M., Heipke, C., 2005. Network snakes-supported extraction of field boundaries from imagery. In: Kropatsch, W., Sablatnig, R., Hanbury, A. (Eds.), Proceedings of the 27th DAGM Symposium, Springer-Verlag, Berlin, pp. 417-424.
Heipke, C., Straub, B.-M., 1999. Towards the automatic GIS update of vegetation areas from satellite imagery using digital landscape model as prior information. In: International Archives of Photogrammetry and Remote Sensing, München,
Germany, Vol. 32, Part 3-2W5, pp. 167-174.
Helmholz, P., Rottensteiner, F., 2009. Automatic verification of agricultural areas using IKONOS satellite images. In:
International Archives of Photogrammetry, Remote Sensing and Spatial Information Sciences, Hannover, Germany, Vol.
XXXVIII, Part 1-4-7/W5.
Holland, D., 2010. Change detection questionnaire results. In: EuroSDR Workshop – Automated change detection for updating national databases.
http://www.eurosdr.net/workshops/cd_2010/p-10.pdf (accessed 9 Jan. 2012).
Holland, D. A., Sanchez-Hernandez, C., Gladstone, C., 2008. Detecting changes to topographic features using high resolution
imagery. In: International Archives of Photogrammetry, Remote Sensing and Spatial Information Sciences, Beijing, China, Vol.
XXXVII, Part B4, pp. 1153-1158.
Janssen, L., 1993. Methodology for updating terrain object data from remote sensing data; the application of Landsat TM data with respect to agricultural fields. Doctoral thesis, Wageningen Agricultural University, Wageningen, The Netherlands.
Knudsen, T., Olsen, B. P., 2003. Automated change detection for updates of digital map databases. Photogrammetric Engineering & Remote Sensing, 69(11), pp. 1289-1296.
Löcherbach, T., 1998. Fusing raster- and vector-data with applications to land-use mapping. Inaugural-Dissertation, Hohen Landwirtschaftlichen Fakultät, Rheinischen Friedrich-Wilhelms-Universität, Bonn.
Matikainen, L., Karila, K., 2011. Segment-based land cover mapping of a suburban area—comparison of high-resolution remotely sensed datasets using classification trees and test field points. Remote Sensing, 3(8), pp. 1777-1804.
Oesterle, M., Hahn, M., 2004. A case study for updating Land Parcel Identification Systems (IACS) by means of remote sensing. In: International Archives of Photogrammetry, Remote Sensing and Spatial Information Sciences, Istanbul, Turkey,
Vol. XXXV, Part B2, pp. 515-520.
Ruiz, L. A., Recio, J. A., Hermosilla, T., Fdez-Sarría, A., 2009. Identification of agricultural and land cover database changes using object-oriented classification techniques. In: Proceedings of the 33rd International Symposium on Remote Sensing of Environment, Stresa, Italy.
Steinnocher, K., Kressler, F., 2006. Change detection, Final report. In: EuroSDR Official Publication No 50, pp. 111-182.
The MathWorks, 2012. http://www.mathworks.com/
Torre, M., Radeva, P., 2000. Agricultural field extraction from aerial images using a region competition algorithm. In:
International Archives of Photogrammetry and Remote Sensing, Amsterdam, The Netherlands, Vol. XXXIII, Part B3,
pp. 889-896.
Trimble GeoSpatial, 2012. http://www.ecognition.com/
Walter, V., 2004. Object-based classification of remote sensing data for change detection. ISPRS Journal of Photogrammetry & Remote Sensing, 58, pp. 225-238.
ACKNOWLEDGEMENTS