www.atmos-chem-phys.net/8/4061/2008/ © Author(s) 2008. This work is distributed under the Creative Commons Attribution 3.0 License.
Chemistry
and Physics
Impact of the new HNO
3
-forming channel of the HO
2
+
NO reaction
on tropospheric HNO
3
,
NO
x
,
HO
x
and ozone
D. Cariolle1,2, M. J. Evans3, M. P. Chipperfield3, N. Butkovskaya4, A. Kukui5, and G. Le Bras4
1Centre Europ´een de Recherche et Formation Avanc´ee en Calcul Scientifique, Toulouse, France 2M´et´eo-France, Toulouse, France
3Institute for Climate and Atmospheric Science, School of Earth and Environment, University of Leeds, Leeds, UK 4Institut de Combustion, A´erothermique, R´eactivit´e et Environnement, CNRS, Orl´eans, France
5Service d’A´eronomie, IPSL, CNRS, Paris, France
Received: 4 December 2007 – Published in Atmos. Chem. Phys. Discuss.: 11 February 2008 Revised: 24 June 2008 – Accepted: 2 July 2008 – Published: 25 July 2008
Abstract. We have studied the impact of the recently
ob-served reaction NO+HO2→HNO3 on atmospheric
chem-istry. A pressure and temperature-dependent parameteri-sation of this minor channel of the NO+HO2→NO2+OH
reaction has been included in both a 2-D stratosphere-troposphere model and a 3-D tropospheric chemical transport model (CTM).
Significant effects on the nitrogen species and hydroxyl radical concentrations are found throughout the troposphere, with the largest percentage changes occurring in the tropi-cal upper troposphere (UT). Including the reaction leads to a reduction in NOxeverywhere in the troposphere, with the
largest decrease of 25% in the tropical and Southern Hemi-sphere UT. The tropical UT also has a corresponding large increase in HNO3of 25%. OH decreases throughout the
tro-posphere with the largest reduction of over 20% in the trop-ical UT. The mean global decrease in OH is around 13%, which is very large compared to the impact that typical pho-tochemical revisions have on this modelled quantity. This OH decrease leads to an increase in CH4lifetime of 5%. Due
to the impact of decreased NOxon the OH:HO2partitioning,
modelled HO2 actually increases in the tropical UT on
in-cluding the new reaction. The impact on tropospheric ozone is a decrease in the range 5 to 12%, with the largest impact in the tropics and Southern Hemisphere. Comparison with observations shows that in the region of largest changes, i.e. the tropical UT, the inclusion of the new reaction tends to
Correspondence to: D. Cariolle
(daniel.cariolle@cerfacs.fr)
degrade the model agreement. Elsewhere the model compar-isons are not able to critically assess the impact of including this reaction. Only small changes are calculated in the minor species distributions in the stratosphere.
1 Introduction
It is well established that the reaction of HO2with NO plays
a central role in atmospheric chemistry:
NO+HO2→OH+NO2 (R1)
In the stratosphere, this reaction moderates the effectiveness of the cycle involving HOx(OH,HO2)radicals that is an
im-portant removal mechanism of ozone (see e.g. Wayne, 2000). In the troposphere Reaction (R1) plays a key role in con-trolling the interconversion between HO2 and OH radicals
through cycles involving the reactions:
OH+CO(+O2)→HO2+CO2 (R2)
OH+VOCs(+O2)→HO2+products (R3)
The VOCs include methane, non-methane hydrocarbons and other volatile carbon-containing species. Reaction (R1) is a secondary source of the OH radical (the major tropospheric oxidant), as well as the major source of tropospheric ozone through the conversion of NO to NO2 followed by NO2
3,0 3,2 3,4 3,6 3,8 4,0 4,2 4,4 4,6 4,8 0,0
0,2 0,4 0,6 0,8 1,0 1,2
600 Torr 500 Torr 400 Torr 300 Torr 200 Torr 100 Torr
E
1000/T (K)
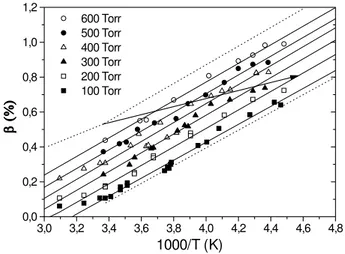
Fig. 1. Pressure and temperature dependences ofβ=kR1b/ kR1 in
percent. Upper and lower dotted lines represent extrapolation to
P=760 andP=50 Torr, respectively. The arrow corresponds to
typicalβvalues as a function of altitude from the Earth’s surface
to the tropopause region.
OH+NO2+M→HNO3+M (R4)
Another potential significant chain termination reaction is the minor HNO3-forming channel of the reaction of HO2
with NO that has been observed in laboratory experiments by Butkovskaya et al. (2005):
HO2+NO→HNO3 (R1b)
The branching ratio, or rate constant ratio,β=kR1b/ kR1, for
the new Reaction (R1b) was found to range from ∼0.2 to 0.8% from 300 K to 200 K, at a pressure of 200 Torr. These first data led to the suggestion that Reaction (R1b) could be a significant loss process of HOxradicals in the upper
tropo-sphere. To assess the potential importance of Reaction (R1b) throughout the troposphere, it appeared necessary to deter-mine the branching ratioβover the full range of tropospheric pressures and temperatures in order to provide a parametri-sation ofβ for atmospheric modelling.
In this paper we first briefly report the experimental measurements of β as a function of pressure and tem-perature in the ranges 70–600 Torr and 220–320 K. Then, we present 2-D and 3-D model calculations of the im-pact of Reaction (R1b) on the tropospheric abundances of HNO3,HOx,NOxand ozone by including the
parametrisa-tion equaparametrisa-tion ofβobtained from the laboratory experiments. Finally, the model results are compared with observations.
2 Laboratory experiments
The HNO3-forming channel of the HO2+NO reaction has
been investigated using a turbulent flow reactor (TFR) cou-pled to a chemical ionisation mass spectrometer (CIMS). The
experimental set up has previously been described in de-tail (Butkovskaya et al., 2005). Briefly, the required high flowrates (60 to 150 SLPM) are obtained by flowing N2
car-rier gas from a liquid nitrogen tank. The working pressure and temperature ranges in the TFR are 70–600 Torr and 220– 320 K, respectively. The HO2radicals were produced by
re-action of H atoms with O2. The species of interest in the
re-active system, HO2,OH,NO2and HNO3, were detected by
CIMS from their reaction with the SF−6 ion. The branching ratio of Reaction (R1),β =kR1b/ kR1, was obtained by
mea-suring the concentration ratio of the HNO3and NO2products
from channels (R1b) and (R1), respectively.
The calibration procedure of the CIMS signals of HNO3
and NO2is described in detail by Butkovskaya et al. (2007).
In order to increase the signal intensity of produced HNO3,
which was a critical factor in reducing experimental uncer-tainties, the signal was chemically amplified by adding high concentrations of CO and O2into the TFR. The chain
mecha-nism (Reactions R1 and R2) that occurred in the TFR is sim-ilar to that occurring in chemical amplifiers used to measure peroxy radicals in the atmosphere (e.g. Cantrell and Sted-man, 1982). In addition, CO in Reaction (R2) acts as a scav-enger of OH produced in Reaction (R1), preventing forma-tion of HNO3 in the secondary reaction of OH with NO2
(Reaction R4). The HNO3 formation in the OH+NO2
re-action contributed up to 10% of the yield from HO2+NO
reaction at typical concentrations of CO, O2 and NO used
in these experiments, as also calculated by numerical simu-lation of the kinetics in the reactor (see Butkovskaya et al., 2007 for details).
The branching ratioβwas measured at different pressures and temperatures in the ranges 70–600 Torr and 223–323 K. The pressure and temperature dependencies ofβ are shown in Fig. 1. In the 298–223 K range the temperature depen-dences for different pressures present a set of nearly paral-lel straight lines. The linear fit fails at temperatures higher than 298 K, where curvatures were observed forP=100, 200 and 400 Torr. Below 298 K the whole set of data can be de-scribed by the simple three-parameter expression of the gen-eral form:
β(P , T )=a/T +bP+c (1)
Coefficientawas found by averaging the slopes of the ob-served temperature dependencies. Coefficientsbandcwere determined by standard two-parameter least-square fit of the data. The numerical expression ofβin percent can be written as:
β(P , T )=kR1b/ kR1=(530±20)/T (K)
+(6.4±1.3)×10−4P (Torr)−(1.73±0.07) (2) (with 2σ uncertainties). The rate constant kR1b has been
derived from this equation by considering the recommended value kR1=3.5×10⁻¹²exp(250/T )cm3molecule−1s−1
recommended value and the one recommended by the IUPAC panel (Atkinson et al., 2004, updated 2006) are very similar, the IUPAC one being higher by only 14% at 200 K and 10% at 300 K.
3 Model calculations
We have used two atmospheric chemical models to in-vestigate the impact of Reaction (R1b) on atmospheric chemistry. Using the 2-D (latitude-height) stratosphere-troposphere MOBIDIC model (Cariolle and Brard, 1984) it is possible to evaluate the significance of Reaction (R1b) on the global chemical cycles. It is found that this reaction is im-portant in the free troposphere to control the NOxand HOx
radical contents and the ozone concentration at low latitudes. We have also used the GEOS-CHEM 3-D tropospheric chemical transport model (e.g. Evans et al., 2005). This model has a more detailed treatment of tropospheric chemi-cal processes and allows an assessment of the impact of Re-action (R1b) under a wider range of conditions and a more critical comparison against tropospheric observations. 3.1 Model simulations and impact on species distributions The MOBIDIC model has been recently updated to include the Sander at al. (2006) compilation for the reaction rates of atmospheric interest. The dynamical forcing and the numer-ical scheme for the transport of minor trace species have also been updated (Cariolle and Teyss`edre, 2007).
To investigate the impact of Reaction (R1b) two simu-lations have been performed. The control simulation (re-ferred to as run CON2D) does not include Reaction (R1b) while simulation NEW2D includes Reaction (R1b) with kR1b=β×kR1 andβ given by Eq. (2). Each simulation was
integrated over 8 years. The model outputs are compared for the last simulated year when steady-state is reached.
The GEOS-CHEM 3-D tropospheric CTM has been used for a number of studies focused on tropospheric O3-OH-NOx
budgets (e.g. Bey et al., 2001; Evans and Jacob, 2005 and ref-erences therein). The GEOS-CHEM model is driven by as-similated winds calculated by the Goddard Earth Observing System at 4◦×5◦horizontal resolution and 30 levels in the
vertical. Surface sources of NOxare 42 Tg N yr−1
(anthro-pogenic, biomass burning and soil) while upper troposphere sources amount to 4 Tg N y−1(lightning and aircraft). The model description is given by Bey et al. (2001).
In this study we have used the same model version as Evans and Jacob (2005) who investigated the impact of new laboratory studies on the aerosol hydrolysis of N2O5. In that
study Evans and Jacob found that the newer slower rate of conversion of N2O5to HNO3on aerosols increased the
av-erage tropospheric budgets of NOx (by 7%), O3(4%), and
OH (8%), bringing the model into better agreement with
ob-servations. Here we repeat the approach of Evans and Ja-cob (2005) and include Reaction (R1b).
The 3-D model was run for 2 simulations of 2 years each. The control run (CON3D) was similar to a run from Evans and Jacob (2005) using the aerosol parameters from their Ta-ble 1. Run NEW3D was the same as run CON3D but in-cluded Reaction (R1b) in the same way as for the MOBIDIC model. The first year of the model run was treated as a spin up and results from the second year were used for analysis. 3.1.1 Impact on nitrogen species
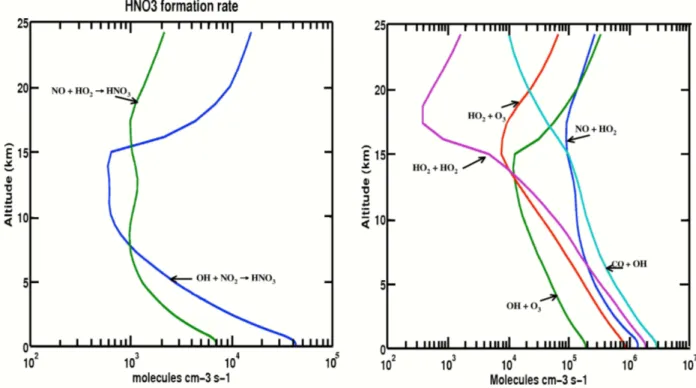
Figure 2a shows the rate of HNO3 formation by
Reac-tion (R1b) and by ReacReac-tion (R4) between NO2 and OH
at the equator in March using output from run NEW2D. It appears that Reaction (R1b) becomes a significant chan-nel for HNO3 formation between 7 to 16 km in the cold
upper troposphere region. The ratio Ra between the rates of HNO3 formation by these 2 reactions is equal to:
Ra=([NO].[HO2]/[NO2].[OH]).(kR1b/ kR4). The first term
of the product corresponds to an “atmospheric” component that depends on the NOx and HOx profile concentrations.
This term increases from a value of 40 at ground level to a peak value of about 220 at 10 km. The second termkR1b/ kR4
shows an increase from 0.004 at ground level to 0.01 at 15 km. The differences in the altitude profiles of NOxand HOx
appears as important as the temperature dependency of the Reaction (R1b) to determine its effectiveness. Both terms act in the same direction, so the HNO3 concentration increases
from ground to the UT when Reaction (R1b) is introduced in the 2-D model.
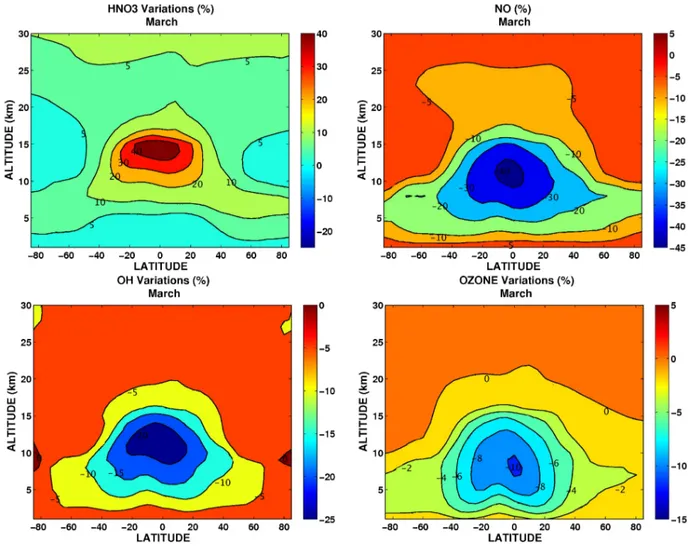
Figure 3 shows the variations in the HNO3
concentra-tion between 2-D model runs NEW2D and CON2D for the month of March. The relative effect is largest at the cold equatorial tropopause with an increase over 30%. HNO3
in-creases by about 10% in the lower stratosphere and by up to more than 100% in the upper stratosphere. However, the HNO3 concentrations are quite small compared to those of
the other NOy species, so we expect little impact of
Reac-tion (R1b) at those altitudes.
The increase in the HNO3 concentration by
Reac-tion (R1b) changes the ratio between NOxand HNO3. Model
results show that the concentrations of NOxdecreases by 20
to 30% in the troposphere. In particular Fig. 3 shows that the NO concentration decreases by more than 30% at low latitudes in the middle-upper troposphere.
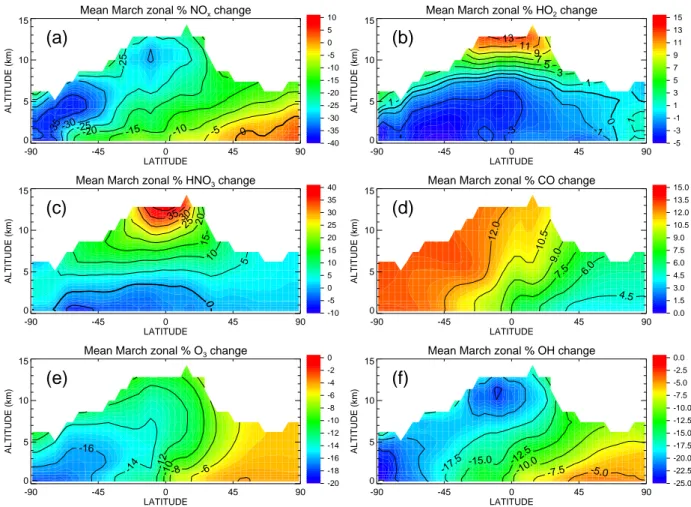
Equally, Fig. 4 shows the zonal mean differences between runs CON3D and NEW3D for selected species in March. In run NEW3D NOxdecreases everywhere ranging from−5%
in the Northern Hemisphere (NH) mid-latitudes to −35% in the tropical and Southern Hemisphere (SH) upper tropo-sphere (UT). The 3-D model shows more latitudinal variation in the modelled NOxresponse than the 2-D model. In the
3-D model, near the surface, the smallest relative NOxdecrease
Fig. 2. Left panel (a): rate of formation of HNO3at the equator for March calculated from the 2-D model run NEW2D for the reactions
OH+NO2(blue line) and NO+HO2(green line). Right panel (b): rate of the main reactions that control the conversion between OH and
HO2at the equator calculated from the 2-D model for the same month.
close to emissions sources. In the Southern Hemisphere, away from fresh pollution, the long transport timescales for NOx allow a larger impact of Reaction (R1b). The 2-D
model, with its simpler treatment of the troposphere, misses this effect partly because of specification of fixed surface mixing ratios in the 2 runs. Except very near the surface, HNO3increases everywhere in the 3-D model and by up to
35% in the tropical UT. Overall, the MOBIDIC and GEOS-CHEM models exhibit similar responses to the introduction of reaction (R1b).
3.1.2 Impact on HOxspecies
These perturbations in the nitrogen species budget impact the distribution of HOx. Figure 2b shows the rates of the main
reactions that control the OH:HO2 ratio. As can be seen,
Reaction (R1) is a major player controlling this ratio in the middle troposphere – lower stratosphere at the equator (5– 20 km). Consequently, the tropospheric NO decrease due to Reaction (R1b) tends to slow down the conversion of HO2to
OH by Reaction (R1).
The global tropospheric OH budget is difficult to estab-lish. It results from a delicate balance between production processes dominated by water vapour, methane and acetone (e.g. Arnold et al., 2004) decompositions and destruction by reactions involving HOx radicals that form back water
vapour. As discussed by Butkovskaya et al. (2005) an ad-ditional effect of Reaction (R1b) is to decrease the HOx
con-centrations. Larger HNO3concentrations are formed that are
subsequently washed out, thus removing a larger part of the HOxradicals. In addition, the HOxremoval by the reaction
between OH and HNO3can also be enhanced.
The net effect in the MOBIDIC model simulations is a decrease of the OH concentration by about 10 to 20% in the middle and upper troposphere for latitudes lower than 40◦ (Fig. 3), and a smaller increase of the HO2concentration by
10% in the upper troposphere at the same latitudes between 10 to 15 km.
The GEOS-CHEM model shows a response consistent with the MOBIDIC model with however a larger contrast be-tween the two hemispheres. The OH concentration decreases by−6% at the surface at NH mid-latitudes, by−15% at SH mid-latitudes, but as much as−20% in the tropical UT. How-ever, the decrease in NOx modifies the OH:HO2 ratio and
tends to increase the HO2 concentration in some locations,
e.g. the tropical UT, even though the overall net HOx
pro-duction is reduced.
In run CON3D the mass-weighted global annual mean tropospheric OH is 1.12×106cm−3 and becomes 0.97×106cm−3 in run NEW3D, a decrease of 13%. This is a very large relative change as modelled mean OH is a quantity that is typically well buffered against changes as revisions to model HOx photochemistry are implemented.
Fig. 3. Differences (%) in the concentration of HNO3(upper left), NO (upper right), OH (lower left) and O3(lower right) between 2-D
model runs NEW2D and CON2D for the month of March. Negative contours indicate smaller values in run NEW2D.
within the range of mean OH values derived from methyl-chloroform observations: 1.07+0.09/−0.17×106 (Krol et al., 1998), 1.16±0.17×10⁶ (Spivakovsky et al., 2000) and 0.94±0.13×106cm−3(Prinn et al., 2001). Those figures are consistent with recent evaluations by Bloss et al. (2005) that give a mean northern and southern hemispheric OH con-centrations of 0.91×106cm−3and 1.03×106cm−3
respec-tively, evaluations in very good agreement with the mean value in NEW3D.
The OH decrease will slow the destruction rates of im-portant long-lived species which are sources of radicals or have large global warming potentials. For instance, CH4
con-tributes significantly to the atmospheric greenhouse forcing. The major sink of CH4is its reaction with OH:
CH4+OH→CH3+H2O (R5)
The CH4chemical lifetime,τCH4, can therefore be evalu-ated by dividing its total atmospheric content by the integra-tion over the whole domain of its destrucintegra-tion rate:
τCH4 =
R
[CH4].dv
R
kOH+CH4[OH][CH4].dv
Evaluations ofτCH4 from the MOBIDIC outputs give a lifetime of 9.6 years for run CON2D and 10.1 years for run
NEW2D. Thus, the CH4lifetime is increased by about 5%
when Reaction (R1b) is introduced in the model. 3.1.3 Impact on tropospheric ozone
These perturbations in the HOxand NOx distributions have
an impact on the tropospheric O3budget. Ozone production
Mean March zonal % OH change
-90 -45 0 45 90
LATITUDE 0 5 10 15 ALTITUDE (km)
-17.5 -15.0 -12.5-10.0 -7.5 -5.0
(f)
-25.0 -22.5 -20.0 -17.5 -15.0 -12.5 -10.0 -7.5 -5.0 -2.5 0.0Mean March zonal % HO2 change
-90 -45 0 45 90
LATITUDE 0 5 10 15 ALTITUDE (km) -3 -1 1 1 1 3 5 7 9 11 13 0
(b)
-5 -3 -1 1 3 5 7 9 11 13 15Mean March zonal % NOx change
-90 -45 0 45 90
LATITUDE 0 5 10 15 ALTITUDE (km) -35 -30-25 -25
-20 -15 -10 -5 0
(a)
-40 -35 -30 -25 -20 -15 -10 -5 0 5 10Mean March zonal % O3 change
-90 -45 0 45 90
LATITUDE 0
5 10 15
ALTITUDE (km) -16
-14 -12-10-8 -6
(e)
-20 -18 -16 -14 -12 -10 -8 -6 -4 -2 0Mean March zonal % HNO3 change
-90 -45 0 45 90
LATITUDE 0 5 10 15 ALTITUDE (km) 0 5 10 15 20 25 30 35 0
(c)
-10 -5 0 5 10 15 20 25 30 3540 Mean March zonal % CO change
-90 -45 0 45 90
LATITUDE 0 5 10 15 ALTITUDE (km) 4.5 6.0 7.5 9.0 10.5 12.0
(d)
0.0 1.5 3.0 4.5 6.0 7.5 9.0 10.5 12.0 13.5 15.0Fig. 4. Mean differences (%) for the month of March between 3-D model runs NEW3D and CON3D for (a) NOx, (b) HO2, (c) HNO3, (d)
CO, (e) O3and (f) OH. Negative contours indicate smaller values in run NEW3D.
not very sensitive to the season. The GEOS-CHEM model gives a similar response in the UT, but produces a larger O3
decrease in the SH lower troposphere. This is due to the larger NOx decrease that is found in this hemisphere away
from major surface sources. The decrease in NOx has the
impact of decreasing O3throughout the troposphere ranging
from−6% to−16%.
3.2 Comparison with observations
Figure 5 compares modelled profiles of NOxand HNO3from
runs CON3D and NEW3D with a compilation of aircraft observations mapped onto a monthly 4◦×5◦grid (Emmons
et al., 2000). For this comparison the appropriate grid box of the model was sampled and then the results averaged over all the observation points. As discussed above, the NOx
concentrations in run NEW3D are lower than run CON3D, while HNO3is generally larger. The region where the
mod-elled change is most significant is in the tropical UT where
NEW3D agrees less well with the observations, especially
for NOx. Elsewhere the modelled changes are not large
com-pared with the model-observation differences.
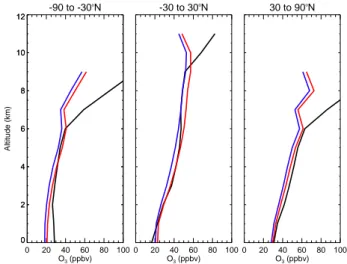
Figure 6 compares annual mean modelled ozone profiles with the climatology of Logan (1999). In the middle tro-posphere both model runs agree fairly well with the ob-servations, although run CON3D is, on average, closer. The model underestimate of observations of O3 in the 7–
10 km range reflects issues with an overestimate in the GEOS tropopause mass flux which is in excess. To maintain a 500 Tg yr−1 cross tropopause O3 flux, lower than observed
O3 concentrations are necessary within the model
strato-sphere. The mean ratio between model and observed in run
CON3D is 1.0078 while in run NEW3D it is 0.9148. The
total tropospheric O3in run CON3D is 284 Tg while in run
NEW3D it is 259 Tg. There are no direct observations of
this total but these values are at the lower range of modelled values (see Stevenson et al., 2006).
4 Conclusions
The minor HNO3-forming channel of the reaction between
NO and HO2has a significant impact on tropospheric
-90 to -30o
N
0 50 100 150
NOx (pptv)
0 2 4 6 8 10 12 0 2 4 6 8 10 12 Altitude (km)
-30 to 30o
N
0 50 100 150
NOx (pptv)
0 2 4 6 8 10 12 0 2 4 6 8 10 12 Altitude (km)
30 to 90o
N
0 50 100 150
NOx (pptv)
0 2 4 6 8 10 12 0 2 4 6 8 10 12 Altitude (km)
-90 to -30oN
0 100 200 300 400 500 HNO3 (pptv)
0 2 4 6 8 10 12 0 2 4 6 8 10 12 Altitude (km)
-30 to 30oN
0 100 200 300 400 500 HNO3 (pptv)
0 2 4 6 8 10 12 0 2 4 6 8 10 12 Altitude (km)
30 to 90oN
0 100 200 300 400 500 HNO3 (pptv)
0 2 4 6 8 10 12 0 2 4 6 8 10 12 Altitude (km)
Fig. 5. Comparison of profiles (pptv) of NOx(top) and HNO3
(bot-tom) averaged over 3 latitude bands (left 90◦S–30◦S, centre 30◦S–
30◦N, right 30◦N–90◦N) from 3-D model run CON3D (red line),
run NEW3D (blue line) and observations (Emmons et al. (2000), black line).
concentrations that produces an ozone increase in the tropo-sphere. Due to the temperature dependence of the reaction, the effects on the species distributions are generally largest at the equatorial mid and upper troposphere where the tem-peratures are low, and at high latitudes in the SH. In those regions the O3concentration decreases by about 10% when
Reaction (R1b) is taken into account.
The OH reduction induced by Reaction (R1b) can also in-crease the lifetime of the long-lived species whose destruc-tion proceeds mainly by reacdestruc-tion with this radical. This is the case for CH4 whose lifetime reaches 10.1 years against
9.6 years when Reaction (R1b) is neglected.
Reaction (R1b) has been established by laboratory mea-surements and should therefore be included in photochemi-cal models. Comparison of our 3-D model with observations of NOx, HNO3and O3 suggests that the overall agreement
-90 to -30o
N
0 20 40 60 80 100 O3 (ppbv)
0 2 4 6 8 10 12 Altitude (km) 0 2 4 6 8 10 12 0 2 4 6 8 10 12
-30 to 30o
N
0 20 40 60 80 100 O3 (ppbv)
0 2 4 6 8 10 12 0 2 4 6 8 10 12
30 to 90o
N
0 20 40 60 80 100 O3 (ppbv)
0 2 4 6 8 10 12 0 2 4 6 8 10 12
Fig. 6. As Fig. 5 but for O3(ppbv) compared with observed
clima-tology of Logan (1999).
tends to worsen when the reaction is included. This, there-fore, points to other outstanding uncertainties in tropospheric NOx:HNO3partitioning. Possible causes of these differences
need further investigation in the laboratory and with models. The present evaluation has been performed at global scale with a representation of the atmospheric chemistry adequate mostly for the free troposphere. It is expected that the im-pact of Reaction (R1b) could be different for specific regions where background species concentrations can vary from the mean values produced by the large-scale models. This, for instance, could be the case in boundary layers over conti-nents or polluted areas. Thus, the present study should be complemented by air quality model simulations to obtain a more comprehensive picture of the possible regional and lo-cal influences of Reaction (R1b) on the atmospheric chem-istry.
Acknowledgements. This work was supported by the
European Union FP6 Integrated Projects SCOUT-O3
(http://www.ozone-sec.ch.cam.ac.uk) and QUANTIFY
(http://www.pa.op.dlr.de/quantify/), and the french LEFE/CHAT INSU programme (http://www.insu.cnrs.fr).
Edited by: A. Hofzumahaus
References
Arnold, S. R., Chipperfield, M. P., Blitz, M. A., Heard, D. E., and Pilling, M. J.: Photodissociation of acetone: Atmospheric impli-cations of temperature-dependent quantum yields, Gephys. Res. Lett., 31, L07110, doi:10.1029/2003GL019099, 2004.
Atkinson, R., Blauch, D. L., Cox, R. A., Crowley, J., Hampson Jr., R. F., Hynes, R. G., Jenkin, M. E., Rossi, M. J., and Troe, J.: Evaluated kinetic and photochemical data for atmospheric
species, Atmos. Chem. Phys., 4, 1461–1738, 2004, Updated at http://www.iupac-kinetic.ch.cam.ac.uk, 2006.
Bey, I., Jacob, D. J., Yantosca, R. M., Logan, J. A., Field, B. D., Fiore, A. M., Li, Q., Liu, H. Y., Mickley, L. J., and Schultz, M. G.: Global modelling of tropospheric chemistry with assim-ilated meteorology: Model description and evaluation, J. Geo-phys. Res., 106, 23 073–23 096, 2001.
Bloss, W., M. J. Evans, J. D. Lee, R. Sommariva, D. E. Heard and M. J. Pilling: The oxidative capacity of the troposphere: Cou-pling of field measurements of OH and a global chemistry trans-port model, Faraday Discuss., 130, 425, doi:10.1039/b419090d, 2005.
Butkovskaya, N. I., Kukui, A., Pouvesle, N., and Le Bras, G.:
For-mation of nitric acid in the gas-phase HO2+ NO reaction: Effects
of temperature and water vapor, J. Phys. Chem. A, 109, 6509– 6520, 2005.
Butkovskaya, N. I., Kukui, A., and Le Bras, G.: HNO3 forming
channel of the HO2+NO reaction as a function of pressure and
temperature in the ranges of 72–600 Torr and 223–323 K, J. Phys. Chem. A, 111, 9047–9053, 2007.
Cantrell, C. A. and Stedman, D. H.: A possible technique for the measurement of atmospheric peroxy radicals, Geophys. Res. Lett., 9, 846–849, 1982.
Cariolle, D. and Brard, B.: The distribution of ozone and active stratospheric species: Result of a two-dimensional atmospheric model, in: Atmospheric Ozone, edited by: Zerefos, C. S. and Ghazi, A., D. Reidel, Higham, Mass., 77–81, 1984.
Cariolle, D. and Teyss`edre, H.: A revised linear ozone photochem-istry parameterization for use in transport and general circula-tion models: Multi-annual simulacircula-tions, Atmos. Chem. Phys., 7, 2183–2196, 2007,
http://www.atmos-chem-phys.net/7/2183/2007/.
Emmons, L. K., Hauglustaine, D. A., Muller, J.-F., Carroll, M. A., Brasseur, G. P., Brunner, D., Staehelin, J., Thouret, V., and Marenco, A.: Data composites of airborne observations of tropo-spheric ozone and its precursors, J. Geophys. Res., 105, 20 497-20 538, 497-2000.
Evans, M. J. and Jacob, D. J.: Impact of new laboratory studies of
N2O5hydrolysis on global model budgets of tropospheric
nitro-gen oxides, ozone, and OH, Geophys. Res. Lett., 32, 1–4, 2005. Krol, M., Leeuwen, P. J., and Lelieveld, J.: Global OH trends
in-ferred from methyl-chloroform measurements, J. Geophys. Res., 103, 10 697–10 711, 1998.
Logan, J. A.: An analysis of ozonesonde data for the troposphere: Recommendations for testing 3-D models and development of a gridded climatology for tropospheric ozone, J. Geophys. Res., 104, 16 115–16 149, 1999.
Prinn, R. G., Huang, J., Weiss, R. F., et al.: Evidence for substan-tial variations in atmospheric hydroxyl radicals in the past two decades, Science, 292, 1882–1888, 2001.
Sander, S. P. , Friedl, R. R., Golden, D. M., Kurylo, M. J., Moort-gat, G. K., Keller-Rudek, H., Wine, P. H., Ravishankara, A. R., Kolb, C. E., Molina, M. J., Finlayson-Pitts, B. J., Huie, R. E., and Orkin, V. L.: Chemical Kinetics and Photochemical Data for Use in Atmospheric Studies, JPL Publication 06-2, Evaluation no. 15, 2006.
Spivakovsky, C. M., Logan, J. A., Montzka, S. A., et al.: Three-dimensional climatological distribution of tropospheric OH: Up-date and evaluation, J. Geophys. Res., 105(D7), 8931–8980, 2000.
Stevenson, D. S., Dentener, F. J., Schultz, M. G., et al.: Mul-timodel ensemble simulations of present-day and near fu-ture tropospheric ozone, J. Geophys. Res., 111, D08301, doi:10.1029/2005JD006338, 2006.