www.ann-geophys.net/28/2015/2010/ doi:10.5194/angeo-28-2015-2010
© Author(s) 2010. CC Attribution 3.0 License.
Annales
Geophysicae
Polar cap flow channel events: spontaneous and driven responses
P. E. Sandholt1, Y. Andalsvik1, and C. J. Farrugia2
1Department of Physics, University of Oslo, Oslo, Norway
2Space Science Center, University of New Hampshire, Durham, USA
Received: 19 May 2010 – Revised: 26 August 2010 – Accepted: 27 October 2010 – Published: 5 November 2010
Abstract. We present two case studies of specific flow channel events appearing at the dusk and/or dawn polar cap boundary during passage at Earth of interplanetary (IP) coro-nal mass ejections (ICMEs) on 10 January and 25 July 2004. The channels of enhanced (>1 km/s) antisunward convec-tion are documented by SuperDARN radars and dawn-dusk crossings of the polar cap by the DMSP F13 satellite. The re-lationship with Birkeland currents (C1–C2) located poleward of the traditional R1–R2 currents is demonstrated. The con-vection events are manifest in ground magnetic deflections obtained from the IMAGE (International Monitor for Auro-ral Geomagnetic Effects) Svalbard chain of ground magne-tometer stations located within 71–76◦ MLAT. By combin-ing the ionospheric convection data and the ground magne-tograms we are able to study the temporal behaviour of the convection events. In the two ICME case studies the convec-tion events belong to two different categories, i.e., directly driven and spontaneous events. In the 10 January case two sharp southward turnings of the ICME magnetic field excited corresponding convection events as detected by IMAGE and SuperDARN. We use this case to determine the ground mag-netic signature of enhanced flow channel events (the NH-dusk/By<0 variant). In the 25 July case a several-hour-long
interval of steady southwest ICME field (Bz<0; By<0)
gave rise to a long series of spontaneous convection events as detected by IMAGE when the ground stations swept through the 12:00–18:00 MLT sector. From the ground-satellite con-junction on 25 July we infer the pulsed nature of the polar cap ionospheric flow channel events in this case. The typical duration of these convection enhancements in the polar cap is 10 min.
Keywords. Ionosphere (Plasma convection) – Magneto-spheric physics (Polar cap phenomena; Solar wind-magnetosphere interactions)
Correspondence to:P. E. Sandholt ([email protected])
1 Introduction
In previous studies we documented the presence of a channel of enhanced (1–3 km/s) antisunward ionospheric convection appearing at the dawn and/or dusk sides of the polar cap, its location depending on the IMF orientation (see Sandholt and Farrugia, 2009, and references therein). When sorted by hemisphere (north or south), side of the polar cap (dawn and/or dusk), IMFBy polarity, and clock angle range, five
convection configurations in the polar cap involving this flow feature, which we call FC 2, have been identified: (i) NH-dawn/By>0, (ii) SH-dusk/By>0, (iii) NH-dusk/By<0,
(iv) SH-dawn/By<0, and (v) (dawn + dusk)/Bz-dominated
(|By|/|Bz|<1; clock angle>135◦).
This category of flow channel should be distinguished from the flow excited in association with newly open mag-netic field lines (called here FC 1) and which is accompa-nied by dynamic auroral emissions in the cusp region (see e.g. Sandholt et al., 1990; Pinnock et al., 1993, and Provan et al., 1999). The flow channel we call FC 2 is observed on the downstream side of the cusp, accompanied by polar rain precipitation. Key FC 2 properties are: (i) a ∼200– 300 km wide channel of enhanced antisunward flow (ion drift speeds larger than in the central polar cap) located immedi-ately poleward of the oval aurora (plasma sheet precipitation) at∼06:00–09:00/15:00–18:00 MLTs, (ii) in association with a system of outward-inward directed Birkeland currents lo-cated poleward of the traditional R1–R2 currents via their Pedersen current closure in the ionosphere.
In Sandholt et al. (2010) we reported one case showing the presence of a series of 5–10-min-long negative X-component magnetic deflections detected at ground stations located un-derneath the FC 2 flow channel of type NH-dusk/By<0.
this possibility from a different perspective, i.e., high-altitude magnetospheric plasma and magnetic field observations from Cluster (Farrugia et al., 2004). In the present study we shall explore the temporal variability of flow channel FC 2 (NH-dusk/By<0) from the ionospheric perspective further. The
following approach is adopted. We selected two categories of events: (i) those “directly driven” by southward turnings of the interplanetary magnetic field (IMF), i.e., the IMF turns south and, after an appropriate time delay for propagation, the flow channel is observed; (ii) “spontaneous” events oc-curring during periods of stable southward-directed magnetic field outside the magnetosphere, i.e., IMFBzis
uninterrupt-edly negative for a long time spell, and during this time the flow channel is intermittently excited. From category (i) we determine the correspondence between discrete convection enhancements (Greenwald et al., 1999) and ground magnetic deflections at magnetometer stations in the polar cap. Then we shall apply this information to document the presence of a series of ∼10-min-long convection enhancements during intervals of quasi-stable magnetic field conditions in inter-planetary coronal mass ejections (ICME) at the time of their Earth passage (the “spontaneous events”; see e.g. Sandholt and Farrugia, 2006). Intervals of ICME passage at Earth were selected because of the strong and ordered forcing of the magnetosphere which occur in such cases (Burlaga et al., 1981; Farrugia et al., 1998).
Magnetograms from the high-latitude (71–76◦ MLAT)
magnetometer stations on Svalbard (IMAGE chain; http: //www.geo.fmi.fi/image) are combined with ionospheric ion drift observations in the same magnetic local time – mag-netic latitude (MLT/MLAT) sector obtained by ground-based radars of the SuperDARN network (Greenwald et al., 1995) and from satellite DMSP F13 (see e.g. Hairston et al., 1998). By using ground – satellite conjunctions we are able to docu-ment the different ion drift signatures observed in the differ-ent phases (maximum and recovery) of the ground magnetic deflection events. In this way we are able to establish the detailed correspondence between the temporal evolution of the ionospheric ion drift events in flow channel FC 2 and the magnetic deflections detected at ground stations underneath the ionospheric flow feature. Thus, we shall take advantage of the ability of continuous ground observations of magnetic deflections to monitor the temporal variability of ionospheric Hall currents.
2 Data description
As indicated already in the title of the paper we report two categories of events, i.e., those “directly driven” by south-ward turnings of the external magnetic field (IMF or the ICME field during Earth passage) and those occurring during steady external field conditions (the “spontaneous” events). In case 1 (10 January 2004) we shall focus on “directly driven” events, which was observed when the magnetic field
FC2 FC1
F15 (1610)
F13 (1610) 12
EEJ
SAPS
FC1 09
06
03 21
18 15
24
FC2 : NH - dusk / B <
y
0
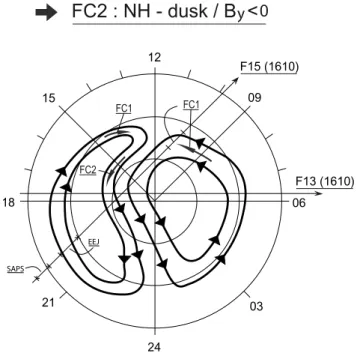
Fig. 1. Flow channel FC 2 (bold arrow) in the context of Dungey convection cells (flow lines) and flow channels FC 1 representing southwest (Bz<0;By<0;|Bz/By|<1) IMF conditions. (Adapted after Fig. 2 in Greenwald et al., 2002). Trajectories of satellites DMSP F13 and F15 which crossed through flow channels FC 2 and FC 1, respectively, have been marked in the figure.
of the ICME was southwest-directed (Bz<0;By<0) and By-dominated (|Bz/By|<1). In the second case (25 July
2004) we report “spontaneous” events when the magnetic field of the ICME was southwest-directed (Bz<0;By<0)
andBz-dominated (|Bz/By|>1).
2.1 Background on FC 2 of type NH-dusk/By<0
In our case 1 we shall discuss the variant of flow channel FC 2 which is found on old open field lines in the dusk side convection cell of the Northern Hemisphere during neg-ative IMFByconditions, which we refer to as NH-dusk/By<
0 (Sandholt and Farrugia, 2009). Figure 1 is an introduction to this convection feature schematically placed in the con-text of the Dungey convection cells. Flow channels FC 1 and FC 2 have been marked by bold arrows in the sectors of the convection cells they lie in. This figure refers to the IMF conditions discussed in case 1 of this paper (southwest-directed:Bz<0;By<0;|Bz/By|<1). The flow lines drawn
in this figure is an extract of the traditional convection pattern as inferred from SuperDARN radar observations during an extended 5-h interval of quasi-stationary southwest-directed (Bz<0;By<0) IMF orientation on 16 December 1997 (see
Fig. 2 in Greenwald et al. (2002)). Below we shall discuss the spatial-temporal structure of the NH-dusk/By<0 variant of
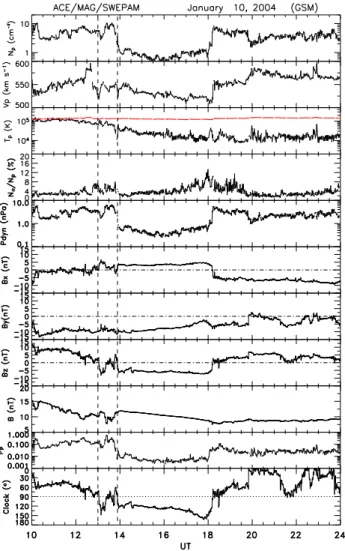
Fig. 2. Interplanetary plasma and field data obtained from space-craft ACE during the interval 10:00–24:00 UT on 10 January 2004: proton density, bulk speed, and temperature (in red: expected tem-peratures for normal solar wind expansion after Lopez, 1986), the alpha-particle-to-proton number density ratios, the dynamic pres-sure, the components of the magnetic field in GSM coordinates, and the total field strength, the proton plasma beta and the clock angle of the magnetic field.
On 10 January 2004 (our case) the presence of flow chan-nel FC 1 in the morning cell as well as the indicated flow characteristics of the dusk cell (in the 20:00–21:00 MLT sec-tor) are documented by ion drift data obtained during a pas-sage of satellite DMSP F15 from pre-midnight to pre-noon (as marked in the figure) in the interval 15:57–16:27 UT (data not shown). The dusk-to-dawn crossing of satellite DMSP F13 also marked in the figure documented the presence of flow channel FC 2 (data not shown).
2.2 Case 1: 10 January 2004 (“directly driven” response)
For the interval 10:00–24:00 UT, Fig. 2 shows solar wind and magnetic field data obtained by the ACE spacecraft on 10 January 2004. From top to bottom, the panels show the pro-ton density, bulk speed, and temperature (in red: expected temperature after Lopez and Freeman, 1986), the alpha-particle-to-proton number density ratios, the dynamic pres-sure, the components of the magnetic field in GSM coordi-nates, and the total field strength, the proton plasma beta and the clock angle of the magnetic field (i.e., the polar angle in the GSMY Zplane). The expected temperature in panel 3 was derived by Lopez and Freeman (1986) (see also Lopez, 1987) from a statistical examination of Helios 1 data which resulted in a relationship between the temperature (T) and velocity (V) of the solar wind.
During the interval studied, ACE was orbiting the la-grangian L1 point. Its average distance from the Sun-Earth line is∼43RE. Studies on the correlation length of IMF and
solar wind parameters give a correlation length of order 40– 70RE in the Y-direction (Crooker et al., 1982; Richardson
and Paularena, 2001). However, for ICMEs the correlation lengths extend to at least 200RE(Farrugia et al., 2005). So
the measurements at ACE should give the parameters affect-ing the magnetosphere, when properly time lagged.
We shall focus on the interval 13:00–18:00 UT, represent-ing the leadrepresent-ing edge of the magnetic cloud and note the fol-lowing features: (i) sharp southward turnings of the magnetic field at 13:00 and 13:50 UT (vertical guidelines), (ii) stable south-west (Bz= −4 to−5 nT;By= −7 to−10 nT) directed
field during the rest of the interval (clock angle increasing from 120 to 160◦), (iii) low plasma density (∼1 cm−3) and
dynamic pressure (<1 nPa) during the sub-interval 14:00– 18:00 UT. At 10:00 UT ACE is at (233,−37, 220)RE. With
a convection speed of ∼525 km/s, we estimate a delay of ∼47 min for the IP disturbances to reach the subsolar magne-topause. To this must be added a few minutes to account of (1) the slower propoagation speed in the magnetosheath and (2) intrinsic response times of the magnetosphere-ionosphere system.
Figure 3 shows IMAGE (International Monitor for Auro-ral Geomagnetic Effects) magnetograms from four stations on Svalbard when these stations swept through the 16:00– 20:00 MLT sector. We note the following features: (i) On-sets of convection bays (δH <0) appearing at 14:00 and 14:50 UT. (ii) Recovery after the first convection bay dur-ing 14:20–14:50 UT. (iii) A third convection enhancement appeared at 15:50 UT. (iv) While the 14:00 UT event (maxi-mum phase in the interval 14:08–14:15 UT) appears clearly in the Ny ˚Alesund (NAL)-Longearbyen(LYR)-Hornsund (HOR) (76–73◦ MLAT) station records, it is absent in the
Bear Island (BJN; 71◦MLAT) magnetogram. By contrast,
Fig. 3. H-component magnetograms from the IMAGE Svalbard chain of stations during the interval 13:00–17:00 UT. Panels from top to bottom shows magnetograms from stations NAL (76◦MLAT;
black trace), LYR (75◦MLAT; red), HOR (74◦MLAT; green), and BJN (71◦; blue). The vertical guideline at 14:12 UT marks the time of observation by SuperDARN radars of flow channel FC 2 (NH-dusk/By<0) above Svalbard, representing the maximum phase (14:08–14:15 UT) of the magnetic deflection/convection event. The FC 2 event is marked in the figure. The positive H-deflections propagating poleward from BJA to NAL during the interval 13:50– 14:00 UT are also marked. This feature corresponds to the activa-tion of flow channel FC 1 (see Fig. 1).
By comparison with the ACE plot in Fig. 2 we identify the convection bays initiated at∼14:00 UT and 14:50 UT as “directly driven” by the two sharp southward turnings of the magnetic field recorded by ACE at 13:00 and 13:50 UT. It is well known that such southward turnings of the IMF give rise to convection enhancements (Greenwald et al., 1999).
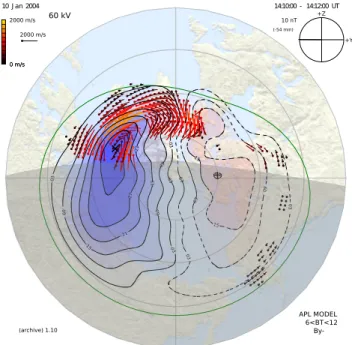
Next we shall show a spatial plot of plasma convection in the postnoon sector (including the Svalbard area) as ob-tained by SuperDARN radars in Finland, Iceland and Canada at 14:10–14:12 UT, representing the maximum phase of the magnetic deflection event. This allows us to relate the ground magnetic deflections shown in Fig. 3 to the local plasma convection configuration. In this way we shall demonstrate the association between the negative H-deflection during the interval 14:08–14:15 UT (maximum phase) and the en-hanced antisunward flow in the FC 2 channel as indicated in Fig. 4. The poleward propagating positive deflection oc-curring ahead of the negative excursion (observed during the interval 13:50–14:00 UT) reflects the activation of flow chan-nel FC 1 (see the schematic illustration in Fig. 1). This flow feature (FC 1 event) is accompanied by poleward moving auroral forms (PMAFs), as demonstrated in Sandholt et al. (1990) and Øieroset et al. (1997).
Figure 4 shows a spatial plot of plasma convection recorded during the 2-min scan from 14:10–14:12 UT. We shall focus on the convection pattern in the postnoon sector
-03
-03 -03
-03
-0
9 -09
-09
-15
-1
5
-21 -2
1
-27 03
03
03
09
09
15
15
2000 m/s
0 m/s 0 m/s
2000 m/s
10 J an 2004 14:10:00 - 14:12:00 UT
APL MODEL 6<BT<12
By-10 nT (-54 min)
+Y +Z
60 kV
(archive) 1.10
Fig. 4.Spatial plot of plasma convection obtained by SuperDARN radars during the 2-min scan at 14:10–14:12 UT. The coordinate system is MLT/MLAT. The terminator is marked in the figure.
(to the left) consisting of a crescent-shaped cell, as is ap-propriate for the prevailing southwest-directed magnetic field detected by ACE. A channel of≥1 km/s antisunward convec-tion is seen in the 15:00–17:00 MLT/75–78◦ MLAT sector.
This is our flow channel FC 2. It is the convection response to the first southward turning (detected by ACE at 13:00 UT) and the cause, through the associated Hall currents, of the the negative H-component magnetic deflections detected at the Svalbard ground stations HOR-LYR-NAL (74–76◦ MLAT)
beneath the flow channel as documented in Fig. 3. The flow channel is located in a sector with sunlit ionosphere (see the terminator location). From Figs. 2, 3 and 4 we may in-fer a 15 min long (14:05–14:20 UT) FC 2 convection event which is “directly driven” by the south-west directed ICME magnetic field detected by ACE during the interval 13:05– 13:20 UT.
2.3 Background on FC 2 of type NH-(dawn + dusk)/
Bz-dominated
Figure 5 is an introduction to our case 2 observations illus-trating the average (background) convection pattern (the flow lines) at 10:40 (top panel) and 12:20 UT on 25 July 2004 cor-responding to the prevailing ICME magnetic field conditions (Bz-dominated), according to the APL-model as described
by Ruohoniemi and Baker (1998).
90 80 70 06 09
60 15
18
F13
80 70 60
1040 UT
12
FC2 :NH - (dawn + dusk)/
B
Z- dominated
90 80 70 06
09
60 15
18
F13
80 70 60
1220 UT
12
Fig. 5. Averaged convection patterns at 10:40 UT (top panel) and at 12:20 UT (bottom) on 25 July 2004 corresponding to the ICME magnetic field conditions observed by Wind, according to the APL-model (see Ruohoniemi and Baker, 1998). Marked by solid dots are two magnetometer stations on Svalbard (NAL-HOR). Marked by arrowed lines are DMSP F13 passes during the intervals 10:30– 11:00 UT and 12:11–12:41 UT.
(top panel) and on the dawn side at 12:30 UT. The variant of FC 2 observed on this day (present on both sides of the polar cap during|Bz/By|>1 conditions) is that we refer to as FC 2
of type NH-(dawn + dusk)/Bz-dominated.
2.4 Case 2: 25 July 2004 (“spontaneous” response)
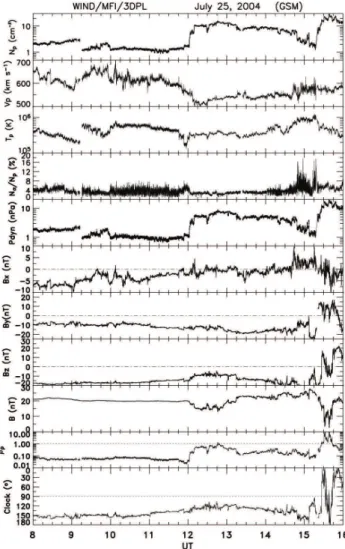
Figure 6 shows plasma and magnetic field data obtained from spacecraft Wind during the interval 08:00–16:00 UT on 25 July 2004. The format is the same as that of Fig. 2. The average Wind location was (261,−1, 18)RE(GSE
co-ordinates). We shall direct attention to the relatively sta-ble magnetic field conditions prevailing during the interval 08:00–15:00 UT, despite the field and flow discontinuity at ∼12:00 UT. The field is strong (15–25 nT), directed south-west (Bz= −10 to−20 nT;By= −10 to−20 nT). The clock
angle varies slowly between 120–160◦. The speed is high
(within 500–700 km/s), while the plasma density changes between low values (1–2 cm−3) during 08:00–12:00 UT and
higher values (10 cm−3) during 12:00–14:00 UT.
Figure 7 shows H-component magnetograms from IM-AGE Svalbard stations for the interval 08:00–16:00 UT when these stations swept through the 11:00–19:00 MLT sec-tor. Times of ground-satellite conjunctions at station Ny
Fig. 6. Interplanetary plasma and field data obtained from space-craft Wind during the interval 08:00–16:00 UT on 25 July 2004. Same format as in Fig. 2.
˚
Alesund (NAL) are marked by vertical guidelines at 10:43 and 12:24 UT. At these times satellite DMSP F13 observed cross-track ion drifts and particle precipitation above Sval-bard during polar cap crossings from dusk to dawn. These ground-satellite conjunctions allow us to relate the ground magnetic deflection events to the configurations of plasma convection, precipitation and Birkeland currents in the dusk sector of the polar cap.
IMAGE H-component July 25, 2004
UT
8 9 10 11 12 13 14 15 16
6600
6700
6800
6900
7000
7100
7200
11 -- 19 MLT NAL
LYR
HOR
100 nT
FC2
FC2
Fig. 7. H-component magnetic deflections from the Image Sval-bard chain of stations Ny ˚Alesund (NAL; 76◦MLAT; black trace), Longyearbyen (LYR; 75◦MLAT; red), and Hornsund (HOR; 74◦
MLAT; blue) for the interval 08:00–16:00 UT when the stations swept through the 11:00–19:00 MLT sector. Vertical guidelines at 10:43 and 12:24 UT mark passages of satellite DMSP F13 in the vicinity of Svalbard; i.e., the times of the closest approach to sta-tion NAL. The two intervals of corresponding FC 2 flow channel activation have been marked.
The magnetic deflection event centered at 12:20 UT shows a sharp onset at 12:13 UT (occurring simultaneously at all three stations spanning the latitude range 74–76◦ MLAT)
and recovery from 12:23 UT onwards. The amplitude of this deflection event is somewhat larger (∼100 nT) than the 10:43 UT event (∼50 nT).
By comparison with the satellite data obtained during these DMSP F13-Svalbard conjunctions we shall be able to determine the correspondence between the magnetic deflec-tion and the ion drift events and thereby to estimate the du-ration of the two flow channel events (FC 2), as indicated in the figure.
We note that the positive H-deflections appearing ahead of the negative excursions most likely reflect the FC 1 flow channel (see the illustration in Fig. 1). The association be-tween the FC 1 magnetic signature and poleward moving au-roral forms (PMAFs) has been documented in Sandholt et al. (1990) and Øieroset et al. (1997).
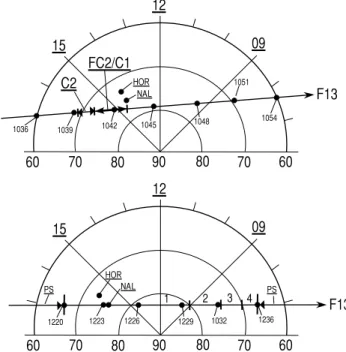
Figure 8 shows an overview of the observation geome-try on 25 July with tracks of satellite F13 across the North-ern Hemisphere polar cap (dusk-to-dawn) during the inter-vals 10:36–10:54 UT (top panel) and 12:20–12:36 UT. The two ground-satellite conjunctions occurred at 10:43 (top) and 12:24 UT (bottom). The locations of two ground stations on Svalbard (NAL: 76◦MLAT; HOR: 74◦MLAT) at 10:43 (top)
and 12:24 UT (bottom) have been marked. The two times (also marked in Fig. 7) correspond to the closest approaches to ground station NAL in the two cases. The satellite cross-ing of flow channel FC 2 and Birkeland current regimes C1
90 70
60 60
1042 1036
HOR
09 15
F13
12
1051
80 70
NAL
FC2/C1 C2
1039 1045
1048 1054
80
90 70
60 60
1223 HOR
09 15
F13
12
1226
80 70
NAL
1220 1229 1032 1236
80
PS PS
2 3 4
1
Fig. 8. The observation geometry showing tracks of satellites DMSP F13 across the polar cap from dusk to dawn during the in-tervals 10:36–10:54 UT (top panel) and 12:20–12:36 UT (bottom). The locations of two ground stations on Svalbard (NAL: 76◦MLAT; HOR: 74◦ MLAT) at 10:43 UT (top) and 12:24 UT (bottom) are
marked by dots. These times correspond to the closest approaches of DMSP F13 to station NAL. The plasma flow feature (FC 2) and Birkeland current regimes C1 (inward-directed) and C2 (outward-directed) are marked along the track in the top panel. Satellite entry into the polar cap (plasma sheet-polar rain preciptation boundary) at 12:20 UT and exit at 12:36 UT have been marked in the bottom panel. The coordinate system is MLT/MLAT.
(inward-directed) and C2 (outward-directed) during the in-terval 10:39–10:43 UT are indicated along the track in the top panel.
In the bottom panel we marked the satellite entry into the polar cap on the dusk side at 12:20 UT and the exit on the dawn side at 12:36 UT. The satellite crossed over ground station NAL at 12:23–12:24 UT. We shall focus on this ground-satellite conjunction. Four different precipitation-convection-Birkeland current regimes are marked on the dawn side of the polar cap.
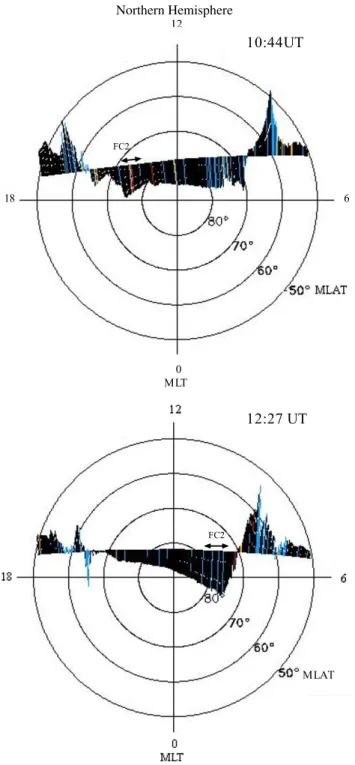
Figure 9 shows cross-track ion drifts during the same dusk-dawn crossings of the polar cap shown in Fig. 8. The upper panel shows the presence of flow channel FC 2 (enhanced antisunward convection) in the 14:30–16:00/71– 76◦MLT/MLAT sector during the interval 10:40–10:43 UT
(see the V-shaped flow profile). This is within the time in-terval of a 15 min long magnetic deflection event as marked by the first vertical guideline in Fig. 7. The latitude of max-imum flow speed (1.2 km/s), i.e. the most intense Hall cur-rent, is at 72–73◦MLAT. This is consistent with the
Northern Hemisphere
Fig. 9.Cross-track ion drifts along two consecutive satellite passes across the polar cap from dusk to dawn in the Northern Hemisphere centered at 10:44 UT (top panel) and 12:27 UT (bottom) obtained by satellite DMSP F13. The coordinate system is MLT/MLAT. Lat-itude circles at 50–80◦MLAT have been drawn. The drift scale is shown in a later figure. (Blue and yellow mark “undetermined” and “caution”, respectively).
(compared to the deflections at the higher-latitude stations LYR and NAL) at this time occurring at the southernmost station HOR (see Fig. 7).
Fig. 10. DMSP F13 data obtained during the interval 10:30– 11:00 UT on 25 July 2004. Panels from top to bottom shows (i) electron precipitation spectrogram (particle flux versus energy and time), (ii) ion precipitation flux, (iii) ion densities, (iv) cross track (violet trace) and vertical ion drifts, and (v) magnetic deflec-tion componentsBx,By, andBz. Five regimes of different convec-tion/precipitation/Birkeland current configuration have been delim-ited by vertical guidelines.
The lower panel shows the cross-track ion drifts during the pass centered at 12:27 UT. The satellite reached the lat-itude of ground station NAL (the closest station) at 12:23– 12:24 UT (see Fig. 8). At this time the H-component trace at NAL (and LYR and HOR) had started to recover after a negative deflection event (see Fig. 7).
This pass is characterized by the following flow features in the polar cap: (i) the total absence of FC 2 flow channel on the dusk side (the background level of antisunward flow speeds within 70–80 MLAT is≤0.4 km/s); (ii) the presence of flow channel FC 2 on the dawn side (see the V-shaped cross-track drift profile).
In Fig. 10 we shall focus on electron precipitation (top panel), cross track ion drift (violet trace in third panel), and theBz component (east-west; green trace in bottom panel)
magnetic deflection. The satellite track is that shown in the top panels of Figs. 8 and 9.
We subdivided the precipitation/convection/Birkeland cur-rent configuration in the dusk side traversal of the oval/polar cap in the following regimes: (1) central polar cap with an-tisunward convection and polar rain precipitation; (2) flow channel FC 2 and polar rain precipitation, inward-directed C1 Birkeland current (positive Bz-gradient); (3) plasma
sheet, antisunward convection, outward-directed C2 Birke-land current (negative Bz-gradient); (4) reduced plasma
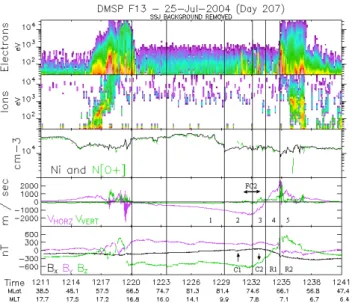
Fig. 11. DMSP F13 data obtained during the interval 12:11– 12:41 UT on 25 July 2004. Panels from top to bottom shows (i) electron precipitation spectrogram (particle flux versus energy and time), (ii) ion precipitation flux, (iii) ion densities, (iv) cross track (violet trace) and vertical ion drifts, and (v) magnetic deflec-tion componentsBx,By, andBz. Same format as in Fig. 10.
Figure 11 shows the cross-track ion drift data (panel 4) ob-tained during the dusk-dawn crossing of the polar cap during the interval 12:20–12:35 UT in the context of particle pre-cipitation (panels 1 and 2) and magnetic deflections (bottom panel). The location of the poleward boundary of plasma sheet precipitation (entry into the polar cap on the dusk side) at 12:20 UT (66.5◦MLAT/16.8 MLT) and polar cap exit
(on the dawn side) at 12:35 UT (66.1◦MLAT/7.1 MLT) are marked by the first and last vertical guidelines, respectively. The closest approach to ground station NAL (76◦ MLAT)
occurred at 12:24 UT and is marked by the second vertical guideline.
Flow channel FC 2 (NH-dusk/By<0) and the associated
Birkeland current system (C1–C2) are clearly absent on the dusk side at this time. The level of antisunward convection on the poleward side of the oval aurora (plasma sheet precip-itation) is very weak (∼0.3 km/s). This is the state of back-ground convection in the duskside polar cap corresponding to the decreasing phase of the magnetic deflection event de-tected by IMAGE from 12:23 UT onwards (see Fig. 7). Thus in this case we may infer the duration of the flow channel event to be 10 min (12:13–12:23 UT).
On the dawn side we notice the following regimes (delim-ited by vertical guidelines): (1) central polar cap with an-tisunward convection (VHORZ<1 km/s) and polar rain
pre-cipitation; (2) enhanced antisunward convection (VHORZ>
1 km/s) and outward-directed C1 Birkeland current (nega-tive Bz-gradient); (3) antisunward convection and
inward-directed C2 Birkeland current (positiveBz-gradient); (4)
sun-ward convection and insun-ward-directed R1 Birkeland cur-rent (positive Bz-gradient); (5) plasma sheet precipitation
and outward-directed R2 Birkeland current (negative Bz
-gradient).
Regimes 2 and 3 (poleward part whereVi≥1 km/s) on the
dawn side do satisfy our criteria for an FC 2 flow channel (marked by horizontal double-arrowed line in panel 4).
3 Summary and conclusions
We reported ion drift features (flow channel FC 2) and associ-ated ground magnetic deflections in the postnoon-dusk sector of the Northern Hemisphere polar cap during Earth passage of two ICMEs in 2004. The ground-satellite conjunctions on 25 July allow us to study the temporal behaviour of the convection channel events. Thus, the flow channel variant we study here is that which appears on the dusk side of the polar cap in the Northern Hemisphere during IMF By<0
conditions (NH-dusk/By<0). We note that during the
in-terval of our observations on 25 July, when the clock angle of the ICME magnetic field changed slowly within the range 135–150◦ and|B
z/By|>1 (see Fig. 6), flow channel FC 2
was observed on both sides (at different times) of the polar cap. Thus, FC 2 is identified on the dusk side in the 10:44 UT pass while it is seen on the dawn side in the 12:27 UT pass of satellite F13 (see Fig. 9). The full documentation of the dual mode (dawn+dusk) of FC 2 during intervals of strongly south (Bz-dominated) IMF orientation is the topic of a separate
pa-per in preparation. In the present study we shall focus on the dusk-side events where the ground-satellite conjunctions occurred.
In case 1 (10 January) we identify the ground magnetic signature of a NH-dusk/By<0 flow channel detected by
Su-perDARN radars when the flow enhancements were “directly driven” by southward turnings of the magnetic field in the ICME (see Fig. 3).
In case 2 (25 July) we documented the ion drift from satellite DMSP F13 corresponding to two different phases of two different ground magnetic deflection events as detected from three IMAGE chain stations on Svalbard covering the latitude range 74–76◦MLAT in the 12:00–18:00 MLT
sec-tor. This case is characterized by a series of magnetic de-flection/convection events appearing during a long (several hours) interval of quasi-steady ICME magnetic field. This is the “spontaneous response”.
The ground-satellite conjunction at 10:43 UT occurred in the maximum phase of a magnetic deflection event (marked by vertical guideline in Fig. 7). The satellite data for this case show all the classical elements of the FC 2 flow channel of type NH-dusk/By<0: (i) antisunward convection
maximiz-ing at a speed (1.2 km/s) above the level of ion drift in the central polar cap, as detected by DMSP F13 in the 71◦/16.5–
76◦/15 MLAT/MLT sector within which the potential drop
as inferred from the along the trackE-field component in-tegrated along the track), (ii) the flow channel is observed in the regime of polar rain precipitation, poleward of the poleward boundary of plasma sheet precipitation (regime 2 in Fig. 10), (iii) the flow channel is associated with a sys-tem of downward (C1) and upward-directed (C2) Birkeland currents located poleward of the traditional R1-R2 currents (regimes 2 and 3 in Fig. 10).
The good correlation observed between the parameters VHORZandBzin this case (Fig. 10) confirms the current
con-tinuity relationj||= −6P∇E (Smiddy et al., 1980). This
demonstrates that flow channel FC 2 is formed by the iono-spheric Pedersen current closure of Birkeland currents C1– C2. The C1–C2 Birkeland current configurations corre-sponding to the different FC 2 flow channels appearing dur-ing IMFBy<0 conditions are indicated in Sandholt et al.
(2010).
The ground-satellite conjunction at 12:24 UT occurred in the recovery phase of a magnetic deflection event (see Fig. 7). The satellite data for this case show the total absence of flow channel FC 2. Correspondingly, only a background convec-tion at a speed of∼0.3 km/s is recorded at this time (see Fig. 11).
From these two ground-satellite conjunctions we conclude that the ion drift in flow channel FC 2 increases and decreases in concert with the H-component deflections recorded on the ground underneath the ionospheric flow. This is reason-able since the magnetic deflection reflects the ionospheric Hall current (Fukushima, 1969) driven by the ionospheric
E-field (JH=6HB×E/B). In this case the ionospheric
conductivity in the polar cap is due to ionization by sun-light (sunlit ionosphere). The ground magnetic deflections are recorded from polar cap stations (HOR-LYR-NAL) in the 74–76◦MLAT range while the poleward boundary of plasma
sheet precipitation is identified at 66.5◦MLAT in the 12:22–
12:24 UT case.
We conclude that in the 25 July 2004 case the ion drift in flow channel FC 2 (NH-dusk/By<0) is pulsed in
a similar way as the ground magnetic deflection events. The ion drift (E-field) variability is directly observed from DMSP F13 in our case:V iFC 2(10:40 UT) = 1.2 km/s;V iFC 2
(12:24 UT) = 0.3 km/s. These two times correspond to the increasing and decreasing phases of two different magnetic deflection (Hall current) events in the event series on 25 July 2004. Based on the assumption that the sharp onset of the H-component deflection at 12:13 UT is driven by an ion drift enhancement (compare case 1) and the observed recovery from 12:23 UT (when a slow background ion drift of 0.3 km/s was observed), we infer the duration of the convection event to be∼10 min. This event duration seems to be typical of the 25 July event series. From the ground magnetic data and the satellite ion drift observations we infer these convection enhancements to be superimposed on a quasi-steady back-ground convection pattern.
The 5–10-min-long FC 2 convection channel events doc-umented here and in Sandholt et al. (2010) are attributed to momentum transfer from the high-latitude and flank bound-ary layers, on the downstream side of the cusp, via the C1– C2 Birkeland currents (see regimes 2 and 3 in Fig. 10), as-sociated with flux transfer events. These convection events represent an important spatial-temporal structure of solar wind-magnetosphere-ionosphere coupling which is not in-cluded in present large statistical studies (Ruohoniemi and Greenwald, 2005) and in conceptual models (Cowley and Lockwood, 1992) of plasma convection which generally em-phasize newly-opened magnetic field lines as agents of mo-mentum and energy transfer to the ionsophere. DuringBy
-dominated (|By/Bz|>1) IMF conditions (see our 10
Jan-uary case) the FC 2 flow feature contributes to enhancing the dawn-dusk convection asymmetry in the antisunward direction (beyond the cusp region). During Bz-dominated
(|By/Bz|<1) IMF conditions (see our 25 July case) the
anti-sunward flow speeds are enhanced at both the dawn and dusk side boundaries of the polar cap with respect to the flow ob-served in the central polar cap (see Fig. 10). The duration of the ionospheric flow events documented here is near the lower limit of previous estimates of the duration of dayside flow events, extending from 5 to 25 min (Lockwood et al., 1990; Greenwald et al., 1999).
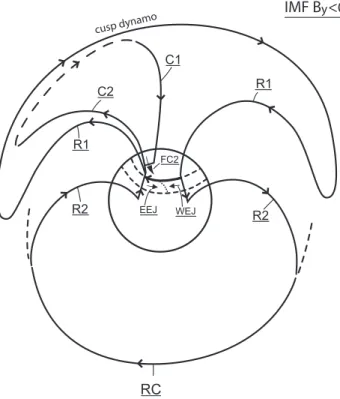
R2 R2
R1
R1 C1
C2
RC
FC2
EEJ WEJ
cusp dynamo
IMF B <
y 0Fig. 12. Schematic illustration of current loops in the magnetosphere-ionosophere system adapted after Tanaka et al. (2010). Birkeland current systems (R1–R2 and C1–C2), magne-tospheric ring current (RC), cusp dynamo current, and ionospheric closure currents have been marked. The FC 2 current loop (cusp dynamo current – C1–C2 Birkeland currents – ionospheric Peder-sen current) is the topic of this paper. The perspective is from the magnetotail towards the Earth (circle). The auroral oval boundaries are marked by the two dashed curved lines. See text for details.
In this article we documented the temporal behaviour (pulsed nature) of the FC 2 current loop via the observation of the ground magnetic signature of the ionospheric Hall cur-rents relating to flow channel FC 2. The FC 2 ion drift and the C1–C2 Birkeland currents were documented by data from spacecraft DMSP F13.
Acknowledgements. We kindly thank Gordon Wilson and Kevin Martin for providing us with DMSP data. Ground magne-tograms from the Svalbard IMAGE chain of ground stations were obtained from http://www.geo.fmi.fi/image. Thanks to Ari Viljanen and Truls Lynne Hansen for operating the IMAGE magnetometer chain on Svalbard. SuperDARN convection plots were obtained from http://superdarn.jhuapl.edu. Work at University of Oslo is supported by the Norwegian Research Council (NFR). Work at UNH is supported by NASA Wind grant NNX10AQ29G.
Topcial Editor I. A. Daglis thanks A. Rodger and R. Walker for their help in evaluating this paper.
References
Burlaga, L. F., Sittler, E., Mariani, F., and Schwenn, R.: Magnetic loop behind an interplanetary shock: Voyager, Helios, and IMP-8 observations, J. Geophys. Res., IMP-86, 6673–66IMP-84, 19IMP-81. Cowley, S. W. H. and Lockwood, M.: Excitation and decay of
so-lar wind-driven flows in the magnetosphere-ionosphere system, Ann. Geophys., 10, 103–115, 1992.
Crooker, N., Siscoe, C., Russell, G., and Smith, E. E.: Factors controlling degree of correlation between ISEE 1 and ISEE 3 interplanetary magnetic field measurements, J. Geophys. Res., 87(A4), 2224–2230, 1982.
Farrugia, C. J., Scudder, J. D., Freeman, M. P., Janoo, L., Lu, G., Quinn, J. M., Arnoldy, R. L., and Torbert, R. B.: Geoeffective-ness of three Wind magnetic clouds: A comparative study, J. Geophys. Res., 103, 17261–17278, 1998.
Farrugia, C. J., Lund, E. J., Sandholt, P. E., Wild, J. A., Cow-ley, S. W. H., Balogh, A., Mouikis, C., Mbius, E., Dunlop, M. W., Bosqued, M., Carlson, C. W., Parks, G. K., Cerisier, J.-C., Kelly, J. D., Sauvaud, J.-A., and R`eme, H.: Pulsed flows at the high-altitude cusp poleward boundary, and associated iono-spheric convection and particle signatures, during a Cluster – FAST – SuperDARN – Søndrestrøm conjunction under a south-west IMF, Ann. Geophys., 22, 2891–2905, doi:10.5194/angeo-22-2891-2004, 2004.
Farrugia, C. J., Matsui, H., Kucharek, H., et al.: Interplane-tary coronal mass ejection and ambient interplaneInterplane-tary mag-netic field correlations during the Sun – Earth connection events of October – November 2003, J. Geophys. Res., 110, A09S13, doi:10.1029/2004JA010968, 2005.
Fukushima, N.: Equivalence in ground geomagnetic effect of Chapman-Vestine and Birkeland-Alfven electric current systems for polar magnetic storms, Rep. Ionos. Space Res. Jap., 23, 219– 227, 1969.
Greenwald, R. A., Bristow, W. A., Sofko, G. J., Senior, C., Cerisier, J.-C., and Szabo, A.: Super Dual Auroral Radar Network radar imaging of dayside high-latitude convection under northward in-terplanetary magnetic field: Toward resolving the distorted two-cell versus multitwo-cell controversy, J. Geophys. Res., 100(A10), 19661–19674, 1995.
Greenwald, R. A., Ruohoniemi, J. M., Baker, K., Bristow, W. A., Sofko, G. J., Villain, J. P., Lester, M., and Slavin, J.: Convec-tive response to a transient increase in dayside reconnection, J. Geophys. Res., 104(A5), 10007–10015, 1999.
Greenwald, R. A., Shepherd, S. G., Sotirelis, T. S., Ruohoniemi, J. M., and Barnes, R. J.: Dawn and dusk sector comparisons of small-scale irregularities, convection, and particle precipitation in the high-latitude ionosphere, J. Geophys. Res., 107(A9), 1241, doi:10.1029/2001JA000158, 2002.
Hairston, M. R., Heelis, R. A., and Rich, F. J.: Analysis of the ionospheric cross polar cap potential using DMSP data during the National Space Weather Program study period, J. Geophys. Res., 103, 26337–26347, 1998.
Lockwood, M., Cowley, S. W. H., Sandholt, P. E., and Lepping, R. E.: The ionospheric signature of flux transfer events and solar wind dynamic pressure changes, J. Geophys. Res., 95, 17113– 17135, 1990.
Lopez, R. E. and Freeman, J. W.: Solar wind proton temperature-velocity relationship, J. Geophys. Res., 91, 1701–1705, 1986. Øieroset, M., Sandholt, P. E., Luhr, H., Denig, W., and Moretto, T.:
Auroral and geomagnetic events at cusp/mantle latitudes in the prenoon sector during positive IMFByconditions: Signatures of
pulsed magnetopause reconnection, J. Geophys. Res., 102, A4, doi:10.1029/96JA03716, 1997.
Pinnock, M., Rodger, A. S., Dudeney, J. R., Baker, K. B., Green-wald, R. A., and Greenspan, M.: Observations of an enhanced convection channel in the cusp ionosphere, J. Geophys. Res., 98, 3767–3776, 1993.
Provan, G., Yeoman, T. K., and Cowley, S. W. H.: The influence of the IMFBycomponent on the location of pulsed flows in the
day-side ionosphere observed by an HF radar, Geophys. Res. Lett., 26, 4, doi:10.1029/1999GL900009, 1999.
Richardson, J. and Paularena, K.: Plasma and magnetic field cor-relations in the solar wind, J. Geophys. Res., 106(A1), 239–251, 2001.
Ruohoniemi, J. M. and Baker, K. B.: Large-scale imaging of high-latitude convection with Super Dual Auroral Radar Network HF radar observations, J. Geophys. Res., 103, 20797–20811, 1998. Ruohoniemi, J. M. and Greenwald, R. A.: Dependencies
of high-latitude plasma convection: Consideration of inter-planetary magnetic field, season, and universal time fac-tors in statistical patterns, J. Geophys. Res., 110, A09204, doi:10.1029/2004JA010815, 2005.
Sandholt, P. E. and Farrugia, C. J.: Spatiotemporal structure of the reconnecting magnetosphere underBy-dominated
interplan-etary magnetic cloud conditions, J. Geophys. Res., 111, A10209, doi:10.1029/2005JA011514, 2006.
Sandholt, P. E. and Farrugia, C. J.: Plasma flow channels at the dawn/dusk polar cap boundaries: momentum transfer on old open field lines and the roles of IMFByand conductivity gra-dients, Ann. Geophys., 27, 1527–1554, doi:10.5194/angeo-27-1527-2009, 2009.
Sandholt, P. E., Lockwood, M., Oguti, T., Cowley, S. W. H., Free-man, K. S. C., Lybekk, B., Egeland, A., and Willis, D. M.: Mid-day auroral breakup events and related energy and momentum transfer from the magnetosheath, J. Geophys. Res., 95, 1039– 1060, 1990.
Sandholt, P. E., Andalsvik, Y., and Farrugia, C. J.: Polar cap convection/precipitation states during Earth passage of two ICMEs at solar minimum, Ann. Geophys., 28, 1023–1042, doi:10.5194/angeo-28-1023-2010, 2010.
Smiddy, M., Burke, W. J., Kelley, M. C., Saflekos, N. A., Gussen-hoven, M. S., Hardy, D. A., and Rich, F. J.: Effects of high-latitude conductivity on observed convection electric fields and Birkeland currents, J. Geophys. Res., 85, 6811–6818, 1980. Southwood, D. J.: The ionospheric signature of flux transfer events,
J. Geophys. Res., 92, 3207–3213, 1987.
Taguchi, S., Sugiura, M., Winningham, J. D., and Slavin, J.: Char-acterization of the IMFBy-dependent field-aligned currents in
the cleft region based on DE 2 observations, J. Geophys. Res., 98, 1393–1407, 1993.