Revistă
cotată
CNCSIS,
categoria B+
THE ANNALS OF THE
"
Ş
TEFAN CEL MARE"
UNIVERSITY OF SUCEAVA.
FASCICLE OF THE FACULTY OF
ECONOMICS AND
PUBLIC ADMINISTRATION
VOLUME 11, NO. 1(13), 2011
EDITORIAL BOARD:
Edit or - in - ch ie f: Carmen N STASE
Ge n e r a l e dit or ia l se cr e t a r y: Adrian Liviu SCUTARIU
Edit or s: Elena HLACIUC, Carmen CHAŞOVSCHI, Mariana LUPAN, Ovidiu Florin HURJUI
SCIENTIFIC COMMITTEE:
Angela ALBU, „Ştefan cel Mare” University of Suceava, Romania Paolo ANDREI, University of Studies in Parma, Italy
Stefano AZZALI, University of Studies in Parma, Italiy George P. BABU, University of Southern Mississippi, USA
Christian BAUMGARTNER, International Friends of Nature, Austria Grigore BELOSTECINIC, ASEM, Chi şin u, Republic of Moldova Ionel BOSTAN, „Alexandru Ioan Cuza” University of Iaşi, Romania Aurel BURCIU, „Ştefan cel Mare” University of Suceava, Romania
Gheorghe CÂRSTEA, Academy of Economic Studies, Bucharest , Romania Slobodan CEROVIC, Singidunum University, Belgrade, Serbia
Simion CERTAN, State University of Chişin u, Republic of Moldova
Carmen CHAŞOVSCHI, „Ştefan cel Mare” University of Suceava, Romania Liliana ELMAZI, Tirana University, Albania
Cristian Valentin HAPENCIUC, „Ştefan cel Mare” University of Suceava, Romania Elena HLACIUC, „Ştefan cel Mare” University of Suceava, Romania
Elena IFTIME, „Ştefan cel Mare” University of Suceava, Romania Marian JALENCU, State University of Chişin u, Republic of Moldova Miika KAJANUS, Savonia University of Applied Sciences, Iisalmi, Finland Alunica MORARIU, „Ştefan cel Mare” University of Suceava, Romania Maria MUREŞAN, Academy of Economic Studies, Bucuresti, Romania Carmen N STASE, „Ştefan cel Mare” University of Suceava, Roman ia Alexandru NEDELEA, „Ştefan cel Mare” University of Suceava, Romania Ion PÂR ACHI, ASEM, Chişin u, Republic of Moldova
Rusalim PETRIŞ, „Ştefan cel Mare” University of Suceava, Romania Abraham PIZAM, University of Central Florida, Orlando, Florida Ion POHOA , „Alexandru Ioan Cuza” University of Iaşi, Romania
Gabriela PRELIPCEAN, „Ştefan cel Mare” University of Suceava, Romania Gheorghe SANDU, „Ştefan cel Mare” University of Suceava, Romania Petru SANDU, Elizabethtown College, Pennsylvania, USA
Doru TILIU E, „Ştefan cel Mare” University of Suceava, Romania Viorel URCANU, ASEM, Chişin u, Republic of Moldova
Diego VARELA PEDREIRA, University of A Coruna, Spain
R zvan VIORESCU, „Ştefan cel Mare” University of Suceava, Romania
Text review: Ovidiu Florin HURJUI, Adrian Liviu SCUTARIU. Cover design: Adrian Liviu SCUTARIU
Contact:
Faculty of Economics and Public Administration „Ştefan cel Mare” University of Suceava
Str. Universităii nr. 13, Corp H, Camera H108 720229 SUCEAVA, ROMANIA
Phone: (+40) 230 216147 int. 294 E-mail: [email protected]
Journal web site: www.seap.usv.ro/annals Faculty web site: www.seap.usv.ro
University web site: www.usv.ro
Responsabilitatea pentru con inutul articolelor revine în întregime autorilor.
CONTENT
SECTION 1... 9 ECONOMY, TRADE, SERVICES
SOCIAL LIFE CYCLE ASSESSMENT: METHODOLOGICAL AND IMPLEMENTATION ISSUES ... 11 Paola Karina Sanchez RAMIREZ
Luigia PETTI
DASTA - Department of Business, Statistical, Technological and Environmental Sciences "G. D'Annunzio" University of Chieti-Pescara, Italy
THE SOCIAL COST OF HOSPITAL WAITING LISTS AND THE CASE FOR COPAYMENT: EVIDENCE FROM GALICIA ... 18
Diego VARELA
Universidad de A Coruña, Faculty of Economics and Business, Campus de Elviña, Spain Anca TIMOFTE
Universidad de A Coruña, Faculty of Economics and Business, Campus de Elviña, Spain
WEALTH MANAGEMENT STRATEGIES IN THE ERA OF E-COMMERCE ... 27 Lecturer Mohammed Shahedul QUADER
University of Science & Technology Chittagong Chittagong, Bangladesh
Assistant Professor Mohammad SHAMSUDDOHA University of Chittagong, Bangladesh
Lecturer Akhter JAHAN
University of Science & Technology Chittagong Chittagong, Bangladesh
Associate Professor Ph.D. Alexandru NEDELEA Stefan cel Mare University of Suceava, Romania
THE STUDY OF THE INFLUENCE OF THE CARDBOARD PACKAGE ON THE QUALITY OF THE FOOD PRODUCT. CASE STUDY – PIZZA PACKED IN CARDBOARD BOX ... 40
Associate Professor Ph.D. Angela ALBU University “Stefan cel Mare”, Suceava, Romania Ph.D. Student Amelia BUCULEI
University “Stefan cel Mare”, Suceava, Romania
RAPEX SYSTEM - AN EFFICIENT TOOL FOR EUROPEAN CONSUMER SAFETY ... 49 Lecturer PhD. Corina ENE
Petroleum-Gas University of Ploiesti, Romania
WAGE LEVELS AND AGENCY PROBLEMS IN PROFESSIONAL TEAM SPORTS ... 60 José Manuel Sánchez SANTOS
Department of Applied Economics, University of A Coruña, Spain José Atilano Pena LÓPEZ
Department of Applied Economics, University of A Coruñ, Spain
THE TAKING OF MARKETING DECISIONS IN CONDITIONS OF UNCERTAINTY AND RISK ... 75 Lecturer PhD. Student Vladimir GROSU
Vice-rector, The Academy of Economic Studies of Moldova
CREDIT CARD FRAUD ... 81 Lecturer PhD. L cr mioara BALAN
Lecturer PhD. Mihai POPESCU
Ştefan cel Mare University of Suceava, Romania
THE STUDY IMPACT OF VIOLENCE REGARDING THE INFLUENCE OF VIOLENCE IN THE
ROMANIAN ECONOMIC AREA ... 86 PhD. Student Amalia-Florina POPESCU
,,Stefan cel Mare’’ University of Suceava, Romania
PhD. Student Anişoara-Nina DUMITROV
THE EVOLUTION OF THE LOW-COST AIRLINES IN US. THE CASE STUDY ON SOUTHWEST AND JETBLUE AIRLINES ... 92
Teaching Assistant PhD. Laura DIACONU (MAXIM)
Faculty of Economics and Business Administration, Al. I. Cuza University of Iasi, Romania Associate Professor PhD. Cristian C. POPESCU
Faculty of Economics and Business Administration, Al. I. Cuza University of Iasi, Romania
IMPACT OF GENDER ON ADOLESCENT CONSUMERS' TOWARDS GREEN PRODUCTS
(A STUDY CONDUCTED IN INDORE CITY) ... 98 Reader Dr. Dharmendra MEHTA
FMS Pt JNIBM, Vikram University Ujjain (M.P) Reader Sangeeta JAIN
Matushri Ahilyadevi Institute of Management, Indore M.P. Dr Naveen K MEHTA
Faculty-MIT, Ujjain (MP)
(Former Faculty- ICAI, New Delhi)
WESTERN BALKANS’ COUNTRIES IN FOCUS OF GLOBAL ECONOMIC CRISIS ... 103 Asc. Prof. Dr. Engjell PERE
Economic Faculty – European University of Tirana, Albania Asc. Prof. Dr. Albana HASHORVA
Economic Faculty –University of Tirana, Albania
STAKEHOLDER ANALYSIS OF THE ROMANIAN FOREST SECTOR ... 114 PhD. Student Raluca NICHIFOREL
Forestry Faculty, ”Stefan cel Mare” University, Suceava, Romania
SECTION 2... 127 MANAGEMENT AND BUSINESS ADMINISTRATION
A REVIEW OF APPROACHES FOR SELECTING INTEGRATED WASTE MANAGEMENT
SCENARIOS FOR LIFE CYCLE ASSESSMENT STUDIES ... 129 Valentino TASCIONE
Andrea RAGGI
DASTA - Department of Business, Statistical, Technological and Environmental Sciences "G. d'Annunzio" University of Chieti-Pescara, Italy
THE TEMPERATURE-BASED DERIVATIVES CONTRACTS – NEW PRODUCTS
OF WEATHER RISK INDUSTRY ... 141 Associate Professor Mirela MATEI
Petroleum and Gas University from Ploieşti, Romania Teaching Assistant C t lin VOICA
Petroleum and Gas University from Ploieşti, Romania
LEADERSHIP* AND ENTREPRENEURSHIP DURING THE CRISIS PERIOD ... 148 Associate Professor PhD. Marian N STASE
Bucharest Academy of Economic Studies, Bucharest, Romania
THE CHOICE FOR SOCIAL DISCOUNT RATE ... 154 Assistant Professor PhD. Ioan Alin NISTOR
Faculty of Business, “Babes-Bolyai” University Cluj-Napoca, Romania
CONSIDERATIONS ON HUMAN CAPITAL CONCEPT ... 159 Professor PhD. Emil HOROMNEA
University Alexandru Ioan Cuza, Faculty of Economics and Business Administration, Iasi, Romania PhD. Student Alina – Mariana ISTRATE
ASSESSING RELATIONSHIP BETWEEN PERSONAL VALUE AND CUSTOMER SATISFACTION: EVIDENCE FROM NIGERIAN BANKING INDUSTRY ... 167
Olaleke Oluseye OGUNNAIKE
Department of Business Studies, Covenant University, OtaOgun State, Nigeria
Oladele Joseph KEHINDE (PhD)
Department of Business Studies, Covenant University, OtaOgun State, Nigeria
RISK ANALYSIS USING THE EXPLOATATION LEVERAGE COEFFICIENT AT PASSANGER ROAD TRANSPORTATION COMPANIES... 176
PhD. Student Vlad IORDACHE
Academy of Economic Studies from Bucharest, Romania Assistant PhD. Student Costin CIORA
Academy of Economic Studies from Bucharest, Romania PhD. Student Adina Andreea OHOT
Academy of Economic Studies from Bucharest, Romania
VALUE STREAM MAPPING - A LEAN PRODUCTION METHODOLOGY ... 184 Msd. Eng. Emil SUCIU
Msd. Eng. Mihai APREUTESEI Msd. Eng. Ionela Roxana ARVINTE University Transilvania of Brasov, Romania
INVESTMENTS – MAIN VECTOR OF ECONOMIC GROWTH IN THE REPUBLIC OF MOLDOVA...192 PhD. in Economics Tatiana BUJOR
University assoc. interim. professor SAUM
INVESTMENTS – MAIN VECTOR OF ECONOMIC GROWTH IN THE REPUBLIC OF MOLDOVA FOR THE SAKE OF DEVELOPMENT? MUNICIPAL GOVERNMENT AND LOCAL DEVELOPMENT IN EMILIA-ROMAGNA AND TURIN (1945-1975)... 197
Daniela ADORNI University of Turin, Italy Stefano MAGAGNOLI University of Parma, Italy
SECTION 3... 209 ACCOUNTING - FINANCES
CRITICAL ANALYSIS OF CURRENT NATIONAL ACCOUNTING REGULATIONS - COMPLIANCE OR NON-COMPLIANCE WITH EUROPEAN DIRECTIVES ... 211
Lecturer Ph.D. Maria BERHECI (c s. GROSU) “Alexandru Ioan Cuza” University of Iaşi, Romania Lecturer Ph.D. Ionela-Corina CHERSAN
“Alexandru Ioan Cuza” University of Iaşi, Romania
CORPORATE GOVERNANCE AND BANK PERFORMANCE IN ROMANIAN BANKING SYSTEM .... 219 Dan LUPU
Alexandru Ioan Cuza University of Iaşi, Romania Andra NICHITEAN
Alexandru Ioan Cuza University of Iaşi, Romania
ACCOUNTING TREATMENT FOR R&D ACTIVITIES IN ACCORDANCE WITH IFRS AND
ROMANIAN LEGISLATION ... 226
Lecturer PhD.Iuliana Oana MIHAI1,
Lecturer PhD. Camelia MIHALCIUC2,
Assistant Cosmin MIHAI1,
1
“Dun rea de Jos” University of Gala i, Romania, Business Administration Department
2
“Ştefan cel Mare” University of Suceava, Romania, Faculty of Economics and Public Administration
QUICK DETERMINATION MODEL OF INSOLVENCY FOR A COMPANY ... 237 Lecturer PhD. Student Cristina Rodica GRADEA
EFFECTS OF THE ROMANIAN ECONOMIC CRISIS UPON THE BANKING SYSTEM ... 245 PhD. Lecturer Gheorghe MOROSAN
„Stefan cel Mare” University of Suceava, Romania
COLLATERAL IN SMES’ LENDING:
BANKS’ REQUIREMENTS VS CUSTOMERS’ EXPECTATIONS ... 255 Assistant Professor Daniel BADULESCU
University of Oradea, Romania
THE CONSEQUENCES OF FRAUDULENT FINANCIAL REPORTING ... 264 Lecturer PhD. Mariana VLAD
Faculty of Economics and Public Administration, Ştefan cel Mare” University of Suceava, Romania
Associate Professor PhD. Mihaela TULVINSCHI
Faculty of Economics and Public Administration, Ştefan cel Mare” University of Suceava, Romania
Assistant PhD. Student Irina CHIRI
Faculty of Economics and Public Administration, Ştefan cel Mare” University of Suceava, Romania
FROM TOTAL TO STRUCTURAL HARMONIZATION IN THE FIELD OF EUROPEAN DIRECT TAXATION ... 269
PhD. Associate Professor Mihaela GÖNDÖR
“Petru Maior” University from Tîrgu Mureş, România
THE MONETARY TERMINOLOGY IN NATIONAL FINANCIAL SYSTEM ... 279 PhD. Student Elena DEJU
,,Ştefan cel Mare” University of Suceava, Romania PhD. Student Amalia-Florina POPESCU
,,Ştefan cel Mare” University of Suceava, Romania
REFERENCES OF CONNECTING SOME FISCAL SUBSYSTEMS WITH OBJECTIVES OF ECONOMIC AND SOCIAL DEVELOPMENT ... 285
PhD. Candidate Marius FRUNZ
Faculty of Economics and Business Administration, “Alexandru Ioan Cuza” University of Iaşi, Romania
PhD. Candidate Elena TOMA
Faculty of Economics and Business Administration, “Alexandru Ioan Cuza” University of Iaşi, Romania
SECTION 4... 295 STATISTICS, DATA PROCESSING (INFORMATICS) AND MATHEMATICS
A COMPARATIVE ANALISYS OF THE ROMANIAN DEVELOPEMENT REGIONS, IN TERMS OF ECONOMIC AND TOURISM INDICATORS ... 297
Adrian Liviu SCUTARIU
PhD. Student, “Alexandru Ioan Cuza” University of Iasi, Romania, Doctoral School of Economics
Assistant, “Ştefan cel Mare” University of Suceava, Romania, Faculty of Economics and Public Administration
Ioana CIOTIR
Assistant PhD.,„Al. I. Cuza” University, Iaşi, Romania, Faculty of Economics and Business Administration
THE ROLE OF VENDOR IN SOFTWARE PROJECTS ... 308 G.P. SUDHAKAR, MCA,M.Tech,EMBA,PMP,MIMA,ADM,(PhD in Progress)
Head (In-charge), IT Division, Engineering Staff College of India,Hyderabad, AP, India
SECTION 5... 314 LAW AND PUBLIC ADMINISTRATION
OVERVIEW OF HUMAN RESOURCE MANAGEMENT INLOCAL PUBLIC ADMINISTRATION ... 316
Lecturer PhD. Alunica MORARIU
MANAGING EMPLOYEES GRIEVANCES BY EMPLOYERS ... 323 Lecturer PhD. candidate Cristina B L NEASA
“Stefan cel Mare” University of Suceava, Romania Professor PhD.Aurel MANOLESCU
Academy of Economic Studies Bucharest, Romania
COMPARATIVE ASPECTS OF SELF-GOVERNANCE IN THE EU ... 329 Univ. PhD. Lecturer Dumitrita FLOREA (IONESCU)
University "Stefan cel Mare" Suceava, Romania
LAW OF 24 JUNE 1925 – ADMINISTRATIVE UNIFICATION LAW
PURPOSE, GOALS, LIMITS ... 337 Lecturer PhD. student Marilena Oana NEDELEA
Associate Professor Ph.D. Alexandru NEDELEA “Stefan cel Mare” University of Suceava, Romania
GENERAL FRAMEWORK OF IMPLEMENTING DECISION NO. 2002/584/JAI ON THE EUROPEAN ARREST WARRANT ... 348
Research Assistant Ana PÎRLAC
SECTION 1
SOCIAL LIFE CYCLE ASSESSMENT: METHODOLOGICAL AND IMPLEMENTATION ISSUES
Paola Karina Sanchez RAMIREZ Luigia PETTI
DASTA - Department of Business, Statistical, Technological and Environmental Sciences "G. D'Annunzio" University of Chieti-Pescara, Italy
Abstract:
This paper describes the development of the Social Life Cycle Assessment methodology. Introduce the debate about the inclusion of the social criteria in Life Cycle Assessment (LCA) and presents the actual framework. A second part presents and analyzes recent case studies published. This methodology allows increasing knowledge, providing information for decision makers and promoting improvement of social conditions in product life cycles. Its framework is at a very early stage compared to the Environmental Life Cycle Assessment and for its improvement it is necessary to carry out more case studies. One of the issues that are lacking into its development is the choice of social indicators for the inventory indicator and their standardization for the methodology application.
Keywords:Social Life Cycle Assessment, framework, case studies
JEL Classification: Q56
1. INTRODUCTION
Social Life Cycle Assessment (S-LCA) is a methodology that aims at assessing the potential social and socio-economic impact, both positive and negative, of products/services throughout the life cycle (i.e. from cradle to grave) (UNEP, 2009). It allows increasing knowledge, providing information for decision makers and promoting improvement of social conditions in product life cycles (Benoit et al., 2010).
The debate on how to deal with social and economic aspects into LCA began in 1993 with the publication of a SETAC Workshop Report: “A Conceptual Framework for Life Cycle Impact Assessment” (UNEP, 2009). The first reference of the S-LCA was in 1995 with the summary report "The social value of Life Cycle Assessment” (News & News, 1996). In 1996, O'Brien, Doig and Clift (1996), proposed the first way to integrate the S-LCA with environmental analysis, called “Social and Environmental Life Cycle Assessment” (SELCA). In that work, the authors supported the importance of integrating the results of the S-LCA with those of Environmental Life Cycle Assessment (ELCA). The same authors also stated that an integrated assessment (environmental, economic and social) provides a more complete and intuitive potential impact assessment of a product or service in its life cycle. This integrated approach liked with sustainable development can be understood as the concept of Life Cycle Thinking.
“Life Cycle Thinking is about going beyond the traditional focus on production sites and manufacturing processes so that the environmental, social and economic impact of a product over its whole life cycle” (UNEP, 2009). Following the “pillars of sustainability” (environmental, economic and social), Life Cycle Thinking is divided in Environmental Life Cycle Assessment (E-LCA), Life Cycle Costing (LCC) and the Social Life Cycle Assessment (S-LCA) (Petti and Campanella, 2009).
In 90s decade the discussion on how to deal with social and economic aspects into LCA has not undergone significant improvements, in the early 2000, the first methodologies regarding the social aspects were presented. In some of these studies, the method recommended was appointed as “S-LCA”. Some researchers referred to the letter “S” as “social” and others as “sustainability” (UNEP, 2009).
addresses the social impact at enterprise level using management information and SA 8000 focuses on the plant level; S-LCA uses information gathered at company, plant and process levels and it does so for the whole product life cycle (Benoit et al., 2010).
One important feature to be emphasised is that social impact is not directly linked to the production chain process of a product (Dreyer et al., 2006) (Dreyer et al., 2010b), it is not determined by physical flows, unlike the E-LCA, but from the way it interacts with the stakeholders (Jorgensen et al., 2008) (Hauschild et al., 2008). Therefore, the identification of all stakeholders involved on the product/service life cycle is a fundamental issue when performing an S-LCA.
2. FRAMEWORK
According to Weidema (2005) the application of ISO 14040 can be extended to S-LCA. Therefore the methodology has the same four phases of E-LCA: Goal and scope definition; Inventory analysis; Impact assessment and Interpretation.
Subsequently to Weidema statement, advances in the methodology development were undertaken because its framework was harmonized and had a similar structure of the former Environmental Life Cycle Assessment (E-LCA) that was already known by researchers.
The first proposal was from Weidema (2006) that created a new indicator at endpoint level. In the S-LCA we can find two types of indicators in the cause-consequence chain; this concept comes from the E-LCA approach. Midpoint indicators are constructed category indicators located somewhere along the cause-consequence chain, such as the global warming potential, instead, endpoint indicators are category indicators at the end of the cause-consequence chain, such as years of life lost (DALY) (Hertwich and Hammitt, 2001). The new indicator created by Weidema was called Quality of Adjusted Life Years (QALY). This indicator is composed by six damage categories under a general human life and well-being category. The indicator aggregates the results across the endpoint indicator into a single one, it is calculated by a combination of different statistics data. QALY should be understood in a similar way to the DALY indicator of World Health Organization (WHO). Therefore, QALY expresses reduced quality of living by shortening the life expectancy.
Norris (2006) proposed a method that uses the existing LCA impact endpoint of human health by introducing a simplified empirical relationship to characterize the health pathway, called Life Cycle Attribute Assessment (LCAA), to assist in the aggregation of data about processes attributes like “child-labor-free” or “fair Trade certification” of site specific information.
Hunkeler (2006) suggests the use of working hours as an intermediate variable in the calculation for the evaluation of societal life cycle assessment. He assumes that processes can be dismembered into labour statistics, considering only a single impact category. The approaches created by Weidema, Norris and Hunkeler have in common that make use of statistics data availability.
Dreyer, Hauschild and Schierbeck (2006) have defined a framework for Social Life Cycle Impact Assessment with a company perspective, affirming that companies have responsibility for the people affected by their business activities, but also are able to compete and make profit in order to survive in the marketplace. This shows that the two goals (social responsibility and the competitiveness in the market) are not in conflict with each other. Later, the same authors proposed a characterization model based on multi-criteria indicators to four impact categories (forced labor, discrimination, restrictions of freedom of association and collective bargaining and child labor) (Dreyer et al., 2010a). They also applied this model to six companies concluding that it is more suitable for larger traditional industries, primarily employing blue-collar workers, due the typical employment conditions, type and organization of work carried out (Dreyer et al., 2010b).
2007, the task force was renamed to Project Group (Benoit et al., 2010), which resulted in the book presenting the guidelines on S-LCA (UNEP, 2009).
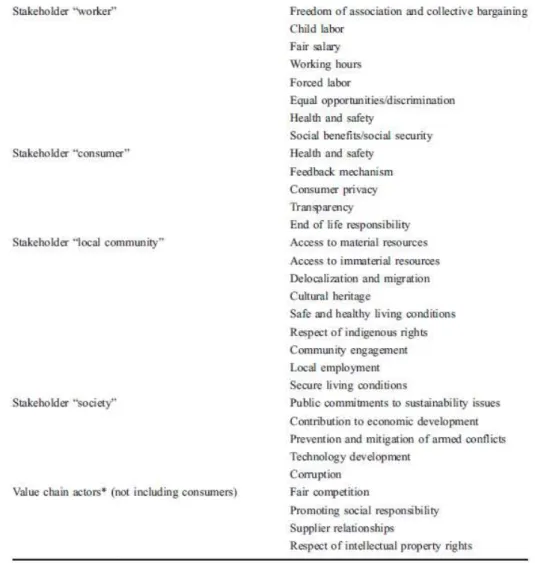
The guidelines propose two types of SLCIA approach of impact categories, which Parent, Cucuzzela and Reveret (2010) understand as characterization models. They also explain that the Type 1 use performance reference points, which means use of additional information, like international levels accepted as minimum performance, to understand the magnitude and the significance of the data collected in the inventory phase. The guidelines also established for the SLCIA approach Type 1 five stakeholder categories and the correspondent impact subcategories (table nr. 1) which were recognized internationally, although, the measurement and definition of these categories remains still a challenge. Not taking into account one of these subcategories should be justified, nevertheless new subcategories can be included. It is also important to highlight that the regionalization is an important issue because the context, in which the company is inserted, affects the relevant stakeholders involved in the product/service life cycle considered.
According to Parent, Cucuzzela and Reveret (2010) in SLCIA approach Type 2 the impact is assessed according to the use of impact pathways, where the inventory indicator is translated into a midpoint and after endpoint indicator. Furthermore, they also believe that for this type the approaches of Weidema and Hunkeler are indicated.
Ciroth and Franze (2009) proposed an assessment method to evaluate social impact with bases on the UNEP/SETAC guidelines. It’s a simple and intuitive assessment method that uses excel tables and colours (read, green, orange and white) to show the social impact level (positive, negative or not present) from qualitative data.
Traverso et al. (2010) used the tool Life Cycle Sustainability Dashboard to perform the impact assessment phase.
Recently, the Project Group has released methodology sheets for each impact subcategories for public consultation (UNEP, 2010). The purpose of these sheets is to help in the implementation of the S-LCA with the suggestion of inventory indicators for each stakeholder and subcategories (Benoit, 2010). Even being internationally recognized the subcategories measurement and the definition of impact categories are still a challenge.
3. CASE STUDIES
An accurate literature survey was carried out to identify as many papers as possible available about S-LCA case-studies published at national and international level. In order to have harmonized studies, the effort was focused in the studies that applied the guidelines from UNEP. The output was four case-studies, of which the subjects were: 1) polycrystalline photovoltaic (Traverso et al., 2010); 2) biofuels: ethanol, biodiesel and biogas (Blom and Solmar, 2009); 3) a bouquet of roses (Ciroth and Franze, 2009); 4) Services: Video Conferencing and News regarding mobile phone (Moberg et al., 2009).
Table 1. Stakeholder categories and subcategories. Source: Benoit et al. (2010).
Table 2. Case-studies characteristics Case-Study Characteristics Polycrystalline photovoltaic Biofuels: ethanol, biodiesel and biogas
A bouquet of roses Services: Video Conferencing and News regarding mobile phone
Geographic area of reference
Germany and Italy
Ethanol: Brazil to feedstock production, processing and refining Swedish for storage and transport to pump. Biodiesel and Biogas: Swedish. Ecuador and Netherlands: production phase; Netherlands: cutting and packaging phase
News regarding via mobile phone: offices in Sweden for production: editorial work ; Video Conferencing: user in Sweden just for users the other information are general
Product considered
Polycrystalline photovoltaic
Fuel type: ethanol,
biodiesel, biogas A rose bouquet
Services: Video Conferencing and News regarding via mobile phone
Continuation Table 2. Case-studies characteristics
Case-Study Characteristics Polycrystalline photovoltaic Biofuels: ethanol, biodiesel and biogas
A bouquet of roses Services: Video Conferencing and News regarding mobile phone
Objectives
Identification of hot spots or potential improvements of social aspects in the production and assembly phase
Performer social and economic impact hotspot of the production of the biofuels: ethanol, biodiesel and biogas. And identify the best socially sustainable option
The comparison of the social effects caused by the production of a rose bouquet in Ecuador and in Netherlands. And compare with the environmental assessment
Provide a basis for a discussion and consider the availability of
information for services (Video Conferencing and News regarding mobile phone)
Functional unit m2 of
Polycrystalline photovoltaic
Driving a car 100km
A bouquet of roses with 20 caulis per spray
News regarding via mobile phone: the average mobile reading of newspaper Y by one person during one year. Video Conferencing: one year of video conference meetings at Company A
System boundaries Production phase Feedstock production, processing, refining, storage and transport to pump
Production, cutting and packaging phase
Materials (raw and manufactured ones), production, use and disposal.
Data Origin
Research and interviews in two companies (one Italian and one German) of modules assembly Internet, in literature, from national statistics and from interviews with interest and trade organizations with reference to the geographic area of the study
Mainly from governmental or non-governmental organization, with reference to Ecuador and Netherlands
Primary Data: news-company mobile anonymous manager and one user MALIN Picha. Use of video Conferencing
equipement-TeliaSonera survey considering 574 employees answered the
production: the screen is fully automated and closed. Social impacts of notebooks production.)
Impacts assessment method Life Cycle Sustainability Dashboard.
Excel tables and proposing a score system to indicate positive, negative or not presence of social impacts and also an aggregation trough the impact categories
Own method
developed to the study with excel tables
--- No assessment performed
Strong points
First works published using company data. Also proposed the use of Dashboard to assess the social impacts
First case study. It is based on the methodology of the UNEP/SETAC. Also proposed a method to assess social impacts
The case study is based on the methodology of the UNEP/SETAC guidelines for SLCA. Also proposed a new method to assess social impacts
First case involving services which a classification on stakeholders category is made.
Category indicators for SLCA for use of Video Conferencing Equipment: – Usability, – Coordination With Other Daily Activities, – Efficiency.
A common problem in the assessment of social impacts is data availability. Data is often not available, is often qualitative and hard to quantify. Another common problem is the existence of different indicators for social impacts that render the interpretation of results difficult and not harmonized to make comparison of S-LCA studies.
3. CONCLUSIONS
This paper has established the state of the art of S-LCA methodology that is still in the early stages. Some work has been done to establish the framework, but much more is needed to make this methodology a useful tool for organizations (governmental and non- governmental) to assess their products. The choice of social indicators and their standardization for the methodology application still need to be developed. One assessment and aggregation method to the impact assessment phase, recognized by the Project Group from UNEP to be used in the S-LCA, is lacking. They are necessary to harmonise the results of the case studies. To improve the methodology it is also necessary to carry out more case studies to highlight where the methodology is weak. Indicators definition to be used for product categories that allow uniformity for S-LCA studies can be a feature.
REFERENCES
1. Benoit C., Norris G.A., Valdivia S., Ciroth A., Moberg A., Bos U., Prakash S., Ugaya C., Beck T. (2010), “The guidelines for social life cycle assessment of products: just in time!”,
The International Journal of Life Cycle Assessment, Vol. 15, Issue 2, pp. 156 – 163.
3. Ciroth A., Franze J. (2009), “Social Life Cycle Assessment of Roses - a Comparison of Cut Roses from Ecuador and the Netherlands”, presentation, Life Cycle Assessment Conference Boston IX, 29 September - 2 October 2009.
4. Dreyer L. C., Hauschild M. Z., Schierbeck J. (2006), “A Framework for Social Life Cycle Impact Assessment”, The International Journal of Life Cycle Assessment, Vol. 11, Issue 2, pp. 88 – 97.
5. Dreyer L. C., Hauschild M. Z., Schierbeck J. (2010a), “Characterization of social impacts in LCA. Part 1: development of indicators for labour rights”, The International Journal of Life Cycle Assessment, Vol.15, Issue 3, pp.247–259.
6. Dreyer L. C., Hauschild M. Z., Schierbeck J. (2010b). “Characterisation of social impacts in LCA. Part 2: implementation in six company case studies”, The International Journal of Life Cycle Assessment, Vol.15, Issue 4, pp. 385 –402.
7. Hauschild M.Z., Dreyer L.C., Jørgensen A. (2008), “Assessing social impacts in a life cycle perspective - Lessons learned”, CIRP Annals - Manufacturing Technology, Vol. 57, pp. 21–24.
8. Hertwich E. G., Hammitt J. K. (2001). “A Decision-Analytic Framework for Impact Assessment Part 2: Midpoints, Endpoints, and Criteria for Method Development”, The International Journal of Life Cycle Assessment, Vol.6, Issue 5, pp. 265 – 272.
9. Hunkeler D. (2006), “Societal LCA Methodology and Case Study”, The International Journal of Life Cycle Assessment, Vol. 11, Issue 6, pp. 371–382.
10. Moberg A., Picha M., Erlandsson-Segerström B., Karagianni C., Malmodin J., Wiklund L., (2009), Report from the KTH Centre for Sustainable Communications, ISSN:1654-479X,TRITA-SUS 2009:1, Printed by: US AB Stockholm.
11. News & News (1996), “Synthesis Report The Social Value of LCA”, The International Journal of Life Cycle Assessment, Vol 1, Issue 2.
12. Norris G. (2006), “Social Impacts in Product Life Cycles - Towards Life Cycle Attribute Assessment”, International Journal of Life Cycle Assessment, Vol. 11, Issue 1, pp. 97–104. 13. O’Brien M., Doig A., Clift R., (1996), “Social and environmental life cycle assessment
(SELCA)”, The International Journal of Life Cycle Assessment, Vol 1, Issue 4.
14. Petti L., Ardente F., Bosco S., De Camillis C., Masotti P., Pattara C., Raggi A., Tassielli G. (2010), “Stato dell’arte della Life Cycle Assessment (LCA) nel comparto vitivinicolo”.
Convegno Scientifico della Rete Italiana LCA, Padova.
15. Petti L., Campanella P. (2009). “The Social LCA: state of the art of an evolving methodology”, The Annals of the “Stefan Cel Mare” University of Suceava. Fascicle of the Faculty of Economics and Public Administration, Vol. 9, No.2 (10), pp.47-56.
16. Parent J., Cucuzzela C., Reveret J. (2010), “Impact assessment in SLCA: sorting the sLCIA methods according to their outcomes”, International Journal of Life Cycle Assessment, Vol. 15, Issue 2, pp. 164–171.
17. Traverso M., Francia A., Asdruball F., Finkbeiner M. (2010), “Social Life Cycle Assessment: un'applicazione al modulo fotovoltaico policristallino”, Convegno Scientifico della Rete Italiana LCA, Padova.
18. UNEP, (2009). Guidelines for social life cycle assessment of products, United Nations Environment Program, Paris SETAC Life Cycle Initiative United Nations Environment Programme ISBN: 978-92-807-3021-0.
19. UNEP, (2010). Methodological sheets of sub-categories of impact for a Social LCA. Available: < http://lcinitiative.unep.fr > accessed: 2010.
20. Weidema B. (2005), “ISO 14044 also Applies to Social LCA”, The International Journal of Life Cycle Assessment, Vol 10, Issue 6, pp. 381.
THE SOCIAL COST OF HOSPITAL WAITING LISTS AND THE CASE FOR COPAYMENT: EVIDENCE FROM GALICIA
Diego VARELA
Universidad de A Coruña, Faculty of Economics and Business, Campus de Elviña, 15071 A Coruña, Spain [email protected]
Anca TIMOFTE
Universidad de A Coruña, Faculty of Economics and Business, Campus de Elviña, 15071 A Coruña, Spain [email protected]
Abstract:
In this paper we try to quantify the social cost of hospital waiting lists in Galicia, on the basis of the model by Cullis and Jones (1986). From official data of waiting lists for outpatient appointments published by the Galician Health Service (Sergas) and a survey of specialist doctors in the province of A Coruña, we estimate that the cost of waiting lists is 70 million euros annually. We argue that this estimate, which does not include surgical waiting lists, tends to be conservative. Finally, as a possible measure to reduce the costs of waiting, we propose the introduction of a copayment, which would bring about a direct efficiency gain from the reduction in waiting costs and an indirect “efficiency dividend” from the revenue of the copayment, which may reduce the need for market distorting taxes.
Keywords: Waiting, rationing, copayment, efficiency, health
JEL Classification: I11, D45, H27
INTRODUCTION
In Romania in the 1980s, basic food products such as bread, oil or sugar were rationed and “in theory” could only be obtained on the basis of individual or family rationing cards. In practice, however, owning a rationing card did not guarantee in any way the acquisition of products rationed in this way. Often, the purchase of products from the “card” was an extremely costly process, requiring whole hours of waiting in queues in order to obtain goods that, in theory, were guaranteed by authorities through the rationing cards. The issue was even more dramatic for the rural population (especially cooperativist peasants), who faced even greater difficulties to get hold of oil, sugar or even bread.
Meat and meat products were also rationed and, yet, were very difficult to obtain. Thus, before the fall of the regime, the authorities had decided that in Bucharest salami would only be sold on the basis of the identity card that proved the condition of resident of the capital. Besides, each legal resident of Bucharest could buy, after long hours of standing at the queue, a maximum of 200 grams of salami. For a greater quantity, it was necessary to stand at the queue several times (Tismaneanu et al., 2007).
The situation of scarcity fostered the development of a sense of cynicism in the Romanian people. Thus, when some of them observed that, after long hours of waiting at the queue, the bread they bought was hard, one could hear comments like ‘the party authorities have ordered to wait until the bread gets hard before selling it in order to reduce demand.’ Comments of this kind contain a sort of popular wisdom that goes beyond the bread queue, as we will show when we analyze a related phenomenon, namely hospital waiting lists.
In May 2003 the Spanish Law for Cohesion and Quality of the National Health System established that it would be the autonomous communities the ones which would set the guarantees for maximum times of access to their menu of services. However, in the face of the unstoppable increase in patients waiting for surgery, in April 2004, the Ministry of Health committed to prepare a common protocol jointly with the autonomous communities in order to improve access to health services. On that date it was announced that no one should wait more than seven days for a basic diagnostic test, ten days for the first consultation with the specialist and 45 days for a programmed surgical intervention. More than five years later, those times are far away from reality.
Table 1. Patients in structural surgical waiting, by service. Sergas
Service Patients in waiting Average waiting time (days)
Angiology and vascular surgery 2,065 66
Cardiac surgery 320 86
Maxillofacial surgery 401 71
Paediatric surgery 1,157 85
Plastic and reconstructive surgery
1,335 96
Thoracic surgery 130 57
General and digestive surgery 5,368 63
Dermatology 338 34
Gynaecology 2,008 54
Neurosurgery 674 89
Ophthalmology 7,107 63
Otolaryngology 2,049 66
Traumatology 8,854 83
Urology 2,597 72
Total 34,403 71
Source: Galician Health Service (Sergas), 31/03/2009.
Table 1 shows the situation of waiting lists in Galicia at the end of March 2009. As the reader will notice, the figures are far from the objectives set by the Ministry of Health. The average waiting time for a surgical operation (not the maximum) exceeds the maximum set by the ministry in virtually all the specialties, with an overall average of 71 days. The number of patients waiting for a surgical intervention is also considerable, exceeding 34,000.
Table 2. Patients in waiting for a first outpatient appointment, by service. Sergas
Service Patients in waiting Average waiting time (days)
Allergology 3,175 47
Anaesthesiology and reanimation 315 62
Angiology and vascular surgery 3,631 108
Cardiology 5,302 41
Maxillofacial surgery 333 23
Paediatric surgery 1,004 42
Plastic and reconstructive surgery 1,352 83
Thoracic surgery 35 13
General and digestive surgery 7,121 32
Cardiac surgery 42 7
Dermatology 14,258 38
Digestive 9,442 56
Endocrinology 3,482 46
Geriatrics 434 45
Gynaecology 37,191 112
Clinical Haematology 620 44
Intensive medicine 6 24
Internal medicine 2,657 23
Nuclear medicine 7 11
Preventive medicine 165 25
Neonatology 7 15
Pulmonology 3,605 42
Neurosurgery 2,060 71
Neurology 8,677 77
Obstetrics 1,736 33
Ophthalmology 33,013 66
Medical oncology 82 11
Otolaryngology 7,901 27
Paediatrics 2,483 45
Psychiatry 4,254 26
Radio diagnostics 10 33
Radiotherapy 19 3
Rehabilitation 4,562 33
Rheumatology 5,730 62
Traumatology 24,443 54
Urology 8,734 56
Total 198,285 64
Source: Galician Health Service (Sergas), 31/03/2009.
The situation is not better as far as consultations with the specialist are concerned. Table 2 shows the state of waiting lists in Galicia at the end of March 2009 and even though the average waiting time (64 days) is somewhat shorter than the one for surgery, it is still far from the objective of the ministry for a maximum wait of 10 days. If we add up the great number of patients waiting for a first appointment (nearly 200,000), the situation is critical.
In this paper we will try to produce a monetary estimate for the social cost of waiting lists in Galicia based on official data and a survey of specialist doctors carried out by the authors in the spring of 2009. We will also make the case for copayment and the increase in the supply of doctors as a means of reducing this welfare cost. But it should be noted that the aim of copayment in this paper is not to reduce public spending on healthcare, but to decrease the cost of waiting lists for a service with excess demand at an exogenously given level of supply.
The rest of this paper is organised in four sections. In the second section we briefly review the literature on waiting lists, the estimation of their welfare costs and alternative rationing systems. In the third section we estimate the welfare cost of waiting lists in Galicia based on official data and our survey of specialist doctors carried out in the spring of 2009. On the fourth section, we present copayment and the increase in the supply of doctors as a means of reducing the welfare cost of waiting lists. Finally, on the concluding section we present a summary of the main results.
LITERATURE ON WAITING LISTS, WELFARE, AND POLICY ALTERNATIVES
The official explanation is that waiting lists are merely backlogs (Ministry of Health, 1963). These explanations imply that the rate at which services are demanded in each period equals the rate at which they are supplied, but due to a backlog of cases, the market does not meet demand at a given time. Total demand for a given period exceeds total supply for that period because of a backlog of cases from previous periods, but such a gap does not indicate a long-term inadequacy of resources to deal with demand. Instead, it represents a backlog of cases that could and should be eliminated through short-term concerted efforts such as, for instance, temporarily making additional operating theatres available, diverting beds from other specialties, reducing the duration of hospital stays, performing surgery in outpatient departments, making use of military and private hospitals, etc. (Lindsay and Feigenbaum, 1984).
The perspective of a long wait discourages many patients from demanding the public health services, opting in some cases for the subscription of private health plans. Indeed, Besley et al. (1999) show that longer waiting lists for treatment in the British National Health Service (NHS) are associated with more subscriptions of private health plans.
In other words, if in a free market system demand is rationed by increasing the price of products until the quantity demanded equals the quantity supplied, in a waiting list system rationing is achieved by increasing waiting times (thus decreasing the quality of service) until the quantity demanded equals the quantity supplied. This has considerable implications in terms of welfare.
Cullis and Jones (1986) develop the argument by Lindsay and Feigenbaum (1984) and propose a simple method to estimate the social cost of waiting lists. This is based on the fact that patients generally have one option to avoid waiting lists, namely private medicine. Indeed, despite the governmental prominence in the financing of health in many countries, the private health sector is still important. This is so even though most part of public provision is strongly subsidised and, in many cases, free of charge for the patient (Besley et al., 1999).
For Cullis and Jones (1986), therefore, the costs of waiting should not exceed the price of an equivalent service in the private sector, which provides us with a ceiling for the cost of waiting by any given patient. Obviously, waiting will not affect all patients on the list in the same way. Some will suffer the wait in such a way that the cost of waiting will be close to the maximum, i.e., the price of the private service (P). On the other hand, other patients will hardly suffer from waiting, so that their cost will be near zero. If we a assume that patients on the waiting list are uniformly distributed between these two extreme types, then the average cost will be equal to one half of the private cost of the service (P/2).
This finding coincides with the results of a natural experiment analysed by Deacon and Sonstelie (1985). As a consequence of price controls of gasoline imposed in the spring of 1980, a series of Chevron fuel stations in California were obliged to reduce the prices of gasoline. The resulting prices were lower than those of other main brand providers and, as expected, long queues formed in these Chevron stations. The authors interviewed the customers of a low cost fuel station and those of two nearby stations, Mobil and Union, where prices were free. All the consumers in the sample faced a choice between two alternatives: relatively cheap gasoline with a significant time of waiting or relatively expensive gasoline without waiting. By choosing one of the two alternatives, the interviewed drivers revealed information about the opportunity cost of their time. The estimations implied that about half of the rent transferred from the Chevron station was dissipated in costs of waiting.
An alternative method for estimating the social cost of waiting lists is contingent valuation. For instance, Propper (1990) draws estimations of the costs borne by patients in waiting lists for non-urgent medical treatments. The estimations indicate that the average valuation of a month in the waiting list for non-urgent treatments in England in 1987 was about 40 pounds, although there were significant interpersonal differences in the valuations. Bishai and Lang (2000) estimate how much the patients on the waiting list would be willing to pay for an operation of cataracts in Manitoba (Canada), Denmark and Barcelona in exchange for a reduction in their waiting time. Their estimate is that an average cataracts patient would be willing to pay between 24 and 107 dollars of 1992 for a reduction of one month in the waiting time.
The method by Cullis and Jones that we use in this paper presents a number of advantages with respect to contingent valuation. Firstly, it is not based on hypothetical questions but on verifiable hard facts. Secondly, by not asking respondents about waiting lists overtly, the risk of an elicitation bias is reduced. Finally, the simplicity of the method allows applying it to wider contexts in order to compare the results of different healthcare systems and examine the evolution of the costs of waiting throughout time.
the prioritization of patients by means of a point system based on their medical and social conditions (Rodríguez Míguez et al.).
ESTIMATING THE WELFARE COST OF WAITING LISTS IN GALICIA
In this section we apply the method by Cullis and Jones to the estimation of the social cost of waiting lists for outpatient appointments in Galicia. Data on the size of waiting lists and average waiting times by medical specialty are published every three months by the Galician Health Service (Sergas). To these data we must add an estimate of the price of an equivalent appointment without waiting in the private sector.
The average price of a private appointment with a specialist doctor depends on specialty. In this paper we have estimated the different prices by means of a telephone survey we carried out in March and April of 2009. In order to avoid the risk of elicitation bias, we did not mention the fact that this was a survey. We just asked the date of the next available appointment and an orientive price for a first consultation. When the doctors mentioned a price interval, we used the mean.
The sample was selected in a systematic way. The list of doctors was drawn from the yellow pages of the province of A Coruña (Páginas Amarillas, 2008-2009). We called, by strict order of apparition on the telephone directory, all the specialist doctors. When there was no answer we called the next doctor in the list. When we reached the end of the list we started again from the beginning. We repeated this process until we obtained three prices for each specialty. In the cases where we were unable to obtain a sample, because they were rare specialties, we used the average price of the rest of specialist doctors in general for whom we did have estimates.
From data on the size of waiting lists and the average waiting time published periodically by the Galician Health Service (Sergas) we can calculate the number of patients treated per year, by dividing the total number of patients in waiting at a given point by the average waiting time measured in years. We them multiply the resulting number by one half of the estimated price of a private appointment (P / 2) in order to obtain an estimate for the total cost of waiting for each medical specialty.
Table 3. Annual social cost of waiting lists for outpatient appointments in Galicia, 2009
Service Patients in
waiting
Average waiting time (days)
Patients per year
Price of a private appointment
Annual social cost (€)
Ophthalmology 33,013 66 182,572 80.00 7,302,876
Dermatology 14,258 38 136,952 96.67 6,619,567
Gynaecology 37,191 112 121,203 107.50 6,514,651
Traumatology 24,443 54 165,217 76.67 6,333,577
Digestive 9,442 56 61,542 166.67 5,128,570
Cardiology 5,302 41 47,201 196.67 4,641,484
Otolaryngology 7,901 27 106,810 80.00 4,272,393
Psychiatry 4,254 26 59,720 132.50 3,956,425
General and digestive surgery 7,121 32 81,224 95.00 3,858,136
Urology 8,734 56 56,927 123.33 3,510,401
Internal medicine 2,657 23 42,165 150.00 3,162,408
Neurology 8,677 77 41,131 130.00 2,673,530
Rehabilitation 4,562 33 50,458 90.00 2,270,632
Rheumatology 5,730 62 33,733 131.67 2,220,816
Pulmonology 3,605 42 31,329 115.00 1,801,427
Allergology 3,175 47 24,657 113.33 1,397,184
Endocrinology 3,482 46 27,629 90.00 1,243,301
Angiology and vascular surgery 3,631 108 12,271 127.50 782,304
Neurosurgery 2,060 71 10,590 110.00 582,458
Paediatric surgery 1,004 42 8,725 105.00* 458,075
Paediatrics 2,483 45 20,140 40.00 402,798
Nephrology 397 21 6,900 105.00 362,263
Plastic and reconstructive surgery 1,352 83 5,946 76.67 227,922
Maxillofacial surgery 333 23 5,285 85.00 224,594
Geriatrics 434 45 3,520 95.00 167,211
Clinical haematology 620 44 5,143 60.00 154,295
Preventive medicine 165 25 2,409 105.00* 126,473
Medical oncology 82 11 2,721 90.00 122,441
Radiotherapy 19 3 2,312 105.00* 121,363
Cardiac surgery 42 7 2,190 105.00* 114,975
Anaesthesiology and reanimation 315 62 1,854 70.00 64,905
Thoracic surgery 35 13 983 105.00* 51,591
Nuclear medicine 7 11 232 105.00* 12,194
Neonatology 7 15 170 105.00* 8,943
Radio diagnostics 10 33 111 105.00* 5,807
Intensive medicine 6 24 91 105.00* 4,791
Total 198,285 64 1,381,264 104.16 71,934,844
* Specialties for which no particular price could be estimated.
Source: Galician Health Service (Sergas), 31/03/2009 and telephone survey.
Table 3 is the result of applying the method by Cullis and Jones (1986) to waiting lists for outpatient appointments in the Galician Health Service (Sergas). The estimated annual cost of waiting amounts to 7.3 million euro for Ophthalmology, as a result of multiplying the number of patients (182 thousand) by the average cost of waiting (80/2). Similarly, the cost of waiting lists is estimated at 6.6 million euros annually for dermatology, 6.5 million for gynaecology, and so on.
The average cost of an appointment with a private specialist is around 105 euros, which implies an average cost of waiting of 52 euros for an average waiting time of 2 months (64 days), which leaves us with an average cost of waiting of 25 euros per month. This estimate would be conservative if we compare it with those by Propper (1990) for the UK and Bishai and Lang (2000) for Canada, Denmark and Spain based on the contingent valuation method. Even so, the estimated social cost of waiting lists for outpatient appointments amounts to 71.9 million euros annually.
COPAYMENT AND THE COST OF WAITING
The estimation above is based on the fact that consultations with specialist doctors in the Galician Health Service (Sergas), as in the British National Health Service of the 1880s analysed by Cullis and Jones (1986), are free of charge for users. But in other health systems patients must pay part of the cost of the service, which is known as copayment. As we will show below, such a copayment can affect the social cost of waiting lists considerably.
Figure 1. Effect of a copayment on the cost of waiting
Figure 1 shows the effects of a copayment (C) on the costs of waiting. The continuous line represents the marginal cost of waiting (MC), i.e. the cost of waiting for the marginal patient, in the absence of a copayment. These costs are entirely costs of waiting, and are increasing due to the sorting of patients as a function of the costs of waiting. In an extreme is the patient that is not bothered at all by waiting (MC = 0), whereas on the other extreme is the patient whose cost of waiting is equal to the cost of private service without waiting (P). People with a cost of waiting above P will not use the public service, as they will rather use the privately provided services. The total cost of waiting is equal to the area of the OSP’ triangle or, which is the same, one half of the private price P multiplied by the number of treated patients S, as in the model by Cullis and Jones (1986).
By introducing a copayment (C), the cost of access for the patient is now the addition of the cost of waiting plus the copayment (C). But the marginal patient treated by the public system will still have a cost of access (amount of the copayment plus the cost of waiting) equal to P. The number of patients is also kept constant at the level of full capacity of the system (S). Thus, the new marginal cost line is the dashed one that goes from C (the case of the patient who does not care to wait) to P’ (the case of the patient for whom it is indifferent between waiting for the public service and visiting a private doctor). The new marginal cost line has a lower slope than the one without copayment because, even though the subjective valuation of the cost of one day of waiting is unaffected, the copayment does reduce the average waiting time.
From a social point of view, the revenue from the copayment (C x S) is nothing but a transfer from the users of healthcare services to taxpayers, as it reduces the need of funds by the government. But a copayment also produces a net effect in terms of social welfare through the reduction in the costs of waiting. These costs are now the area represented by triangle CC’P’, this is, ½ x (P-C) x S. Therefore, the introduction of a copayment brings about a reduction in waiting costs equal to ½ x C x S, namely one half of the revenue from the copayment. In other words, each euro of copayment brings about a dividend of 50 cents in terms of social welfare.
Furthermore, because this efficient copayment reduces the need for public funds, it can lead to an additional indirect efficiency gain, as it reduces the need for market distorting taxes as a source of public finance. The benefit from this indirect effect is sometimes called ‘efficiency dividend’ and can be considerable, depending on the marginal cost of public funds. This cost varies among countries, mainly as a function of the structure of the tax system and the structure of the labour market. In the case of Spain, Sancho (2004) has estimated this welfare cost by means of a
P
C
Patients/year S
MC (Copayment = 0)
MC (Copayment = C)
P’
C’
computational general equilibrium model. The numerical results suggest that the marginal inefficiency of the tax system is considerable, of an order of 50% of the amount raised and spent under the conditions of budgetary balance at the margin (fixed public deficit). This implies that the total welfare gain (direct through waiting cost reduction plus indirect through the reduction in taxes) could reach 100% of the amount of the copayment.
There are other ways of introducing a deliberate cost of access to outpatient appointments that have been used in practice. One example is the requirement to sign up for the waiting list in person in the outpatient department of the hospital, far away from the health care centre and the domicile of the patient. This is often a practical requirement when there is a theoretical possibility to get the appointment by telephone, but patients are faced with a collapsed or unattended line. The costs of transport and time associated to this requirement (T) produce a similar effect to a copayment of the same amount in terms of reduction in the costs of waiting (½ x T x S). However, the private cost in terms of time and transport (T x S) is a deadweight loss from a social point of view, not a mere transfer from patients to taxpayers. Thus, the net impact of a measure of this type is a reduction in social welfare of one half of its amount (½ x T x S) with respect to the waiting lists that is supposed to combat.
Another implication of the model is that the cost of waiting decreases when the price of private health services decreases. This can be achieved mainly through an increase in the supply of doctors. An example of such a measure can be found in the increase in the supply of dentists in Spain during the last 20 years as a result of regulatory changes, which has been paired with lower inflation than other non-hospital health services and the consumer price index in general, as well as an increase in the use of the private dentist vis-à-vis the public one, despite the fact that the list of services covered by the public system has increased throughout this period (Pinilla Domínguez and Stoyanova, 2008).
CONCLUSIONS
In this article we have analysed the problem of hospital waiting lists. The standard version is that they are mere backlogs that would be solved with shock therapy. However, a more detailed analysis indicates that waiting lists act as rationing means to adjust the quantity of public health services demanded by users to the limited resources of the public system. The main difference with rationing by prices is that rationing by waiting lists reduces the quantity demanded by reducing the quality of the service provided. This reduction in quality has no counterpart in reduced costs of provision, so it represents a deadweight loss.
In this paper we have estimated the social costs of waiting lists for outpatient appointments in Galicia from the perspective of welfare economics by applying a method originally developed by Cullis and Jones (1986). Some of the advantages of this model are its objectivity and simplicity, which allows obtaining frequent updates of the estimates and comparing them to other healthcare systems. By applying this method, we estimated that the social cost of outpatient appointments in Galicia amounted to 71.9 million euros in 2009.
REFERENCES
1. Besley, Timothy, John Hall and Ian Preston (1999) 'The demand for private health insurance: do waiting lists matter?', Journal of Public Economics 72(2): 155-81.
2. Bishai, David M. and Hui C. Lang (2000) 'The willingness to pay for wait reduction: the disutility of queues for cataract surgery in Canada, Denmark, and Spain', Journal of Health Economics 19(2): 219-30.
3. Cullis, John G. and Philip R. Jones (1986) 'Rationing by Waiting Lists: An Implication', American Economic Review 76(1): 250-6.
4. Deacon, Robert T. and Jon Sonstelie (1985) 'Rationing by Waiting and the Value of Time: Results from a Natural Experiment', The Journal of Political Economy 93(4): 627.
5. Lindsay, Cotton M. and Bernard Feigenbaum (1984) 'Rationing by waiting lists', American Economic Review 74(3): 404-17.
6. Ministry of Health (1963) Reduction of Waiting Lists, Surgical and General, Hm(63)22.
London: HMSO.
7. Pinilla Domínguez, Jaime and Alexandrina P. Stoyanova (2008) 'Nuevas formas de organización empresarial en el mercado español de servicios dentales', Revista De Administración Sanitaria Siglo XXI 6(2): 339.
8. Propper, Carol (1990) 'Contingent valuation of time spent on NHS waiting lists', The Economic Journal 100(400): 193-9.
9. Rodríguez Míguez, Eva, Begoña Álvarez García and Pilar Abad Romero 'Modelos alternativos de gestión de las listas de espera en sanidad: aplicación al Servicio Galego de Saúde', Working Papers De La Fundación Pedro Barrié De La Maza 71.
10. Rodríguez, Marisol (2007) 'Los copagos en la atención médica y su impacto sobre la utilización, el gasto y la equidad', in Jaume Puig-Junoy (ed) La corresponsabilidad individual en la financiación pública de la atención sanitaria, pp. 79-100. Barcelona: Fundació Rafael Campalans.
11. Sancho, Ferrán (2004) 'Una estimación del coste marginal en bienestar del sistema impositivo en España', Hacienda Pública Española 169: 117-32.
WEALTH MANAGEMENT STRATEGIES IN THE ERA OF E-COMMERCE
Lecturer Mohammed Shahedul QUADER University of Science & Technology Chittagong
Chittagong, Bangladesh
Assistant Professor Mohammad SHAMSUDDOHA University of Chittagong, Bangladesh
[email protected] Lecturer Akhter JAHAN
University of Science & Technology Chittagong Chittagong, Bangladesh
Associate Professor Ph.D. Alexandru NEDELEA Stefan cel Mare University of Suceava, Romania
Abstract :
This paper looks at the key strategies being applied by wealth management and their competitive position. Each approach has merits, although the multi-channel ‘single brand’ approach seems to be gathering momentum. E-commerce facilitates differentiation and requires focus, whilst making cost leadership more difficult Choices between being a traditional or extended wealth manager, or simply a wealth product provider, are increasingly being made. Moreover need for strategic choice in the wealth management market is presented, before looking in more detail at the wealth management strategies commonly adopted. The relative success of each is considered, together with the competitive advantages to be gained.
Key Words: Wealth management, Strategies, E-commerce.
JEL Classification: E01, E21, N3, L81
INTRODUCTION
The main objective is to consider here the key strategies adopted by wealth managers, specifically in the context of the e-enabled environment. It also sought to understand the impact of adopting certain wealth management strategies upon the organisation’s competitive position. How strategies are applied depend upon the decision whether to be a ‘traditional’ ‘extended’ or ‘product’ provider. Ultimately, the challenge for organisation is to adopt the right strategic mix, as strategies are not mutually exclusive. E-commerce enhances the ability to offer multi-channel strategies, potentially reducing costs and improving customer management. However, careful branding must be applied, with the ‘single organisation, multi-channel’ option becoming dominant. To be successful such a strategy must offer a positive client experience, problem solving solutions and a unified view of the client’s overall relationship. Collaboration strategies can also be used, internally or on a B2B of B2C basis. However, they must create added value for the client (putting ‘familiar’ names together is insufficient). E-commerce may also expand client options, allowing smaller market competitors to collaborate with other and offer broader product choices. With new aggregation services and interactive tools being launched wealth managers face the risk of dis-intermediation in some sectors. The ‘internal’ aggregation offers the development of client interaction, by supplying improved information and knowledge to both sides. Brand value is also of greater importance online, where ‘trust’ in the medium is typically lower. A strong branding strategy leverages existing organisational strengths but must be customer focused and consistent in its message both off and online.
increasing pressure to increase client interaction and improve product choice, placing an additional burden upon client handlers, training and technology. Successful wealth managers will therefore thrive only if technology is used to complement, as opposed to replace, the relationship manager. With so many banks relying upon some form of segmentation of the High Net Worth Individuals (HNWI) market there is scope for quantitative research to be undertaken to establish how effective different segmentation approaches are. Are they effective, profitable or even practical is some cases? In addition, whilst market changes suggest the power of suppliers is falling (as their number have increased faster than apparent demand) the normal market reaction of intensified price competition has not been seen on as large a scale as in the retail financial services market. A study of the elasticity of both supply and demand in the wealth management market would therefore create prove of great use in reinforcing, or otherwise, the contention that ‘price’ in this highly specialized and often exclusive market is of far less importance to the HNWI then their overall service experience.
STRATEGIC CHOICE
Wealth management providers can no longer rely upon customer loyalty in the intergenerational wealth transfer process (Ackermann, 2000) and the traditional step-by-step approach to business transformation may no longer therefore be appropriate (Watkins, 2000). Instead wealth managers may need to make a strategic ‘leap’ away from traditional business models – based on process integration, service bundling scale economy and the monopolization of extensive branch network (Li 2001) also warns of the possible ‘deconstruction’ or ‘fragmentation’ of traditional banking models, with new entrants focusing on particular sections of, or processes involved in, the market]. New approaches may therefore be required, with the careful tracking of key market conditions/ activities through a bottom-up approach, with strong strategic leadership (Broady-Preston & Hayard 1998). Given the multi- channel delivery of many wealth management services there is little doubt that a traditional top-down approach would be slow to react to market changes, with real-time online services capable of rapid evolution and therefore requiring a much shorter strategic decision and implementation process.
Some also advocate a ‘blanched scorecard’ approach (measuring customer retention, acquisition, satisfaction and profitability) as a method to assess customer ‘success’ and convert this into workable goals within and overall wealth management strategy (Broady Preston & Haywood (1998) and Little et al (2000). This shifts the focus of the oranisation, towards the customer as the ultimate measurement of success and again in an e-enabled world, where online loyalties are not as great as we have seen in the more traditionally delivered private banking market this makes some sense. However, whichever, approach is adopted wealth managers must increasingly become more customer-focused and swift in their reaction to change. Robinson et al (2002) suggest that given clients’ needs and wealth manager’s capabilities then one of three business strategic should be pursued, as follows.
1. Traditional WM provider
Suited to private banks, trust companies and independent adviser. Provide comprehensive wealth management services, typified by high service quality, complementary external perception/branding, high skill levels, personal attention and strong advisory capaibilities/ access to own and third party products.
2. Extended WM Provider
Suited to large groups brokerages and retail banks. Provide breadth of products, strong technology and multiple channel access.
Suited to insurance companies and fund/ asset managers. Provide new and innovative products at segment level, develop ties with distributors and compete by distinguishing products with value added services or on price/performance.
Whilst in the context of overall market strategy there will be limited choices, the organisational strategies adopted to deliver such a market position will very, with the likelihood of multiple strategies being adopted, e.g. Charles Schwab & Co has adopted a multi-channel strategy, collaborating/outsourcing through its acquisition of US Trust Co, yet still maintaining its unique online branding strategy and thereby recognising changing customer loyalties, market segments and the value of the Internet in brand extension (Franklin & Latimore, 2002). Ultimately, the challenge for organisations is to adopt the right combination, and with this in mind the next sections will consider how e-commerce has impacted upon the strategic mix. Multi-channel, branding and segmentation strategies will therefore be considered, together with strategic collaboration and aggregation.
MULTI CHANNEL STRATEGY
E-commerce allows wealth managers to enhance sales channels or modify/ create new business process. In turn, where properly managed new channels can create increased revenues, reduce costs and better manage relationship [confidence that a multi-channel delivery strategy is cost competitive is high, with 78% of Eurozone banks (89% of UK banks) and 83% of Eurozone insurers (80% of UK insurers) agreeing (Gandy, 2001). However, delivery channel choices are often complex, requiring a willingness to cannibalise past investments and competencies in order to effectively transform from the ‘branch-based’ to the ‘multiple-distribution’ approach (Mols, 2000). This also has implications for the re-alignment of technology, human resources and resource allocation, plus a need for greater co-ordination across complementary channels.
Mols (1998) suggest that in considering future distribution strategy organisations should first determine which distribution channel combination best meets customers’ needs (see Figure 1 below) by asking what customers want, how much are they willing to pay, how such services can be provided and the costs of alternative distribution channels? In considering these questions it is worth looking at the experience of the wider financial services sector. In the report ‘New Business Models’ (Gandy-2000) the ‘bank within a bank or virtual new entrant’ business model was adopted by several established UK financial service prodders to avoid the cannibalisation of clients and enabling lower cost delivery/competitive pricing.


![Table no. 2. The quality classes for the sensorial evaluation of the pizza Score [points] Quality group](https://thumb-eu.123doks.com/thumbv2/123dok_br/16408666.194232/44.892.184.710.677.831/table-quality-classes-sensorial-evaluation-score-points-quality.webp)

![Table no. 7. Number of micro organisms colonies Time [min] Number of micro](https://thumb-eu.123doks.com/thumbv2/123dok_br/16408666.194232/47.892.268.622.104.281/table-number-micro-organisms-colonies-time-number-micro.webp)
