www.hydrol-earth-syst-sci.net/11/1621/2007/ © Author(s) 2007. This work is licensed under a Creative Commons License.
Earth System
Sciences
Tracing and quantifying groundwater inflow into lakes using a
simple method for radon-222 analysis
T. Kluge, J. Ilmberger, C. von Rohden, and W. Aeschbach-Hertig
Institute for Environmental Physics, University of Heidelberg, Im Neuenheimer Feld 229, 69120 Heidelberg, Germany Received: 16 May 2007 – Published in Hydrol. Earth Syst. Sci. Discuss.: 12 June 2007
Revised: 31 August 2007 – Accepted: 19 September 2007 – Published: 28 September 2007
Abstract. Due to its high activities in groundwater, the ra-dionuclide222Rn is a sensitive natural tracer to detect and
quantify groundwater inflow into lakes, provided the com-paratively low activities in the lakes can be measured accu-rately. Here we present a simple method for radon measure-ments in the low-level range down to 3 Bq m−3, appropriate for groundwater-influenced lakes, together with a concept to derive inflow rates from the radon budget in lakes. The an-alytical method is based on a commercially available radon detector and combines the advantages of established proce-dures with regard to efficient sampling and sensitive analysis. Large volume (12 l) water samples are taken in the field and analyzed in the laboratory by equilibration with a closed air loop and alpha spectrometry of radon in the gas phase. After successful laboratory tests, the method has been applied to a small dredging lake without surface in- or outflow in order to estimate the groundwater contribution to the hydrological budget. The inflow rate calculated from a222Rn balance for the lake is around 530 m3per day, which is comparable to the results of previous studies. In addition to the inflow rate, the vertical and horizontal radon distribution in the lake provides information on the spatial distribution of groundwater inflow to the lake. The simple measurement and sampling technique encourages further use of radon to examine groundwater-lake water interaction.
1 Introduction
In the Rhine Valley a large number of dredging lakes have been created during the last century as a result of extrac-tion of gravel and sand. These lakes are now often used as recreation areas. To estimate the impact of the newly cre-ated lakes on the hydrological system or the ecosystem by changes in the lakes themselves (direct introduction of
pol-Correspondence to:T. Kluge ([email protected])
lutants or nutrients) or in the surroundings (fertilization, cre-ation of new lakes and wells for water supply) more informa-tion about the groundwater-lake water interacinforma-tion is needed. This information is also of interest for the use of groundwater wells for drinking water purposes. The determination of the groundwater-lake water interaction is also important for the estimation of the nutrient budget and the prediction of the bio-geochemical evolution of the lake water, especially the eutrophication. The connection to the groundwater system is the most important component in the water budget of these lakes.
A network of seepage meters can be used to estimate di-rectly the inflow of groundwater (Lee, 1977). However, the uncertainty of this approach is high. If the aquifer is het-erogeneous, the spatial variation of the inflow can be large (Krabbenhoft et al., 1990), requiring a considerable number of seepage meters and a large effort to get acceptable results. Hydraulic heads of the groundwater in the lake’s surround-ings and typical evaporation and precipitation values can be used to determine the groundwater inflow indirectly. Using this method leads to large uncertainties due to unknown flow paths and small scale changes in the hydraulic conductivity (Wollschl¨ager et al., 2007). Furthermore, low hydraulic head gradients as in our study area may make it difficult to obtain sufficient precision.
lake water can be measured easily, small uncertainties have a large influence on the mass balance because of the compara-tively small signal differences between lake- and groundwa-ter.
We used in a similar way the radon isotope222Rn as a bud-get tracer. 222Rn is a radioactive noble gas isotope, which is produced by the decay of226Ra within the natural decay chain of238U. It decays byα-emission to218Po with a half life of 3.82 d. Despite the existence of other, more short-lived radon isotopes, we use the term radon synonymous to222Rn, which is the relevant isotope in our context. Radon emit-ted from the rocks or the sediment grains is dissolved and transported by the groundwater. As a result of outgassing to the atmosphere and the short lifetime of radon, concentration gradients are created between surface waters and groundwa-ter.
The strong gradients of radon between the reservoirs are used for applications in aquatic systems. For example,222Rn has been used as a tracer for the examination of the air-sea gas exchange (Roether and Kromer, 1978; Kawabata et al., 2003) or the estimation of vertical and horizontal mixing near the bottom boundary of lakes (Imboden and Emerson, 1984; Colman and Armstrong, 1987). Radon is particularly well suited to study groundwater-surface water interaction, because activity concentrations in groundwater (on the or-der of 1 to 100 kBq m−3, depending on the lithology) are much higher than in surface water (about 1 to 100 Bq m−3). This contrast has been used to study groundwater recharge and flow in the vicinity of rivers (Hoehn and von Gunten, 1989; Schubert et al., 2006). Furthermore, radon has been applied successfully and quite extensively in the investiga-tion of submarine groundwater discharge (e.g. Cable et al., 1996; Corbett et al., 1999, 2000; Crusius et al., 2005). Simi-larly, some studies used radon to asses groundwater exfiltra-tion into lakes (Corbett et al., 1997; Tuccimei et al., 2005; Trettin et al., 2006).
More frequent application of radon in groundwater-lake water interaction studies may be impeded by the specialized and extensive measurement procedure. In a conventional method for radon detection at low activity levels described by Mathieu et al. (1988), used for instance by Corbett et al. (1997, 1999, 2000), radon is extracted from large water samples by stripping with radon-free He, enriched on a char-coal trap cooled with dry ice, and subsequently detected in a scintillation cell. More recently, methods for continuous radon measurement have been proposed and used in studies of submarine groundwater discharge (Burnett et al., 2001; Lambert and Burnett, 2003; Dulaiova et al., 2005). This ap-proach offers the advantage of time series but requires time consuming measurements in the field with the respective lo-gistical effort. While adequate for studies in coastal regions with radon activity levels in the range of 100 Bq m−3 and variability on the tidal time scale, this approach may be less suitable for application in lakes, where even lower but steady radon activities are to be expected.
In this paper, an alternative, comparatively simple and cost method is presented, which can be used in the low-level range of surface waters without enrichment of radon and with a low effort in the field. As the continuous tech-niques, our method is based on a commercially available radon alpha spectrometer, which detects the radon activity in the gas phase. Using large sample containers and an appro-priate transfer system for radon from the sample water to the gas phase, the water activity can be determined at low levels with a sufficient accuracy with regard to the application in lakes.
In addition to the analytical method, a concept for the derivation of the groundwater inflow rate from the radon bal-ance within the lake is discussed. The applicability of this approach is demonstrated by a case study at a dredging lake in the Rhine Valley.
2 Materials and methods
Our method is based on the determination of the radon ac-tivity with the commercial alpha spectrometer RAD7 (Dur-ridge Company Inc., Bedford, MA, USA), which measures radon in the gas phase. The radon activity is deduced from the activity of its decay products (primarily218Po). The al-pha particles are detected in a discrete energy spectrum by a semiconductor crystal. The energy sensitive counting al-lows to separate all alpha-emanating polonium isotopes. The half-life of218Po (daughter of222Rn) is 3.1 min. The radon concentration can be derived by counting of the decay of
218Po, which is almost in equilibrium with the radon decay in
about 15 min. To increase the precision,214Po can be taken into account as well. Due to the longer half-life (26.8 min, 19.9 min) of the intermediate nuclides214Pb and214Bi this can only be done after about 3 h when the secular equilibrium is reached. The spectrum is recorded from 0 to 10 MeV with a resolution of 0.05 MeV (Durridge Co., 2000). Our device has a chamber sensitivity of 1 cpm at 151.7 Bq m−3. Typical background count rates are 1.2 to 1.5 counts per hour within the energy window of218Po.
Durridge Company offers two systems (Rad H2O, Rad
Aqua) for the extraction of radon from water samples and measurement with the RAD7 detector. Rad H2O is designed
for the analysis of small water samples (250 ml) with high activities (>400 Bq m−3). The air is circulated in a closed
Table 1.Different analytical methods and their detection limit. Counting times are typical values for the respective methods and are in part limited by the increasing background from the drying medium, except if a water trap is used. The detection limit is defined as the activity concentration that – using the stated sample size and during the given counting time – produces a background-corrected signal which deviates two standard deviations from zero (i.e., the 1σuncertainties of the listed values are 50%).
Method Sample volume (L) Counting time (min) Detection limit (Bq m−3)
Rad H2O 0.25 20 400
Rad H2O with N2-purging 0.25 60 160
Rad Aqua continuous 30 10
Rad Aqua Plus with N2-purging 12 60 8
Rad Aqua Plus with N2-purging and water trap 12 240 3
The Rad H2O procedure is suitable for groundwater
analy-ses, but its detection limit is in most cases too high to analyze surface water (typical detection limits achieved for the two standard techniques compared to improvements discussed below are listed in Table 1). In contrast, the Rad Aqua tech-nique is in principle suitable for the detection of groundwater exfiltration into surface waters, but due to the long equilibra-tion times, the measurements in the field are very time con-suming.
The Rad Aqua method has been used for continuous radon detection in coastal environments in order to investigate sub-marine groundwater discharge (Burnett et al., 2001; Lambert and Burnett, 2003). In this application, at least 20 min are required to reach equilibrium and up to several hours for the subsequent counting to obtain an acceptable uncertainty, thus a long time has to be spent at each sampling point. In order to be able to measure depth profiles in a reasonable time, several measurement systems have to be run in parallel (Du-laiova et al., 2005). Therefore we searched for an alternative way that provides simple and quick sampling in the field and measurement with adequate precision in the laboratory.
We developed a new setup for the sample preparation, which we call Rad Aqua Plus, that combines the advan-tages of the two standard techniques for our purpose. The method involves discrete samples as in Rad H2O, which can
be measured sequentially in the laboratory with only one de-tector. The required precision can be reached within reason-able counting times. However, larger (12 l) samples are used, which are taken in low-cost closed polypropylene buckets (diameter 26 cm, height 22.7 cm). The gas extraction from the samples is accomplished by an equilibration procedure as in Rad Aqua, but based on two closed loops (Fig. 1), one for the gas- and the other for the water circulation. The gas loop is connected to the alpha-detector RAD7 and the water circu-lation to the sample bucket. The water from the closed, air-free bucket is sprayed in a gas-exchange cylinder, in which the gas of the closed gas loop is pumped in counter current. Both loops are driven by pumps. The internal pump of RAD7 with a flow rate of about 1 L min−1is used for the gas loop. The water cycle is driven by a submersible pump (Barwig, 12V) with a flow rate of about 1.5 L min−1.
Rad7
Sample bucket Drystick
Drying unit
Water loop
Gas loop
Temperature-sensor
Pump
Fig. 1. Schematic diagram of the setup consisting of closed
wa-ter and gas loops, inwa-terconnected at the exchanger, where radon is transferred from the water to the gas cycle until equilibrium is reached. The equilibrium partitioning depends on temperature and the volume ratio of the two loops. The radon activity is measured in the gas loop with an alpha spectrometer (RAD7).
0 50 100 150 200 2
3 4 5 6 7 8 9 10
Radon Activity Conc
entration (Bq/l)
Storage Time (h)
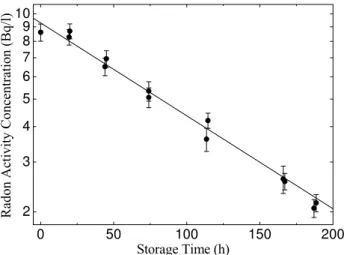
Fig. 2.Test of the tightness of the sampling buckets. Several
buck-ets were filled with the same water and then stored. The results are compared to the decay curve.
Furthermore, we observed that the desiccant used to re-move humidity from the air loop caused a significant back-ground. In a closed loop containing the CaSO4-drying unit
and the RAD7, the radon signal increased linearly with time up to some tens of counts per hour, even after intensive flush-ing of the whole system with nitrogen (Kluge, 2005). Usflush-ing a cold trap instead of the standard drying unit and purging with nitrogen reduces the background to a value of 1.2 to 1.5 counts per hour in the energy window of218Po. Detec-tion limits achieved with these modificaDetec-tions are listed in Ta-ble 1. For a typical 4 h measurement with the Rad Aqua Plus method a detection limit of 3 Bq m−3is obtained.
At the beginning of the measurement procedure, the gas cycle contains no radon. Then outgassing starts. This pro-cess continues until solubility equilibrium between the two phases is reached. Depending on the volume of the gas loop and the water flow rate through the exchange chamber, the equilibration takes 30 min up to several hours (Burnett et al., 2001). In our setup, equilibrium is reached after 40 min at a flow rate of 1.5 l min−1.
The radon extracted from the water samples is measured with the RAD7 radon monitor as a gas phase activity concen-trationCgas, which has to be converted to the activity
concen-tration in the waterCH2O, as follows:
CH2O =Cgas
V
gas
VH2O
+α(T )
(1)
whereVgas andVH2O are the volumes of the closed air and water loops, respectively, andα(T )is the temperature depen-dent partition coefficient (or Ostwald solubility) of radon. An equation forα(T )is given by Weigel (1978):
α(T )=0.105+0.405×e−0.0502×T (Tin◦C). (2)
At room temperature,αis about 0.25, indicating that the volumetric concentration in the gas phase is 4 times higher than in the water phase.
The buckets were filled on the lake by lowering a sub-mersible pump to the sampling depth and pumping the water up through a metal tube system. The tubes that are origi-nally designed for SF6-sampling provide an exact depth
de-termination and prevent contamination (von Rohden and Ilm-berger, 2001). The pump (Comet-Combi 12-4 T) is driven by 12 V batteries and provides a flow rate of 5 to 10 l per minute. The water from the sampling depth is first used to fill a large barrel, then a bucket is slowly filled brimful. The full bucket and its lid are immersed in the water of the barrel and fur-ther flushed for a few minutes before the sample container is closed without leaving any air bubbles.
To test the Rn-tightness of the 12 l buckets used for sam-pling, a series of water samples from the same source was stored for several days. One sample was measured imme-diately to determine the initial activity concentration of the water. Afterwards every day a sample was measured and compared to the expected value according to the decay curve. The test shows that the measured radon activity corresponds to the expected value for at least 7 d (Fig. 2).
In applications of radon in lakes it is necessary to differen-tiate between the radon entering through the sediment bound-ary and the radon constantly being produced in the water col-umn by dissolved226Ra. Often calculations only refer to the radon that is not supported by dissolved radium, the so-called excess radon (Schwartz, 2001). The contribution of the de-cay of dissolved radium to the radon concentration can be determined by measuring the samples a second time after a certain storage period. After 4 weeks the excess-radon in the lake sample is reduced to a negligible value (0.6% of the initial value) and the measured radon activity is equal to the decay rate of radium (Roether and Kromer, 1978). This equi-libration technique allows to determine the radon produced by the decay of dissolved radium at the same precision as the water samples.
Using large samples and radon transfer by equilibration in closed loops it is possible to measure water samples in the low level range. Typical uncertainties are about 10%, de-pending on the duration of the measurement and the activity concentration. For example, using a counting time of 4 h on a 12 l sample with an activity concentration of 25 Bq m−3, 93 counts with a background of 6±2 counts are detected. This leads to an uncertainty of 11%. The advantages of the method are the fast sampling in the field (only a few min-utes are necessary to fill the bucket) and the straightforward measurement process in the laboratory.
1 2 3 4 5 0
2 4 6 8
Comparison Nr.
Bq
/l
RadAquaPlus Rad H2O
Fig. 3.Comparison of the new method, called Rad Aqua Plus, with
Rad H2O measurements at different activites.
counting can start after a simple equilibration process of about 40 min. The minimum detectable activity reported by Mathieu et al. (1988) is about 0.7 mBq. The here presented method does not reach this detection limit (about 3 Bq m−3, see Table 1). However, for the study of the groundwater cou-pling in lakes that are strongly influenced by groundwater, as in the example discussed below, the sensitivity is sufficient and is a good tradeoff between applicability and precision.
Figure 3 shows the results of a comparison with Rad H2O
(extraction of 250 ml water samples) as reference method, performed on samples with relatively high activity concen-trations. It demonstrates that the two methods agree within uncertainties, but the measurements with Rad Aqua Plus are faster and yield smaller errors for the same counting period due to a higher counting rate. A sample activity concentra-tion of 6.5 Bq l−1leads to 10 cpm in case of Rad H2O and
about 90 cpm in case of Rad Aqua Plus.
3 Results
In order to demonstrate the practical applicability of the method to the investigation of groundwater-lake water inter-actions, a study at a dredging lake, where the groundwater inflow had previously been studied, was conducted. Lake Willersinnweiher is situated in the upper Rhine Valley in Southern Germany. It is one of several dredging lakes in this area. It has a narrow elongated shape (≈200×850 m)
with a mean depth of≈8 m and a maximum depth of 20 m
(Fig. 4). Its surface area is 0.145 km2and its volume is about 1.3×10⁶m3. Because there are no surface in- or outflows,
the water budget is controlled only by groundwater inflow and subsurface lake water outflow, precipitation and evap-oration. In this part of the Rhine Valley precipitation and
8°23,47 N
49°30,00 E
GWM C GWM B
L1 L2
L3
L5
H1 H7
H5 H4 H3 H2 N
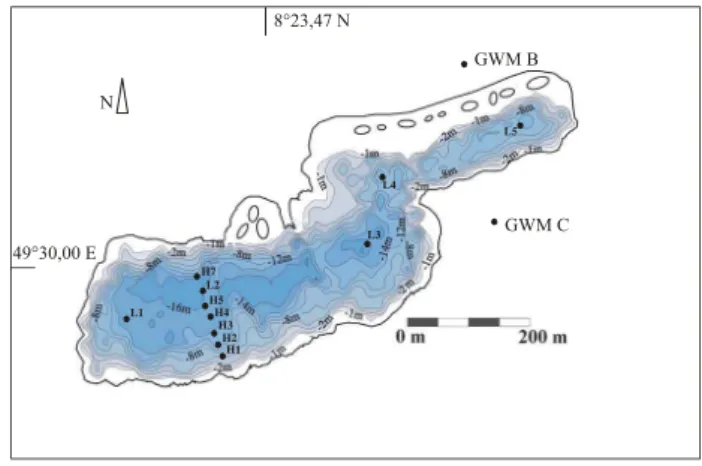
Fig. 4.Lake Willersinnweiher, modified from Sandler (2000). The
sampling points in the lake are numbered from L1 to L5 in case of the SE to NW longitudinal transect and from H1 to H7 for the transverse transect from South to North. The groundwater wells are GWM B and GWM C. Groundwater enters mainly on the southern lake shore, especially in the south-western part, and leaves the lake on the northeastern shore (Wollschl¨ager et al., 2007).
evaporation are in the same range averaged over one year. We therefore neglect their influence on the water balance.
Lake Willersinnweiher is embedded in about 30 m of young quarternary sandy-gravel sediments (HGK, 1999). Only a thin layer of lake sediment (up to 20 cm in the deepest part) has accumulated since the lake’s present morphology was formed in 1975 (Laukenmann, 2002). Groundwater flow is generally from south-west to north-east with typical flow velocities between 0.01 m d−1and at most 0.4 m d−1in the
inflow area. In the vicinity of the lake, samples were taken at two groundwater observation wells (GWM B, GWM C, Fig. 4) with a maximum depth of 25 m.
Water from the lake and the observation wells was sam-pled differently, according to the expected activity concen-tration. Groundwater in the study area has radon activities of 5 to 10 kBq m−3. Therefore, 250 ml glass bottles
ana-lyzed with the standard Rad H2O method are adequate.
Be-cause the activity of the lake water is lower (<50 Bq m−3),
larger sample volumes are necessary. In this case we used 12 l buckets and the new Rad Aqua Plus measurement pro-cedure.
The groundwater wells were sampled twice (31/01 and 4/03/2005), using three pumps operating simultaneously at different depths. The mean radon activity in the upper 5 m of the aquifer is 5700±100 Bq m−3. The concentration 7,
respectively 9 m below the water table differs between the two wells (mean at GWM B 5700 Bq m−3, at GWM C 6800 Bq m−3), perhaps due to heterogeneous deposits. In aquifer depths deeper than the lake bottom, the radon activity in both wells is similar with a mean of 6700±100 Bq m−3. In the
0 5 10 15 20 25 30 15
10 5 0
L1
typ. error epilimnion
hypolimnion thermocline
Depth (m)
Bq/m3
20/06/2005 4/07/2005 12/07/2005 19/07/2005 26/07/2005
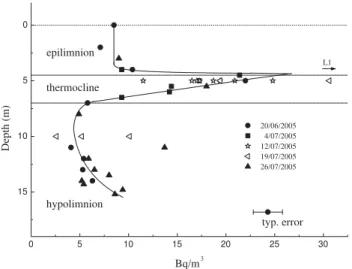
Fig. 5. Summary of vertical radon profiles in the middle of Lake
Willersinnweiher at station L2 (full symbols) and horizontal tran-sects including all stations in the main basin (open symbols), taken at different dates during the summer stratification period. The result at station L1 (5 m depth, 19/07/2005) is off scale (52.4 Bq m−3). The black line is a subjective fit based on the L2 data. The strong radon peak in the upper thermocline and the higher mean radon activity in the epilimnion compared to the hypolimnion indicate a groundwater inflow mainly in the upper part of the lake.
lake and a value of 5700 Bq m−3is used for the inflowing groundwater in the budget calculations discussed below.
Samples for the radon analysis of lake water were taken with a submersed pump at different locations and from dif-ferent depths. Vertical profiles at the central station L2 in the main lake basin (Fig. 4) were sampled at three days (20/06, 4/07, and 26/07/2005). Horizontal sections along and per-pendicular to the lake axis were taken at two other days (12/07 and 19/07/2005). The samplings took place during a period of stable summer stratification. The results of all samples are listed in Table 2 (vertical profiles) and Table 3 (horizontal sections).
The results of the vertical profiles from site L2 (Fig. 5) do not show strong temporal changes within the sampling period and are therefore interpreted together. The vertical resolution of the combined profile is about 0.5 m in the thermocline and towards the lake bottom and between 1 and 3 m in the rest of the water column. The profiles show activity concentrations ranging from 5 to 30 Bq m−3. In the epilimnion, including samples from the water surface, concentrations are constant within the uncertainty, at a mean value of 8.9±1.2 Bq m−3.
In the thermocline the activity is increasing to a maximum of
≈30 Bq m−3. In the hypolimnion, the radon concentration is
rather low with a mean of 6.1±1.9 Bq m−3.
The first horizontal transect of the radon activity was formed from south to north at the widest part of the lake, per-pendicular to the lake’s main axis. Samples were taken from 5 m depth with a horizontal spacing of the sampling sites of
about 20 to 30 m (H1 to H7, see Fig. 4). The second hor-izontal transect was performed from southwest to northeast along the main axis with samples from 5 and 10 m depth with a horizontal spacing of the sites of about 200 m (L1 to L5). Both sections also include samples from the central station L2, where they intersect.
Results from the sites of the horizontal transects located in the main part of the lake are shown in Fig. 5 along with the profiles from site L2. Sites L4 and L5 in the small north-eastern basin are excluded in Fig. 5 because this part of the lake is separated by a sill at about 8 m depth. The radon ac-tivities in the small basin are comparatively high, probably due to the proximity of the sampling points to the sediment as well as to possible groundwater inflow along the south-ern shore of this basin. In the main basin, the results from most of the stations are comparable to those from the cen-tral profiles at station L2, although the variability especially at a depth of 5 m is high. The large variation at this depth is probably due to the strong vertical gradients near the ther-mocline peak of the radon activity. Nevertheless, the highest activity of more than 50 Bq m−3was found at station L1 to-wards the southwestern end of the lake, indicating that the main groundwater inflow area is located there. The overall groundwater flow direction deduced from a numerical model (Wollschl¨ager, 2003) is in agreement with this result.
The radon activities in Lake Willersinnweiher displayed in Tables 2 and 3 and Fig. 5 are uncorrected total measured ac-tivities including the contribution from dissolved radium and excess radon. We refer to total radon activities and take the production from radium explicitly into account in the bud-get calculations in order to correctly represent the gas ex-change with the atmosphere. The activity of dissolved ra-dium was determined by measurements on two lake samples stored for several weeks. The radon activity concentration in these samples was in equilibrium with that of the dissolved radium, and yielded radium activites of about 4 Bq m−3 in the epilimnion and 2.6 Bq m−3in the hypolimnion. The rep-resentativeness of these few measurements was checked by a high resolution radium profile taken in 2007. This profile showed that the still present radon peak in the thermocline is not supported by dissolved radium, as the radium values were in general smaller than 2 Bq m−3.
For the estimation of the gas exchange flux, the atmo-spheric radon activity was measured. A 10 l air sample was taken by enriching the radon on a dry ice cooled charcoal trap. By heating the charcoal in the laboratory, the radon was purged into a closed loop with the RAD7, where the activity was measured to be 7.4±0.8 Bq m−3, which is in the range of
Table 2. Results of vertical profile measurements in Lake Willersinnweiher using the equilibration method Rad Aqua Plus. The samples were taken at the indicated dates and depths at station L2 (middle of the main basin, see Fig. 4). Typical uncertainties are 10 to 15% of the value.
20/06/2005 04/07/2005 26/07/2005
depth (m) CRn(Bq m−3) depth (m) CRn(Bq m−3) depth (m) CRn(Bq m−3)
0 8.5 4 9.3 3 9.0
2 7.1 4.5 21.4 5.5 18.0
4 10.4 5 17.3 8 4.9
5 22.0 5.5 14.4 11 13.7
7 5.8 6 14.2 12 5.9
11 4.1 6.5 9.3 13 6.5
12 5.4 13.5 8.0
13 5.3 14 6.2
14 6.5 14.3 5.4
16.8 24.3 14.8 9.4
15.2 8.6
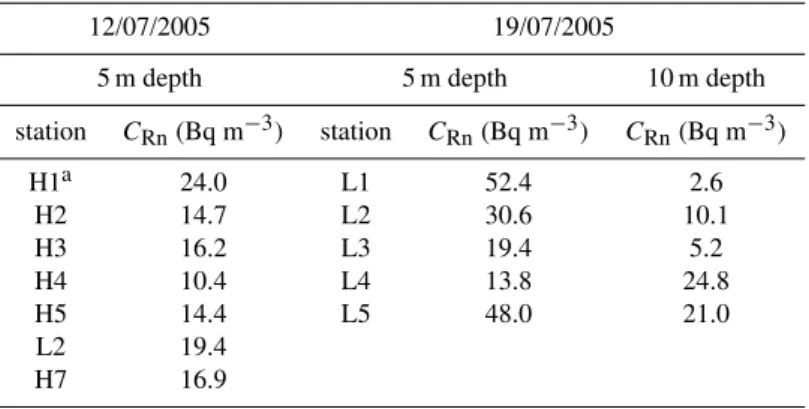
Table 3. Results of horizontal sections of radon measurements through Lake Willersinnweiher using the equilibration method Rad Aqua
Plus. The samples were taken on 12/07/2005 in a transversal section (stations H1 to H7, see Fig. 4) at a depth of 5 m (4.6 m for H1) and on 19/07/2005 in a longitudinal section (stations L1 to L5) at depths of 5 and 10 m. Typical uncertainties are 10 to 15% of the value.
12/07/2005 19/07/2005
5 m depth 5 m depth 10 m depth
station CRn(Bq m−3) station CRn(Bq m−3) CRn(Bq m−3)
H1a 24.0 L1 52.4 2.6
H2 14.7 L2 30.6 10.1
H3 16.2 L3 19.4 5.2
H4 10.4 L4 13.8 24.8
H5 14.4 L5 48.0 21.0
L2 19.4 H7 16.9
athe sample at station H1 was taken at 4.6 m depth
4 Discussion
The basic idea for the calculation of the groundwater inflow is to use the mass balance for the radon isotope (see Fig. 6). If the entire lake is homogeneously mixed and radon activity is at steady state, only the following quantities have to be de-termined: The mean radon activity concentration (Bq m−3) of the lake waterCla, a representative activity concentration
of the inflowing groundwaterCgw, the radium activity
con-centration (Bq m−3)of the lake waterC
Ra, a representative
value for the sediment fluxFsed, and the gas exchange flux
of radon from the lake to the atmosphereFsurf.
The variation in the lake level during the sampling cam-paign was in the cm range, so the lake volume as well as the exchange with the groundwater can be taken as constant. As the Rn activity concentrations in distinct water depths do not
change in time (see Fig. 5) it seems reasonable to assume steady state (i.e.,dCla/dt=0). Then the radon balance can
be written (compare Corbett et al., 1997):
Qgw(Cgw−Cla)+FsedAsed−FsurfAsurf−λRnV (Cla−CRa)=0
(3) Qgwis the groundwater in- and outflow in m3d−1,Asurfthe
lake surface,Ased the sediment surface area andV the total
volume of the lake. In case of lake Willersinnweiher, ground-water in- and outflow is assumed to be the same, because there is no surface in- and outflow and furthermore precipi-tation and evaporation are comparable.
tempera-Epilimnion
Thermocline Hypolimnion
Fsurf
Qgw
Fsed
Qgw
Qgw Qgw
Fsed
Fsed
decay internal source
RnCla
- + RnCRa
RnCla
- + RnCRa
Fig. 6.Box model of the stratified lake. Radon sources are
ground-water inflowQgw, sediment fluxFsed and the decay of dissolved
radium in the lake water (λRn×CRa). The radon concentration is
decreased by decay (λRn×Cla), outgassing to the atmosphereFsurf
and the outflow. The radon exchange between the two boxes is neglected, because of the stratification and the reduced transport through the thermocline.
ture change (thermocline) between 4.5 m and 7 m below the surface and the deepest layer (hypolimnion), which reaches from a depth of 7 m to the bottom. As the radon transport through the thermocline is strongly reduced, we neglect the radon fluxes from the epilimnion through the thermocline to the hypolimnion and vice versa. Therefore each layer can be regarded as a box, which does not exchange radon with the other parts. Furthermore, in the hypolimnion and the ther-mocline the gas exchange with the atmosphere does not have to be taken into account. Thus the radon balance (Eq. 3) for these boxes can be simplified, the gas exchange has to be in-cluded only in the epilimnion. ForCla,AsedandV the
corre-sponding values for the respective boxes have to be used (Ta-ble 4). Calculating the mass balance for the hypolimnion and the epilimnion separately, vertical differences in the ground-water inflow can be detected.
In the hypolimnion below 7 m depth no major groundwa-ter inflow appears to be present, as the radon concentration is rather low (Fig. 5). The increase of activity towards the lake bottom could be due to a small, localized groundwater inflow, but more likely it is produced by the sediment flux which is most important in the bottom layer with a large ra-tio of sediment area to water volume. In general, radium decay, groundwater inflow and sediment flux are the sources for the hypolimnic radon. In order to estimate the maximum possible groundwater inflow, we consider the limiting case of negligible sediment flux. Balancing the groundwater inflow and the decay terms yields a maximum groundwater inflow ofQgw=(52±30) m3d−1, which is small compared to the
to-tal volume of the hypolimnion (470 000 m3). Even with this maximum groundwater inflow, the hypolimnion water mass
would be renewed only once in about 25 a, in the absence of the winterly overturn.
The constant radon concentrations in the epilimnion show that the upper 4.5 m of the lake’s water column are well mixed. In contrast, vertical mixing is strongly suppressed in the thermocline between about 4.5 and 7 m depth (von Rohden et al., 2007). A strong radon peak, representing a clear groundwater signal, is present in the upper thermocline (Fig. 5). As there is a minimum of the sediment surface to water volume ratio at this depth, we do not ascribe this to the morphology of the lake in conjunction with the sediment flux.
For a first estimation, we interpret the peak as a result of a uniform radon input due to groundwater inflow into the upper part of the lake. This signal is preserved in the thermocline but strongly reduced in the epilimnion due to gas exchange. In other words, we assume that if there was no gas exchange, the radon concentration would be 22 Bq m−3(mean value at
L2 in 5 m depth) throughout the epilimnion and the thermo-cline. Using this value and neglecting the sediment flux, the balance calculation leads to a maximum value for the ground-water inflow of (475±140) m3d−1for the upper part of the
lake (<7 m depth, volume 830 000 m3).
Combining the above first estimates for the hypolimnion and the epilimnion, the total groundwater inflow to the lake is estimated to (530±140) m3d−1, which corresponds to
(1350±350) mm a−1 and a replacement time between 5.2
and 9.1 a. This maximum estimate is close to the lower end of the results of former studies: A calculation of the inflow with a groundwater flow model based on piezometer data and stable isotopes (Wollschl¨ager, 2003) yielded a range of 446 to 1726 m3d−1(replacement time: 2 to 8 a). Balancing of the calcite sedimentation (Schmid, 2002) resulted in 630 to 1060 m3d−1(3 to 5 a).
The actual radon activity in the epilimnion above 4.5 m depth is much lower than the maximum in the thermocline. Assuming that the difference is entirely due to outgassing to the atmosphere, the gas exchange flux can be calculated, and using the difference between the radon activity at the surface (8.9±1.2 Bq m−3)and the equilibrium concentration with the air (≈1.8 Bq m−3), the gas transfer velocity can be computed. This calculation performed for the water body above 4.5 m depth (volume 580 000 m3)results in a transfer velocitykfor Rn of 1.3 m d−1, which is a rather high value compared to a value of k=0.6 m d−1 calculated from wind data (mean wind speed is around 2 m s−1)using a relation-ship given by Upstill-Goddard et al. (1990) ork=0.3 m d−1 according to a relationship of Wanninkhof (1992).
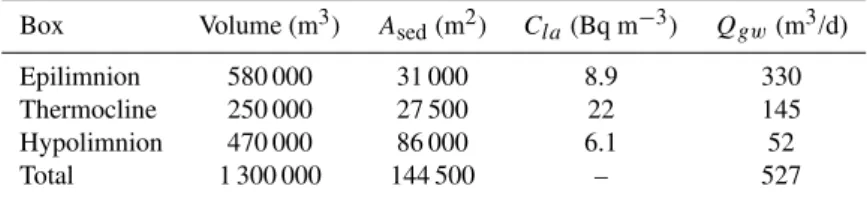
thermo-Table 4. Values used for the balance calculations. Asedis the sediment surface in each box. The according mean radon activity isCla.
Throughout the thermocline a mean radon activity concentration of 22 (Bq m−3)was assumed. The groundwater inflow rateQgwis
calcu-lated neglecting the sediment flux. Therefore the results represent an upper limit.
Box Volume (m3) Ased(m2) Cla(Bq m−3) Qgw(m3/d)
Epilimnion 580 000 31 000 8.9 330 Thermocline 250 000 27 500 22 145 Hypolimnion 470 000 86 000 6.1 52 Total 1 300 000 144 500 – 527
cline could sink or rise to the layer where the probability of achieving neutral buoyancy is largest.
The above calculations rely on several assumptions. An essential requirement is a complete horizontal mixing of the lake on a time scale smaller than the half-life of222Rn,
ad-mitting the assumption of horizontal homogeneity so that the central profile can be taken as representative for the entire lake. Peeters et al. (1996) reported horizontal eddy diffu-sivities in lakes in the range of 0.02 to 0.3 m2s−1. Using these values and a typical horizontal dimension of 100 m (half width) for Lake Willersinnweiher, the mixing timescale lies between 5 and 70 h. This is comparable to the radon half-life of 92 h, hence the requirement of horizontal homogene-ity is at best approximately fulfilled. In fact, the horizontal sections revealed inhomogeneity especially in the epilimnion (see Fig. 5 and Table 3). The activity is decreasing from the suspected groundwater entry zone (south-west) to the north-eastern end of the main basin of the lake.
The requirement of a good horizontal mixing will limit the application of the simple box model concept based on only one central radon profile to rather small lakes. In case of larger lakes, the horizontal mixing time will be in the range of days or weeks, which in view of the short half-life of radon must lead to horizontal concentration gradients. In this case it is not possible to calculate the groundwater inflow from one vertical profile, but a three dimensional mapping of the radon distribution would be required. This has, on the other hand, the advantage that the groundwater entry areas can be located.
A large uncertainty originates from the scatter of the ac-tivity concentration in the thermocline. The values measured at 5 m depth at station L2 vary from 19 to 30 Bq m−3, pos-sibly due to horizontal inhomogeneity and a variable degree of advection of groundwater influenced water. Further uncer-tainties arise from the assumptions about the distribution of the groundwater inflow in the upper part of the lake and the effect of gas exchange. The sharp peak in the thermocline is possibly not only the result of the gas exchange at the sur-face, but also due to the buoyancy driven interstratification of the inflowing groundwater in the thermocline.
A way to reduce the uncertainty of the effect of gas ex-change would be to monitor the temporal evolution of the
radon concentration in the epilimnion and the radon inven-tory in the entire lake over an extended period of time, as demonstrated by Corbett et al. (1997). Seasonal changes in the vertical stratification of the lake should lead to a dynamic evolution of the radon concentrations that can be interpreted in terms of gas exchange, vertical mixing, and groundwater input. The analytical method presented here is suitable to conduct such an extended study, which we plan to realize in the future.
5 Conclusions
The method using large buckets for sampling, radon trans-fer by equilibration between water- and gas cycles, and the measurement with an energy sensitive alpha spectrometer is well suited for the detection of the radon activities in lakes which are influenced by groundwater. The method in-volves rapid sampling, followed by precise radon measure-ments in the laboratory. The presented field example from Lake Willersinnweiher shows that the approach allows the detection and quantitative estimation of groundwater inflow to lakes.
The groundwater inflow estimated by a simple radon bal-ance is comparable to the results of former studies. A signif-icant advantage of the radon method is that it allows to dis-tinguish groundwater inflow to the hypolimnion and the epil-imnion during stratification, and to locate groundwater entry areas in the horizontal dimension. However, more data over a longer time period with changing vertical stratification and better horizontal resolution would be needed to reduce the uncertainties of the inflow estimation and to obtain a more detailed picture of the spatial distribution of the groundwater inflow.
References
Burnett, W. C., Kim, G., and Lane-Smith, D.: A continuous monitor for assessment of222Rn in the coastal ocean, J. Radioanal. Nucl. Chem., 249, 167–172, 2001.
Cable, J. E., Bugna, G. C., Burnett, W. C., and Chanton, J. P.: Ap-plication of222Rn and CH4for assessment of groundwater
dis-charge to the coastal ocean, Limnol. Oceanogr., 41, 1347–1353, 1996.
Colman, J. A. and Armstrong, D. E.: Vertical eddy diffusivity deter-mined with222Rn in the benthic boundary layer of ice-covered lakes, Limnol. Oceanogr., 32, 577–590, 1987.
Corbett, R., Burnett, W. C., Cable, P. H., and Clark, S. B.: Radon tracing of groundwater input into Par Pond, Savannah River Site, J. Hydrol., 203, 209–227, 1997.
Corbett, R., Dillon, K., Burnett, W. C., Chanton, J., and Rutkowki, C.: Patterns of groundwater discharge into Florida Bay, Limnol. Oceanogr., 44, 1045–1055, 1999.
Corbett, R., Dillon, K., Burnett, W. C., and Chanton, J.: Estimating the groundwater contribution into Florida Bay via natural tracers, Rn-222 and CH-4, Limnol. Oceanogr., 45, 1546–1557, 2000. Crusius, J., Koopmans, D., Bratton, J. F., Charette, M. A., Kroeger,
K. D., Henderson, P., Ryckman, L., Halloran, K., and Colman, J. A.: Submarine groundwater discharge to a small estuary esti-mated from radon and salinity measurements and a box model, Biogeosciences, 2, 141–157, 2005,
http://www.biogeosciences.net/2/141/2005/.
Dulaiova, H., Peterson, R., Burnett, W. C., and Lane-Smith, D.: A multi-detector continuous monitor for assessment of222Rn in the coastal ocean, J. Radioanal. Nucl. Chem., 263, 361–365, 2005. Durridge Co.: RAD7 radon detector – Owner’s manual, available at
http://www.durridge.com/Manuals.htm, 2000.
Durridge Co.: RAD7 RAD-H20 – Radon in water accessory –
Owner’s manual, available at http://www.durridge.com/Manuals. htm, 2001a.
Durridge Co.: RAD AQUA – Continuous radon-in-water monitor-ing system, available at http://www.durridge.com/Manuals.htm, 2001b.
Hoehn, E. and von Gunten, H.: Radon in groundwater: a tool to assess infiltration from surface waters to aquifers, Water Resour. Res., 25, 1795–1803, 1989.
HGK, Arbeitsgruppe Hydrogeologische Kartierung und Grund-wasserbewirtschaftung Rhein-Neckar-Raum: Hydrogeologis-che Kartierung und Grundwasserbewirtschaftung Rhein-Neckar-Raum, Analyse des Ist-Zustandes, Technical report, Minis-terium f¨ur Ern¨ahrung, Landwirtschaft, Umwelt und Forsten Baden-W¨urttemberg, Hessischer Minister f¨ur Landesentwick-lung, Umwelt, Landwirtschaft und Forsten, Ministerium f¨ur Landwirtschaft, Weinbau und Forsten Rheinland-Pfalz, 1999. Imboden, D. and Emerson, S.: Natural radon and phosphorus as
limnologic tracers: Horizontal and vertical eddy diffusion in Greifensee, Limnol. Oceanogr., 29, 831–844, 1984.
Kawabata, H., Narita, H., Harada, K., Tsunogai, S., and Kusakabe, M.: Air-sea gas transfer velocity in stormy winter estimated from radon deficiency, J. Oceanogr., 59, 651–661, 2003.
Kluge, T.: Radon als Tracer in aquatischen Systemen, Diploma the-sis, Univ. Heidelberg, 2005.
Krabbenhoft, D. P., Bowser, C. J., Anderson, M. P., and Valley, J. W.: Estimating groundwater exchange with lakes 1. The sta-ble isotope mass balance method, Water Resour. Res., 26, 2445–
2453, 1990.
Lambert, M. J. and Burnett, W. C.: Submarine groundwater dis-charge estimates at a Florida coastal site based on continuous radon measurements, Biogeochem., 66, 55–73, 2003.
Laukenmann, S.: Transport und Austausch redoxsensitiver Ele-mente zwischen Freiwasser und Sediment in einem eutrophen Hartwassersee (Willersinnweiher/Ludwigshafen), unter beson-derer Ber¨ucksichtigung des geochemischen Verhaltens von Uran, Ph.D. thesis., Univ. Heidelberg, 2002.
Lee, D. R.: A device for measuring seepage flux in lakes and estu-aries, Limnol. Oceanogr., 22, 140–147, 1977.
Levin, I., Born, M., Cuntz, M., Langend¨orfer, U., Mantsch, S., Nae-gler, T., Schmidt, M., Verlagin, A., Verclas S., and Wagenbach, D.: Observations of atmospheric variability and soil exhalation rate of radon-222 at a Russian forest site, Tellus, 54B, 462–475, 2002.
Mathieu, G. G., Biscaye, P. E., and Lupton, R. A.: System for mea-surement of Rn-222 at low levels in natural waters, Health Phys., 55, 982–992, 1988.
Peeters, F., W¨uest, A., Piepke, G., and Imboden, D.: Horizontal mixing in lakes, J. Geophys. Res., 101, 18 361–18 375, 1996. Roether, W. and Kromer, B.: Field determination of air-sea gas
exchange by continuous measurement of radon-222, Pure Appl. Geophys., 116, 476–485, 1978.
Sandler, B.: Die Wirkung von Sanierungs- und Restaurierungs-maßnahmen auf die N¨ahrstoffstr¨ome und die biotische Dynamik eines anthropogenen Gew¨assers am Beispiel des Willersinnwei-hers/Ludwigshafen, Ph.D. thesis, Univ. Heidelberg, 2000. Schmid, J.: Calcitf¨allung und Phosphor-Kopr¨azipitation im
Phos-phorhaushalt eines eutrophen Hartwassersees mit anoxischem Hypolimnion (Willersinnweiher, Ludwigshafen am Rhein), Ph.D. thesis., Univ. Heidelberg, 2002.
Schubert, M., Knoeller, K., Treutler, H.-C., Weiss, H., Dehnert, J.:
222Rn as a tracer for the estimation of infiltration of surface
wa-ters into aquifers, in: Radionuclides in the environment, edited by: Povinec, P. P. and Sanchez-Cabeza, J. A., Radioactivity in the environment, Vol. 8, Elsevier, Amsterdam, 326–334, 2006. Schwartz, M. C.: Significant groundwater input to a coastal plain
estuary: assessment from excess radon, Estuar. Coast. Shelf S., 56, 31–42, 2003.
Trettin, R., Gl¨aßer, W., Lerche, I., Seelig, U., and Treutler, H.-C.: Flooding of lignite mines: isotope variations and processes in a system influenced by saline groundwater, Isot. Environ. Health S., 42, 159–179, 2006.
Tuccimei, P., Salvati, R., Capelli, G., Delitala, M. C., and Primav-era, P.: Groundwater fluxes into a submerged sinkhole area, Cen-tral Italy, using radon and water chemistry, Appl. Geochem., 20, 1831–1847, 2005.
Upstill-Goddard, R. C., Watson, A. J., Liss, P. S., and Liddicoat, M.: Gas transfer velocities in lakes measured with SF6, Tellus,
42B, 364–377, 1990.
von Rohden, C. and Ilmberger, J.: Tracer experiment with sulfur hexafluoride to quantify the vertical transport in a meromictic pit lake, Aquat. Sci., 63, 417–431, 2001.
Wanninkhof, R.: Relationship Between Wind Speed and Gas Ex-change Over the Ocean, J. Geophys. Res., 97, 7373–7382, 1992. Weigel, F.: Radon, Chemiker-Zeitung, 102, 287–298, 1978. Wollschl¨ager, U.: Kopplung zwischen Oberfl¨achenwasser und
Grundwasser: Modellierung und Analyse von Umwelttracern, Ph.D. thesis., Univ. Heidelberg, 2003.
Wollschl¨ager, U., Ilmberger, J., Isenbeck-Schr¨oter, M., Kreuzer, A., von Rhoden, C., Roth, K. and Sch¨afer, W.: Coupling of ground-water and surface ground-water at Lake Willersinnweiher: Ground-water modeling and tracer studies, Aquat. Sci., 69, 138–152, doi:10.1007/s00027-006-0825-6, 2007.