HESSD
4, 1519–1548, 2007Radon in lakes
T. Kluge et al.
Title Page
Abstract Introduction
Conclusions References
Tables Figures
◭ ◮
◭ ◮
Back Close
Full Screen / Esc
Printer-friendly Version
Interactive Discussion
EGU
Hydrol. Earth Syst. Sci. Discuss., 4, 1519–1548, 2007 www.hydrol-earth-syst-sci-discuss.net/4/1519/2007/ © Author(s) 2007. This work is licensed
under a Creative Commons License.
Hydrology and Earth System Sciences Discussions
Papers published inHydrology and Earth System Sciences Discussionsare under open-access review for the journalHydrology and Earth System Sciences
Tracing and quantifying groundwater
inflow into lakes using radon-222
T. Kluge, J. Ilmberger, C. von Rohden, and W. Aeschbach-Hertig
Institute for Environmental Physics, University of Heidelberg, Im Neuenheimer Feld 229, Heidelberg, Germany
Received: 16 May 2007 – Accepted: 29 May 2007 – Published: 12 June 2007
HESSD
4, 1519–1548, 2007Radon in lakes
T. Kluge et al.
Title Page
Abstract Introduction
Conclusions References
Tables Figures
◭ ◮
◭ ◮
Back Close
Full Screen / Esc
Printer-friendly Version
Interactive Discussion
EGU Abstract
Due to its high activities in groundwater, the radionuclide222Rn is a sensitive natural tracer to detect and quantify groundwater inflow into lakes, provided the comparatively low activities in the lakes can be measured accurately. Here we present a simple method for radon measurements in the low-level range down to 3 Bq m−3, appropriate
5
for groundwater-influenced lakes, together with a concept to derive inflow rates from the radon budget in lakes. The analytical method is based on a commercially available radon detector and combines the advantages of established procedures with regard to efficient sampling and sensitive analysis. Large volume (12 l) water samples are taken in the field and analyzed in the laboratory by equilibration with a closed air loop
10
and alpha spectrometry of radon in the gas phase. After successful laboratory tests, the method has been applied to a small dredging lake without surface in- or outflow in order to estimate the groundwater contribution to the hydrological budget. The inflow rate calculated from a 222Rn balance for the lake is around 530 m3 per day, which is comparable to the results of previous studies. In addition to the inflow rate, the
15
vertical and horizontal radon distribution in the lake provides information on the spatial distribution of groundwater inflow to the lake. The simple measurement and sampling technique encourages further use of radon to examine groundwater-lake interaction.
1 Introduction
In the Rhine Valley a large number of dredging lakes have been created during the last
20
century as a result of excavation of gravel and sand. These lakes are now often used as recreation areas. To estimate the impact of the newly created lakes on the hydrological system or the ecosystem by changes in the lakes itself (direct introduction of pollutants or nutrients) or in the surroundings (fertilization, creation of new lakes and wells for water supply) more information about the groundwater-lake interaction is needed. This
25
HESSD
4, 1519–1548, 2007Radon in lakes
T. Kluge et al.
Title Page
Abstract Introduction
Conclusions References
Tables Figures
◭ ◮
◭ ◮
Back Close
Full Screen / Esc
Printer-friendly Version
Interactive Discussion
EGU
determination of the groundwater-lake interaction is also important for the estimation of the nutrient budget and the prediction of the bio-geochemical evolution of the lake water, especially the eutrophication. The connection to the groundwater system is the most important component in the water budget of these lakes.
A network of seepage meters can be used to estimate directly the inflow of
ground-5
water. However, the uncertainty of this approach is high. If the aquifer is heteroge-neous, the spatial variation of the inflow can be large (Krabbenhoft et al., 1990), re-quiring a considerable number of seepage meters and a large effort to get acceptable results.
Hydraulic heads of the groundwater in the lake’s surroundings and typical
evapo-10
ration and precipitation values can be used to determine indirectly the groundwater inflow. Using this method leads to large uncertainties due to unknown flow paths and other effects caused by changes in the hydraulic conductivity (for instance sealing of the deeper lake layers by mud, decomposition products and sedimentation of mineral dust).
15
The groundwater inflow can also be estimated indirectly by balancing of tracers, such as stable isotopes, tritium, salts or radon. The stable isotopes deuterium and18O are a useful tool to examine the groundwater-lake interaction. However, the problem of this method is the relatively large uncertainty resulting from the measurement error and seasonal variability of the isotopic composition of the evaporation flux, the lake
20
water and the groundwater inflow (Yehdegho et al., 1997). The isotopic composition of the evaporative flux can not be measured directly and theoretical approaches are charged with high uncertainty. Although the isotopic composition of the lake water can be measured easily, small uncertainties have a large influence on the mass balance because of the comparatively small signal differences between lake- and groundwater.
25
HESSD
4, 1519–1548, 2007Radon in lakes
T. Kluge et al.
Title Page
Abstract Introduction
Conclusions References
Tables Figures
◭ ◮
◭ ◮
Back Close
Full Screen / Esc
Printer-friendly Version
Interactive Discussion
EGU
synonymous to222Rn, which is the relevant isotope in our context. Radon emitted from the rocks or the sediment grains is dissolved and transported by the groundwater. As a result of the short lifetime, concentration gradients are created between groundwater and surface waters.
The strong gradients of radon between the reservoirs are used for applications in
5
aquatic systems. For example,222Rn has been used as a tracer for the examination of the air-sea gas exchange (Roether and Kromer, 1978) or the estimation of vertical and horizontal mixing near the bottom boundary of lakes (Weiss et al., 1984; Imboden and Emerson, 1984). Radon is particularly well suited to study groundwater-surface water interaction, because activity concentrations in groundwater (2 to 100 kBq m−3,
10
depending on the lithology) are much higher than in surface water (1 to 100 Bq m−3). This contrast has been used to study groundwater recharge and flow in the vicinity of rivers (Hoehn and von Gunten, 1989). Furthermore, radon has been applied suc-cessfully and quite extensively in the investigation of submarine groundwater discharge (e.g. Cable et al., 1996; Corbett et al., 1999, 2000; Crusius et al., 2005). Comparable
15
use of radon to asses groundwater exfiltration into lakes has received less attention (Corbett et al., 1997).
One reason of the minor role of radon in groundwater-lake interaction studies might be the specialized and extensive measurement procedure. In a conventional method for radon detection at low activity levels described by Mathieu et al. (1988), used for
20
instance by Corbett et al. (1997, 1999, 2000), radon is extracted from large water sam-ples by stripping with radon-free He, enriched on a charcoal trap cooled with dry ice, and subsequently detected in a scintillation cell. More recently, methods for continuous radon measurement have been proposed and used in studies of submarine groundwa-ter discharge (Burnett et al., 2001; Lambert and Burnett, 2003; Dulaiova et al., 2005).
25
HESSD
4, 1519–1548, 2007Radon in lakes
T. Kluge et al.
Title Page
Abstract Introduction
Conclusions References
Tables Figures
◭ ◮
◭ ◮
Back Close
Full Screen / Esc
Printer-friendly Version
Interactive Discussion
EGU
even lower but steady radon activities are to be expected.
In this paper, an alternative, comparatively simple and low-cost method is presented, which can be used in the low-level range of lake and surface waters without enrichment of radon and with a low effort in the field. As the continuous techniques, our method is based on a commercially available radon alpha spectrometer, which detects the radon
5
activity in the gas phase. Using large sample containers and a modified transfer system for radon from the sample water to the gas phase, the water activity can be determined at low levels with a sufficient accuracy with regard to the application in lakes.
In addition to the analytical method, a concept for the derivation of the groundwater inflow rate from the radon balance within the lake is discussed. The applicability of this
10
approach is demonstrated by a case study at a dredging lake in the Rhine Valley.
2 Materials and methods
Our method is based on the determination of the radon activity with the commercial alpha spectrometer RAD7 (Durridge Company Inc., Bedford, MA, USA), which mea-sures radon in the gas phase. The radon activity is deduced from the activity of its
15
decay products (primarily218Po). The alpha particles are detected in a discrete energy spectrum by a semiconductor crystal. The energy sensitive counting allows to sepa-rate all alpha-emanating polonium isotopes. The half-life of218Po (daughter of222Rn) is 3.1 min. The radon concentration can be derived by counting of the decay of218Po, which is almost in equilibrium with the radon decay in about 15 min. To increase the
20
precision,214Po can be taken into account as well. Due to the longer half-life (24 min, 20 min) of the intermediate nuclides214Pb and214Bi this can only be done after about 3 h when the equilibrium is reached. The spectrum is recorded from 0 to 10 MeV with a resolution of 0.05 MeV (Durridge Co., 2000). Typical background count rates are 1.2 to 1.5 counts per h within the energy window of218Po.
25
Durridge Company offers two systems (Rad H2O, Rad Aqua) for the extraction of
HESSD
4, 1519–1548, 2007Radon in lakes
T. Kluge et al.
Title Page
Abstract Introduction
Conclusions References
Tables Figures
◭ ◮
◭ ◮
Back Close
Full Screen / Esc
Printer-friendly Version
Interactive Discussion
EGU
is designed for the analysis of small water samples (250 ml) with a high activity (>400 Bq m−3
). The air is circulated in a closed cycle through an air-tight water bottle, containing the sample to extract the radon. The other system (Rad Aqua) is designed for continuous measurements. Sample water is pumped through a gas exchange cylin-der, which is connected to the air cycle. Radon outgasses from the water until
equilib-5
rium is reached. In both cases the air cycle is connected to the radon alpha detector via a drying unit to remove water vapor. Detailed descriptions of the RAD7 detector as well as the two water extraction procedures are available (Durridge Co., 2000, 2001a, b).
The Rad H2O procedure is suitable for groundwater analyses, but its detection limit is 10
too high to analyze surface water (typical detection limits achieved for the two standard techniques compared to improvements discussed below are listed in Table 1). In con-trast, the Rad Aqua technique is in principle suitable for the detection of groundwater exfiltration into surface waters, but due to the long equilibration times, the measure-ments in the field are very time consuming.
15
The Rad Aqua method has been used for continuous radon detection in coastal en-vironments in order to investigate submarine groundwater discharge (Burnett et al., 2001; Lambert and Burnett, 2003). In this application, at least 20 min are required to reach equilibrium and up to several h for the subsequent counting to obtain an ac-ceptable uncertainty (Burnett et al., 2001), thus a long time has to be spent at each
20
sampling point. In order to be able to measure depth profiles in a reasonable time, sev-eral measurement systems have to be run in parallel (Dulaiova et al., 2005). Therefore we searched for an alternative way that provides simple and quick sampling in the field and measurement with adequate precision in the laboratory.
We developed a new setup for the sample preparation, which we call Rad Aqua Plus,
25
that combines the advantages of the two standard techniques for our purpose. The method involves discrete samples as in Rad H2O, which can be measured sequentially
HESSD
4, 1519–1548, 2007Radon in lakes
T. Kluge et al.
Title Page
Abstract Introduction
Conclusions References
Tables Figures
◭ ◮
◭ ◮
Back Close
Full Screen / Esc
Printer-friendly Version
Interactive Discussion
EGU
in low-cost polypropylene buckets (diameter 26 cm, height 22.7 cm) with an air tight lid. The gas extraction from the samples is accomplished by an equilibration procedure as in Rad Aqua, but based on two closed loops (Fig. 1), one for the gas- and the other for the water circulation. The gas loop is connected to the alpha-detector RAD7 and the water circulation to the sample bucket. The water from the closed, air-free bucket is
5
sprayed in a gas-exchange cylinder, in which the gas of the closed gas loop is pumped in counter current. Both loops are driven by pumps. The internal pump of RAD7 with a flow rate of about 1 L min−1is used for the gas loop. The water cycle is driven by a
submersible pump (Barwig, 12 V) with a flow rate of about 1.5 L min−1.
In order to enable the analysis of low radon activities, special care was taken to
10
reduce the background counting rate. The background caused by the ambient air in the gas loop is unimportant in case of high radon concentrations or the continuous measurement system. In the continuous method, the initial radon activity from the air is gradually removed by equilibration with the through flowing water. In a system with a closed water- and air cycle it is not negligible if the water activity is below 50 Bq m−3.
15
Typical air activities in the Rhine Valley (Heidelberg) are 2 to 30 Bq m−3 (Levin et al., 2002). Thus, in order to get rid of the air background and to prepare a well defined initial state, the whole system is purged with Rn-free nitrogen. We found that the background can be substantially reduced by flushing the air loop with nitrogen for 10 min prior to each analysis.
20
Furthermore, we observed that the dessicant used to remove humidity from the air loop caused a significant background count rate. Using a cold trap instead of the standard drying unit and purging with nitrogen reduces the background to a value of 1.2 to 1.5 counts per hour in the energy window of218Po. Detection limits achieved with these modifications are listed in Table 1. For a typical 4 h measurement with the
25
Rad Aqua Plus method a detection limit of 3 Bq m−3is obtained.
HESSD
4, 1519–1548, 2007Radon in lakes
T. Kluge et al.
Title Page
Abstract Introduction
Conclusions References
Tables Figures
◭ ◮
◭ ◮
Back Close
Full Screen / Esc
Printer-friendly Version
Interactive Discussion
EGU
the water flow rate through the exchange chamber (Burnett et al., 2001). In our setup, equilibrium is reached after 40 min at a flow rate of 1.5 l min−1
.
The radon extracted from the water samples is measured with the RAD7 radon mon-itor as a gas phase activity concentrationCgas, which has to be converted to the activity
concentration in the waterCH
2O, as follows:
5
CH2O =Cgas Vgas
VH2O
+α(T)
!
(1)
whereVgas and VH2O are the volumes of the closed air and water loops, respectively,
and α(T) is the temperature dependent partition coefficient (or Ostwald solubility) of radon. An equation forα(T) is given by Weigel (1978):
α(T)=0.105+0.405·e−0.0502·T (T in◦C). (2)
10
At room temperature, α is about 0.25, indicating that the volumetric concentration in the gas phase is 4 times higher than in the water phase.
The buckets were filled on the lake by lowering a submersible pump to the sampling depth and pumping the water up through a metal tube system. The tubes that are originally designed for SF6-sampling provide an exact depth determination and prevent 15
contamination. The pump (Comet-Combi 12–4 T) is driven by 12 V batteries and pro-vides a flow rate of 5 to 10 l per minute. The buckets are flushed for a few minutes and filled brimful without leaving any air bubbles after closing.
In applications of radon in lakes it is necessary to differentiate between the radon entering through the sediment boundary and the radon constantly being produced in
20
the water column by dissolved226Ra. Often calculations only refer to the radon that is not supported by dissolved radium, the so-called excess radon.
The contribution of the decay of dissolved radium to the radon concentration can be determined by measuring the samples a second time after a certain storage period. After 4 weeks the excess-radon in the lake sample is reduced to a negligible value and
25
HESSD
4, 1519–1548, 2007Radon in lakes
T. Kluge et al.
Title Page
Abstract Introduction
Conclusions References
Tables Figures
◭ ◮
◭ ◮
Back Close
Full Screen / Esc
Printer-friendly Version
Interactive Discussion
EGU
1978). This equilibration technique allows to determine the radon produced by the decay of dissolved radium at the same precision as the water samples.
Using large samples and radon transfer by equilibration in closed loops it is possible to measure water samples in the low level range. Typical uncertainties are about 10%, depending on the duration of the measurement and the activity concentration. For
5
example, using a counting time of 4 h on a 12 l sample with an activity concentration of 25 Bq m−3, 93 counts with a background of 6±2 counts are detected. This leads
to an uncertainty of 11%. The advantages of the method are the fast sampling in the field (only a few minutes are necessary to fill the bucket) and the straightforward measurement process in the laboratory.
10
Compared to the radon analysis method described by Mathieu et al. (1988), it is not necessary to enrich radon on charcoal and to perform an extensive extraction with vacuum pumps and helium purging. The whole process described by Mathieu et al. (1988) takes about 2 h for extraction and gas transfer from a 19 l water sample, whereas in our procedure the counting can start after a simple equilibration process
15
of about 40 min. The minimum detectable activity reported by Mathieu et al. (1988) is about 0.7 mBq/m−3. The here presented method does not reach this detection limit
(about 3 Bq m−3, see Table 1). However, for the study of the groundwater coupling in lakes that are strongly influenced by groundwater, as in the example discussed below, the sensitivity is sufficient and is a good tradeoffbetween applicability and precision.
20
Figure 2 shows the results of a comparison with Rad H2O (extraction of 250 ml
wa-ter samples) as reference method, performed on samples with relatively high activ-ity concentrations. It demonstrates that the two methods agree within uncertainties, but the measurements with Rad Aqua Plus are faster and yield smaller errors in the same counting period due to a higher counting rate. A sample activity concentration of
25
6.5 Bq l−1leads to 10 cpm in case of Rad H
2O and about 90 cpm in case of Rad Aqua
Plus.
HESSD
4, 1519–1548, 2007Radon in lakes
T. Kluge et al.
Title Page
Abstract Introduction
Conclusions References
Tables Figures
◭ ◮
◭ ◮
Back Close
Full Screen / Esc
Printer-friendly Version
Interactive Discussion
EGU
immediately to determine the initial activity concentration of the water. Afterwards ev-ery day a sample was measured and compared to the expected value according to the decay curve. The test shows that the measured radon activity corresponds to the expected value for at least 7 d (Fig. 3).
3 Results
5
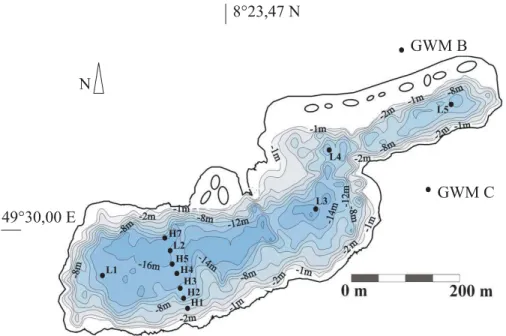
In order to demonstrate the practical applicability of the method to the investigation of groundwater-lake interactions, a study at a dredging lake, where the groundwater inflow had previously been studied, was conducted. Lake Willersinnweiher is situated in the upper Rhine Valley in Southern Germany. It is one of several dredging lakes in this area. It has a narrow elongated shape (≈200×850 m) with a mean depth of
10
≈8 m and a maximum depth of 20 m (Fig. 4). Its surface area is 0.145 km2 and its
volume is about 1.3×10⁶m3. Because there are no surface in- or outflows, the water
budget is controlled only by groundwater in- and outflow, precipitation and evaporation. Precipitation and evaporation do not affect the radon balance significantly, because they have negligible radon concentrations. In this part of the Rhine Valley precipitation
15
and evaporation are in the same range averaged over one year. Their influence to the water balance is small and therefore we neglect evaporation and precipitation in the discussion of the water balance.
Lake Willersinnweiher is embedded in about 30 m of young quarternary sandy-gravel sediments (HGK, 1999). Groundwater flow is generally from south-west to north-east
20
with typical flow velocities between 0.01 m d−1and at most 0.4 m d−1in the inflow area. In the vicinity of the lake, samples were taken at two groundwater observation wells (GWM B, GWM C, Fig. 4) with a maximum depth of 25 m.
Water from the lake and the observation wells was sampled differently, according to the expected activity concentration. Groundwater in the study area has radon activities
25
of 5 to 10 kBq m−3. Therefore, 250 ml glass bottles analyzed with the standard Rad H 2O
HESSD
4, 1519–1548, 2007Radon in lakes
T. Kluge et al.
Title Page
Abstract Introduction
Conclusions References
Tables Figures
◭ ◮
◭ ◮
Back Close
Full Screen / Esc
Printer-friendly Version
Interactive Discussion
EGU
larger sample volumes are necessary. In this case we used 12 l buckets and the new Rad Aqua Plus measurement procedure.
The groundwater wells were sampled twice (31 January and 4 March 2005), using three pumps operating simultaneously at different depths. The mean radon activity in the upper 5 m of the aquifer is 5700±100 Bq m−3. The concentration 7, respectively
5
9 m below the water table differs between the two wells (mean at GWM B 5700 Bq m−3, at GWM C 6800 Bq m−3), perhaps due to heterogeneous deposits. In aquifer depths deeper than the lake bottom, the radon activity in both wells is similar with a mean of 6700±100 Bq m−3. As only the shallow groundwater can enter the lake, a value of
5700 Bq m−3is used for the inflowing groundwater in the budget calculations discussed
10
below.
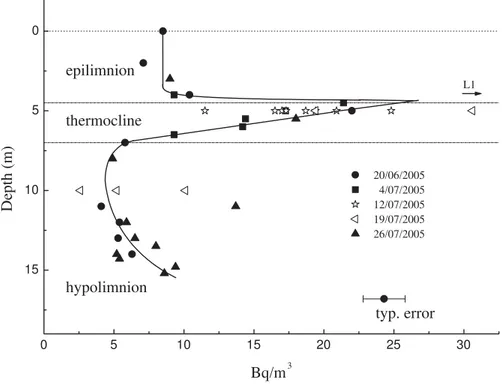
Samples for the radon analysis of lake water were taken with a submersed pump at different locations and from different depths. Vertical profiles at the central station L2 in the main lake basin (Fig. 4) were sampled at three days (20 June, 4 July, and 26 July 2005). Horizontal sections along and perpendicular to the lake axis were taken at two
15
other days (12 July and 19 July 2005). The samplings took place during a period of stable summer stratification. The results of all samples are listed in Tables 2 (vertical profiles) and 3 (horizontal sections).
The results of the vertical profiles from site L2 (Fig. 5) do not show strong temporal changes within the sampling period and are therefore interpreted together. The vertical
20
resolution of the combined profile is about 0.5 m in the thermocline and towards the lake bottom and between 1 and 3 m in the rest of the water column. The profiles show activity concentrations ranging from 5 to 30 Bq m−3. In the epilimnion, including samples from the water surface, concentrations are constant within the uncertainty, at a mean value of 8.9±1.2 Bq m−3. In the thermocline the activity is increasing to a
25
maximum of≈30 Bq m−3. In the hypolimnion, the radon concentration is rather low with
a mean of 6.1±1.9 Bq m−3.
HESSD
4, 1519–1548, 2007Radon in lakes
T. Kluge et al.
Title Page
Abstract Introduction
Conclusions References
Tables Figures
◭ ◮
◭ ◮
Back Close
Full Screen / Esc
Printer-friendly Version
Interactive Discussion
EGU
from 5 m depth with a horizontal spacing of the sampling sites of about 20 to 30 m (H1 to H7, see Fig. 4). The second horizontal transect was performed from southwest to northeast along the main axis with samples from 5 and 10 m depth with a horizontal spacing of the sites of about 200 m (L1 to L5). Both sections also include samples from the central station L2, where they intersect.
5
Results from the sites of the horizontal transects located in the main part of the lake are shown in Fig. 5 along with the profiles from site L2. Sites L4 and L5 in the small northeastern basin are excluded in Fig. 5 because this part of the lake is separated by a sill at about 8 m depth. The radon activities in the small basin are comparatively high, probably due to the proximity of the sampling points to the sediment as well as
10
to possible groundwater inflow along the southern shore of this basin. In the main basin, the results from most of the stations are comparable to those from the central profiles at station L2, although the variability especially at a depth of 5 m is high. The large variation at this depth is probably due to the strong vertical gradients near the thermocline peak of the radon activity. Nevertheless, the highest activity of more than
15
50 Bq m−3was found at station L1 towards the southwestern end of the lake, indicating that the main groundwater inflow area is located there. The overall groundwater flow direction deduced from a numerical model (Wollschl ¨ager, 2003) is in agreement with this result.
The radon activities in Lake Willersinnweiher displayed in Tables 2 and 3 and Fig. 5
20
are uncorrected total measured activities including the contribution from dissolved ra-dium and excess radon. We refer to total radon activities and take the production from radium explicitly into account in the budget calculations (see below). The activity of dissolved radium was determined by additional measurements on two lake samples stored for several weeks. The radon activity concentration in these samples was in
25
equilibrium with that of the dissolved radium, and yielded values for the radium activity of about 4 Bq m−3in the epilimnion and 2.6 Bq m−3in the hypolimnion.
HESSD
4, 1519–1548, 2007Radon in lakes
T. Kluge et al.
Title Page
Abstract Introduction
Conclusions References
Tables Figures
◭ ◮
◭ ◮
Back Close
Full Screen / Esc
Printer-friendly Version
Interactive Discussion
EGU
charcoal trap. By heating the charcoal in the laboratory, the radon was purged into a closed loop with the RAD7, where the activity was measured to be 7.4±0.8 Bq m−3,
which is in the range of typical air activities in the Rhine Valley (Levin et al., 2002).
4 Discussion
The basic idea for the calculation of the groundwater inflow is to use the mass balance
5
for the radon isotope (see Fig. 6). If the entire lake is homogeneously mixed and radon activity is at steady state, only the following quantities have to be determined: The mean radon activity concentration (Bq m−3) of the lake waterC
l a, a representative
ac-tivity concentration of the inflowing groundwaterCgw, the radium activity concentration
(Bq m−3) of the lake waterCRa(CRa=λRa·cRa,wherecRa is the radium concentration), 10
a representative value for the sediment fluxFsed, and the gas exchange flux of radon
from the lake to the atmosphereFsurf.
The variation in the lake level during the sampling campaign was in the cm range, so the lake volume as well as the exchange with the groundwater can be taken as constant and the groundwater inflow equals the outflow. As the Rn activity concentrations in
15
distinct water depths do not change in time (see Fig. 5) it seems reasonable to assume steady state (i.e.dCl a/dt=0). Then the radon balance can be written (compare Corbett
et al., 1997):
Qgw(Cgw−Cl a)+FsedAsed−FsurfAsurf−λRnV(Cl a−CRa)=0 (3)
Qgw is the groundwater in- and outflow in m3d−1,Asurfthe lake surface,Ased the
sedi-20
ment surface area andV the total volume of the lake. In case of lake Willersinnweiher, groundwater in- and outflow is assumed to be the same, because there is no surface in- and outflow and furthermore precipitation and evaporation are comparable.
HESSD
4, 1519–1548, 2007Radon in lakes
T. Kluge et al.
Title Page
Abstract Introduction
Conclusions References
Tables Figures
◭ ◮
◭ ◮
Back Close
Full Screen / Esc
Printer-friendly Version
Interactive Discussion
EGU
are negligible compared to the groundwater inflow. Outgassing of radon to the atmo-sphere (FsurfAsurf) and decay of excess radon (λRn(Cl a−CRa)) are the major sinks. In
the latter term, the correction for the decay of the dissolved radium is important in the hypolimnion.
Lake Willersinnweiher is stratified during the summer period. Therefore we can
di-5
vide the lake into different parts (see Fig. 6). The well mixed upper layer (epilimnion), which extends to a depth of 4.5 m, the region of the strong temperature change (ther-mocline) between 4.5 m and 7 m below the surface and the deepest layer (hypolimnion), which reaches from a depth of 7 m to the bottom. In these cases, Eq. (3) can be simpli-fied. As the radon transport through the thermocline is strongly reduced, (von Rohden
10
et al., 2007) we neglect the radon fluxes from the epilimnion through the thermocline to the hypolimnion and vice versa. Therefore each layer can be regarded as a box, which does not exchange radon with the other parts. Furthermore, in the hypolimnion the gas exchange with the atmosphere has not to be taken into account. Thus the radon balance for the hypolimnion can be written in the following form:
15
Qgw(Cgw−Cl a)+FsedAsed−λRnV(Cl a−CRa)=0 (4)
In case of Cl a, Ased and V the corresponding values for the hypolimnion have to be
chosen (see Table 4). Regarding the thermocline the same assumptions are made. The gas exchange has to be included only in the epilimnion. Calculating the mass balance for the hypolimnion and the epilimnion separately, vertical differences in the
20
groundwater inflow can be detected.
In the hypolimnion below 7 m depth no major groundwater inflow appears to be present, as the radon concentration is rather low. The increase of activity towards the lake bottom could be due to a small, localized groundwater inflow, but more likely it is produced by the sediment flux which is most important in the bottom layer with
25
a large ratio of sediment area to water volume. In general, radium decay, ground-water inflow and sediment flux are the sources for the hypolimnic radon. Neglecting the flux through the thermocline and assumingFsed=0, the maximum groundwater
HESSD
4, 1519–1548, 2007Radon in lakes
T. Kluge et al.
Title Page
Abstract Introduction
Conclusions References
Tables Figures
◭ ◮
◭ ◮
Back Close
Full Screen / Esc
Printer-friendly Version
Interactive Discussion
EGU
groundwater inflow Qgw and the decay terms. The result of Qgw=(52±30) m 3
d−1 is small compared to the total volume of the hypolimnion (470 000 m3), leading to a re-placement time for the hypolimnion of error 25±14 a. This indicates that without the
winterly overturn, the hypolimnion content would be renewed only once in about 25 a by groundwater inflow.
5
The constant radon concentrations in the epilimnion show that the upper 4.5 m of the lake’s water column are well mixed. In contrast, vertical mixing is strongly suppressed in the thermocline between about 4.5 and 7 m depth (von Rohden et al., 2007). A strong radon peak, representing a clear groundwater signal, is present in the upper thermocline (Fig. 5). As there is a minimum of the sediment surface to water volume
10
ratio at this depth, we do not ascribe this to the morphology of the lake in conjunction with the sediment flux.
For a first estimation, we interpret the peak as a result of a uniform radon input due to groundwater inflow into the upper part of the lake. This signal is preserved in the thermocline but strongly reduced in the epilimnion due to gas exchange. In
15
other words, we assume that if there was no gas exchange, the radon concentration would be 22 Bq m−3(mean value at L2 in 5 m depth) throughout the epilimnion and the thermocline. Using this value and neglecting the sediment flux, the balance calculation leads to a maximum value for the groundwater inflow of (475±140) m3d−1for the upper
part of the lake (<7 m depth, volume 830 000 m3).
20
Combining the above first estimates for the hypolimnion and the epilimnion, the total groundwater inflow to the lake is estimated to (530±140) m3d−1, which corresponds to
(1350±350) mm a−1 and a replacement time between 5.2 and 9.1 a. This estimate is
close to the lower end of the results of former studies: A calculation of the inflow with a groundwater flow model based on piezometer data and stable isotopes (Wollschl ¨ager
25
et al., 2007) yielded a range of 446 to 1726 m3d−1(replacement time: 2 to 8 a).
Bal-ancing of the calcite sedimentation (Schmid, 2002) resulted in 630 to 1060 m3d−1(3 to 5 a).
HESSD
4, 1519–1548, 2007Radon in lakes
T. Kluge et al.
Title Page
Abstract Introduction
Conclusions References
Tables Figures
◭ ◮
◭ ◮
Back Close
Full Screen / Esc
Printer-friendly Version
Interactive Discussion
EGU
maximum in the thermocline. Assuming that the difference is entirely due to outgassing to the atmosphere, the gas exchange flux can be calculated, and using the difference between the radon activity at the surface (8.9±1.2 Bq m−3) and the equilibrium
con-centration with the air (≈1.8 Bq m−3), the gas transfer velocity can be computed. This
calculation performed for the water body above 4.5 m depth (volume 580 000 m3)
re-5
sults in a transfer velocitykfor Rn of 1.3 m d−1, which is a rather high value compared to a value ofk=0.6 m d−1calculated from wind data (mean wind speed is around 2 m s−1) using a relationship given by Upstill-Goddard et al. (1990) ork=0.3 m d−1according to
a relationship of Wanninkhof (1992).
This result indicates that the actual radon input into the epilimnion is likely smaller
10
than estimated above, probably because the assumption of a uniform inflow into epil-imnion and thermocline is oversimplified. A reason for a comparatively high apparent input into the thermocline could be that groundwater entering the lake above or below the thermocline could sink or rise to the layer where the probability of achieving neutral buoyancy is largest. Turning the above arguments around and assuming a gas transfer
15
coefficient of k=0.6 m d−1, the groundwater input to the epilimnion can again be cal-culated. This yields an inflow of (200±40) m3d−1 for the volume above 4.5 m depth,
about 130 m3d−1less than expected if the above estimated inflow of 475 m3d−1would be distributed between epilimnion and the thermocline according to their volumes. The first estimate for the total groundwater inflow of 530 m3d−1may therefore be interpreted 20
as an upper boundary of the true value.
The above calculations rely on several assumptions. An essential requirement is a complete horizontal mixing of the lake on a time scale smaller than the half-life of222Rn, admitting the assumption of horizontal homogeneity so that the central profile can be taken as representative for the entire lake. Peeters et al. (1996) reported horizontal
25
eddy diffusivities in lakes in the range of 0.02 to 0.3 m2s−1. Using these values and a
HESSD
4, 1519–1548, 2007Radon in lakes
T. Kluge et al.
Title Page
Abstract Introduction
Conclusions References
Tables Figures
◭ ◮
◭ ◮
Back Close
Full Screen / Esc
Printer-friendly Version
Interactive Discussion
EGU
fact, the horizontal sections revealed inhomogeneity especially in the epilimnion (see Fig. 5 and Table 3). The activity is decreasing from the suspected groundwater entry zone (south-west) to the north-eastern end of the main basin of the lake.
The requirement of a good horizontal mixing will limit the application of the simple box model concept based on only one central radon profile to rather small lakes. In case of
5
larger lakes, the horizontal mixing time will be in the range of days or weeks, which in view of the short half-life of radon must lead to horizontal concentration gradients. In this case it is not possible to calculate the groundwater inflow from one vertical profile, but a three dimensional mapping of the radon distribution would be required. This has, on the other hand, the advantage that the groundwater entry areas can be located.
10
A large uncertainty originates from the scatter of the activity concentration in the ther-mocline. The values measured at 5 m depth at station L2 vary from 19 to 30 Bq m−3, possibly due to horizontal inhomogeneity and a variable degree of advection of ground-water influenced ground-water. Further uncertainties arise from the assumptions about the distribution of the groundwater inflow in the upper part of the lake and the effect of gas
15
exchange. The sharp peak in the thermocline is possibly not only the result of the gas exchange at the surface, but also due to the buoyancy driven interstratification of the inflowing groundwater in the thermocline, were the density is varying strongly.
A way to reduce the uncertainty of the effect of gas exchange would be to monitor the temporal evolution of the radon concentration in the epilimnion and the radon inventory
20
in the entire lake over an extended period of time, as demonstrated by Corbett et al. (1997). Seasonal changes in the vertical stratification of the lake should lead to a dynamic evolution of the radon concentrations that can be interpreted in terms of gas exchange, vertical mixing, and groundwater input. The analytical method presented here is suitable to conduct such an extended study, which we plan to realize in the
25
HESSD
4, 1519–1548, 2007Radon in lakes
T. Kluge et al.
Title Page
Abstract Introduction
Conclusions References
Tables Figures
◭ ◮
◭ ◮
Back Close
Full Screen / Esc
Printer-friendly Version
Interactive Discussion
EGU 5 Conclusions
The method using large buckets for sampling, radon transfer by equilibration between water- and gas cycles, and the measurement with an energy sensitive alpha spectro-meter is well suited for the detection of the radon activities in lakes which are influenced by groundwater. The method involves rapid sampling, followed by precise radon
mea-5
surements in the laboratory. The presented field example from Lake Willersinnweiher shows that the approach allows the detection and quantitative estimation of groundwa-ter inflow to lakes.
The groundwater inflow estimated by a simple radon balance is comparable to the results of former studies. A significant advantage of the radon method is that it allows to
10
distinguish groundwater inflow to the hypolimnion and the epilimnion during stratifica-tion, and to locate groundwater entry areas in the horizontal dimension. However, more data over a longer time period with changing vertical stratification and better horizontal resolution would be needed to reduce the uncertainties of the inflow estimation and to obtain a more detailed picture of the spatial distribution of the groundwater inflow.
15
References
Burnett, W. C., Kim, G., and Lane-Smith, D.: A continuous monitor for assessment of222Rn in the coastal ocean, J. Radioanal. Nucl. Chem., 249, 167–172, 2001.
Cable, J. E., Bugna, G. C., Burnett, W. C., and Chanton, J. P.: Application of222Rn and CH4for assessment of groundwater discharge to the coastal ocean, Limnol. Oceanogr., 41, 1347– 20
1353, 1996.
Corbett, R., Burnett, W. C., Cable, P. H., and Clark, S. B.: Radon tracing of groundwater input into Par Pond, Savannah River Site, J. Hydrol., 203, 209–227, 1997.
Corbett, R., Dillon, K., Burnett, W. C., Chanton, J., and Rutkowki, C.: Patterns of groundwater discharge into Florida Bay, Limnol. Oceanogr., 44, 1045–1055, 1999.
25
HESSD
4, 1519–1548, 2007Radon in lakes
T. Kluge et al.
Title Page
Abstract Introduction
Conclusions References
Tables Figures
◭ ◮
◭ ◮
Back Close
Full Screen / Esc
Printer-friendly Version
Interactive Discussion
EGU into Florida Bay via natural tracers, Rn-222 and CH-4, Limnol. Oceanogr., 45, 1546–1557,
2000.
Crusius, J., Koopmans, D., Bratton, J. F., Charette, M. A., Kroeger, K. D., Henderson, P., Ryck-man, L., Halloran, K., and ColRyck-man, J. A.: Submarine groundwater discharge to a small estuary estimated from radon and salinity measurements and a box model, Biogeosciences, 5
2, 141–157, 2005,
http://www.biogeosciences.net/2/141/2005/.
Dulaiova, H., Peterson, R., Burnett, W. C., and Lane-Smith, D.: A multi-detector continuous monitor for assessment of222Rn in the coastal ocean, J. Radioanal. Nucl. Chem., 263, 361– 365, 2005.
10
Durridge Co.: RAD7 radon detector – Owner’s manual, available at:http://www.durridge.com/ Manuals.htm, 2000.
Durridge Co.: RAD7 RAD-H20 – Radon in water accessory – Owner’s manual, available at: http://www.durridge.com/Manuals.htm, 2001a.
Durridge Co.: RAD AQUA – Continuous radon-in-water monitoring system, available at: http: 15
//www.durridge.com/Manuals.htm, 2001b.
Hoehn, E. and von Gunten, H.: Radon in groundwater: a tool to assess infiltration from surface waters to aquifers, Water Resour. Res., 25, 1795–1803, 1989.
HGK, Arbeitsgruppe Hydrogeologische Kartierung und Grundwasserbewirtschaftung Rhein-Neckar-Raum: Hydrogeologische Kartierung und Grundwasserbewirtschaftung Rhein-20
Neckar-Raum. Analyse des Ist-Zustandes. Technical report. Ministerium f ¨ur Ern ¨ahrung, Landwirtschaft, Umwelt und Forsten Baden-W ¨urttemberg, Hessischer Minister f ¨ur Lan-desentwicklung, Umwelt, Landwirtschaft und Forsten, Ministerium f ¨ur Landwirtschaft, Wein-bau und Forsten Rheinland-Pfalz, 1999.
Imboden, D. and Emerson, S.: Natural radon and phosphorus as limnologic tracers: Horizontal 25
and vertical eddy diffusion in Greifensee, Limnol. Oceanogr., 29, 831–844, 1984.
Kluge, T. : Radon als Tracer in aquatischen Systemen, Diploma thesis, Univ. Heidelberg, 2005. Krabbenhoft, D. P., Bowser, C. J., Anderson, M. P., and Valley, J. W.: Estimating groundwater
exchange with lakes 1. The stable isotope mass balance method, Water Resour. Res., 26, 2445–2453, 1990.
30
Ver-HESSD
4, 1519–1548, 2007Radon in lakes
T. Kluge et al.
Title Page
Abstract Introduction
Conclusions References
Tables Figures
◭ ◮
◭ ◮
Back Close
Full Screen / Esc
Printer-friendly Version
Interactive Discussion
EGU lagin, A., Verclas S., and Wagenbach, D.: Observations of atmospheric variability and soil
exhalation rate of radon-222 at a Russian forest site, Tellus, 54B, 462–475, 2002.
Mathieu, G. G., Biscaye, P. E., and Lupton, R. A.: System for measurement of Rn-222 at low levels in natural waters, Health Phys., 55, 982–992, 1988.
Peeters, F., W ¨uest, A., Piepke, G., and Imboden, D.: Horizontal mixing in lakes, J. Geophys. 5
Res., 101, 18 361–18 375, 1996.
Roether, W. and Kromer, B.: Field determination of air-sea gas exchange by continuous mea-surement of radon-222, Pure Appl. Geophys., 116, 476–485, 1978.
Schmid, J.: Calcitf ¨allung und Phosphor-Kopr ¨azipitation im Phosphorhaushalt eines eutrophen Hartwassersees mit anoxischem Hypolimnion (Willersinnweiher, Ludwigshafen am Rhein), 10
Ph.D. thesis, Univ. Heidelberg, 2002.
Upstill-Goddard, R. C., Watson, A. J., Liss, P. S., and Liddicoat, M.: Gas transfer velocities in lakes measured with SF6, Tellus, 42B, 364–377, 1990.
von Rohden, C., Wunderle, K., and Ilmberger, J.: Parameterisation of the vertical transport in a small thermally stratified lake, Aquatic. Sci., 69, 129–137, doi:10.1007/s00027-006-0827-4, 15
2007.
Wanninkhof, R.: Relationship Between Wind Speed and Gas Exchange Over the Ocean, J. Geophys. Res., 97, 7373–7382, 1992.
Weigel, F.: Radon, Chemiker-Zeitung, 102, 287, 1978.
Wollschl ¨ager, U.: Kopplung zwischen Oberfl ¨achenwasser und Grundwasser: Modellierung und 20
Analyse von Umwelttracern, Ph.D. thesis, Univ. Heidelberg, 2003.
Wollschl ¨ager, U., Ilmberger, J., Isenbeck-Schr ¨oter, M., Kreuzer, A., von Rhoden, C., Roth, K. and Sch ¨afer, W. et al.: Coupling of groundwater and surface water at Lake Willersinnweiher: Groundwater modeling and tracer studies, Aquatic. Sci., 69, 138–152, doi:10.1007/s00027-006-0825-6, 2007.
25
Yehdegho, B., Rozanski, K., Zojer, H., and Stichler, W.: Interaction of dredging lakes with the adjacent groundwater field: an isotope study, J. Hydrol., 192, 247–270, 1997.
Weiss, W., Zapf, T., Baitter, M., Kromer, B., Fischer, K. H., Schlosser, P., Roether, W., and M ¨unnich, K. O.: Subsurface horizontal water transport and vertical mixing in Lake Constance traced by radon-222, tritium, and other physical and chemical tracers, p.43–54, in: Isotope 30
HESSD
4, 1519–1548, 2007Radon in lakes
T. Kluge et al.
Title Page
Abstract Introduction
Conclusions References
Tables Figures
◭ ◮
◭ ◮
Back Close
Full Screen / Esc
Printer-friendly Version
Interactive Discussion
EGU
Table 1. Different analytical methods and their detection limit. Counting times are typical values for the respective methods and are in part limited by the increasing background from the drying medium, except if a water trap is used. The detection limit is defined as the activity concentration that – using the stated sample size and during the given counting time – produces a background-corrected signal which deviates two standard deviations from zero (i.e. the 1σ
uncertainties of the listed values are 50%).
Method Sample volume (L) Counting time (min) Detection limit (Bq m−3)
Rad H2O 0.25 20 400
Rad H2O with N2-purging 0.25 60 160
Rad Aqua continuous 30 10
Rad Aqua Plus with N2-purging 12 60 8
HESSD
4, 1519–1548, 2007Radon in lakes
T. Kluge et al.
Title Page
Abstract Introduction
Conclusions References
Tables Figures
◭ ◮
◭ ◮
Back Close
Full Screen / Esc
Printer-friendly Version
Interactive Discussion
EGU
Table 2. Results of vertical profile measurements in Lake Willersinnweiher using the equili-bration method Rad Aqua Plus. The samples were taken at the indicated dates and depths at station L2 (middle of the main basin, see Fig. 4). Typical uncertainties are 10 to 15% of the value.
20 June 2005 4 July 2005 26 July 2005 depth
(m)
CRn (Bq m−3
)
depth (m)
CRn (Bq m−3
)
depth (m)
CRn (Bq m−3
)
0 8.5 4 9.3 3 9.0
2 7.1 4.5 21.4 5.5 18.0
4 10.4 5 17.3 8 4.9
5 22.0 5.5 14.4 11 13.7
7 5.8 6 14.2 12 5.9
11 4.1 6.5 9.3 13 6.5
12 5.4 13.5 8.0
13 5.3 14 6.2
14 6.5 14.3 5.4
16.8 24.3 14.8 9.4
HESSD
4, 1519–1548, 2007Radon in lakes
T. Kluge et al.
Title Page
Abstract Introduction
Conclusions References
Tables Figures
◭ ◮
◭ ◮
Back Close
Full Screen / Esc
Printer-friendly Version
Interactive Discussion
EGU
Table 3.Results of horizontal sections of radon measurements through Lake Willersinnweiher using the equilibration method Rad Aqua Plus. The samples were taken on 12 July 2005 in a transversal section (stations H1 to H7, see Fig. 4) at a depth of 5 m (4.6 m for H1) and on 19 July 2005 in a longitudinal section (stations L1 to L5) at depths of 5 and 10 m. Typical uncertainties are 10 to 15% of the value.
12 July 2005 19 July 2005
5 m depth 5 m depth 10 m depth station CRn
(Bq m−3)
station CRn (Bq m−3)
CRn (Bq m−3)
H1a 24.0 L1 52.4 2.6
H2 14.7 L2 30.6 10.1
H3 16.2 L3 19.4 5.2
H4 10.4 L4 13.8 24.8
H5 14.4 L5 48.0 21.0
L2 19.4 H7 16.9
a
HESSD
4, 1519–1548, 2007Radon in lakes
T. Kluge et al.
Title Page
Abstract Introduction
Conclusions References
Tables Figures
◭ ◮
◭ ◮
Back Close
Full Screen / Esc
Printer-friendly Version
Interactive Discussion
EGU
Table 4. Values used for the balance calculations. Asedis the sediment surface in each box. The according mean radon activity isCl a. Throughout the thermocline a mean radon activity concentration of 22 (Bq m−3
) was assumed. The groundwater inflow rate is calculated neglect-ing the sediment flux. Therefore the results represent an upper limit for the estimated inflow rate.
Box Volume (m3) Ased(m2) Cl a(Bq m−3) Qgw (m3/d)
HESSD
4, 1519–1548, 2007Radon in lakes
T. Kluge et al.
Title Page
Abstract Introduction
Conclusions References
Tables Figures
◭ ◮
◭ ◮
Back Close
Full Screen / Esc
Printer-friendly Version
Interactive Discussion
EGU Rad7
Sample bucket Drystick
Drying unit
Water loop
Gas loop Exchanger
Temperature-sensor
Pump
HESSD
4, 1519–1548, 2007Radon in lakes
T. Kluge et al.
Title Page
Abstract Introduction
Conclusions References
Tables Figures
◭ ◮
◭ ◮
Back Close
Full Screen / Esc
Printer-friendly Version
Interactive Discussion
EGU
1 2 3 4 5
0 2 4 6 8
Comparison Nr.
Bq/l
RadAquaPlus Rad H2O
HESSD
4, 1519–1548, 2007Radon in lakes
T. Kluge et al.
Title Page
Abstract Introduction
Conclusions References
Tables Figures
◭ ◮
◭ ◮
Back Close
Full Screen / Esc
Printer-friendly Version
Interactive Discussion
EGU
0 50 100 150 200
1 10
Radon Activity Concentration (Bq/l)
Storage Time (h)
HESSD
4, 1519–1548, 2007Radon in lakes
T. Kluge et al.
Title Page
Abstract Introduction
Conclusions References
Tables Figures
◭ ◮
◭ ◮
Back Close
Full Screen / Esc
Printer-friendly Version
Interactive Discussion
EGU 8°23,47 N
49°30,00 E
GWM C GWM B
L1
L2
L3 L4
L5
H1 H7
H5 H4
H3 H2 N
HESSD
4, 1519–1548, 2007Radon in lakes
T. Kluge et al.
Title Page
Abstract Introduction
Conclusions References
Tables Figures
◭ ◮
◭ ◮
Back Close
Full Screen / Esc
Printer-friendly Version
Interactive Discussion
EGU
0 5 10 15 20 25 30
15 10 5 0
L1
typ. error epilimnion
hypolimnion thermocline
Depth (m)
Bq/m3
20/06/2005 4/07/2005 12/07/2005 19/07/2005 26/07/2005
HESSD
4, 1519–1548, 2007Radon in lakes
T. Kluge et al.
Title Page
Abstract Introduction
Conclusions References
Tables Figures
◭ ◮
◭ ◮
Back Close
Full Screen / Esc
Printer-friendly Version
Interactive Discussion
EGU
Epilimnion
Thermocline
Hypolimnion
F
surfQ
gwF
sedQ
gwQ
gwQ
gwF
sedF
seddecay
internal source
Rn
C
la-
+ RnC
RaRn