BGD
12, 4183–4211, 2015The3He flux gauge in
the Sargasso Sea
R. H. R. Stanley et al.
Title Page
Abstract Introduction
Conclusions References
Tables Figures
◭ ◮
◭ ◮
Back Close
Full Screen / Esc
Printer-friendly Version
Interactive Discussion
Discussion
P
a
per
|
Discussion
P
a
per
|
Discussion
P
a
per
|
Discussion
P
a
per
Biogeosciences Discuss., 12, 4183–4211, 2015 www.biogeosciences-discuss.net/12/4183/2015/ doi:10.5194/bgd-12-4183-2015
© Author(s) 2015. CC Attribution 3.0 License.
This discussion paper is/has been under review for the journal Biogeosciences (BG). Please refer to the corresponding final paper in BG if available.
The
3
He flux gauge in the Sargasso Sea:
a determination of physical nutrient fluxes
to the euphotic zone at the Bermuda
Atlantic time series site
R. H. R. Stanley, W. J. Jenkins, S. C. Doney, and D. E. Lott, III
Department of Marine Chemistry and Geochemistry, Woods Hole Oceanographic Institution, Woods Hole, MA 02543, USA
Received: 19 December 2014 – Accepted: 22 December 2014 – Published: 9 March 2015 Correspondence to: R. H. R. Stanley ([email protected])
BGD
12, 4183–4211, 2015The3He flux gauge in
the Sargasso Sea
R. H. R. Stanley et al.
Title Page
Abstract Introduction
Conclusions References
Tables Figures
◭ ◮
◭ ◮
Back Close
Full Screen / Esc
Printer-friendly Version
Interactive Discussion
Discussion
P
a
per
|
Discussion
P
a
per
|
Discussion
P
a
per
|
Discussion
P
a
per
|
Abstract
We provide a new determination of the annual mean physical supply of nitrate to the euphotic zone in the western subtropical North Atlantic based on a three year
time-series of measurements of tritiugenic3He from 2003 to 2006 in the surface ocean at
the Bermuda Atlantic Time-series Study (BATS) site. We combine the3He data with a
5
sophisticated noble gas calibrated air–sea gas exchange model to constrain the3He
flux across the sea–air interface, which must closely balance the upward3He flux into the euphotic zone. The product of the3He flux and the observed subsurface nitrate-3He relationship provides an estimate of the minimum rate of new production in the BATS
region. We also applied the gas model to an earlier time series of3He measurements
10
at BATS in order to recalculate new production fluxes for the 1985 to 1988 time period. The observations, despite an almost three-fold difference in the nitrate-3He relationship, yield a roughly consistent estimate of nitrate flux. In particular, the nitrate flux from 2003–2006 is estimated to be 0.65±0.3 mol m−2y−1, which is∼40 % smaller
than the calculated flux for the period from 1985 to 1988. The difference between
15
the time periods, which is barely significant, may be due to a real difference in new production resulting from changes in subtropical mode water formation. Overall, the nitrate flux is larger than most estimates of export fluxes or net community production fluxes made locally for BATS site, which is likely a reflection of the larger spatial scale
covered by the 3He technique and potentially also by decoupling of 3He and nitrate
20
during obduction of water masses from the main thermocline into the upper ocean.
1 Introduction
Primary production in the subtropical oligotrophic gyres has been an active area of study for decades. In particular, scientists have long puzzled over the seemingly paradoxical drawdown of summertime dissolved inorganic carbon despite no visible 25
BGD
12, 4183–4211, 2015The3He flux gauge in
the Sargasso Sea
R. H. R. Stanley et al.
Title Page
Abstract Introduction
Conclusions References
Tables Figures
◭ ◮
◭ ◮
Back Close
Full Screen / Esc
Printer-friendly Version
Interactive Discussion
Discussion
P
a
per
|
Discussion
P
a
per
|
Discussion
P
a
per
|
Discussion
P
a
per
tracers, sediment traps, and bottle incubations have been performed at the Bermuda Atlantic Time-Series Study (BATS) site over the past several decades (e.g. Brew et al., 2009; Jenkins and Doney, 2003; Jenkins and Goldman, 1985; Spitzer and Jenkins, 1989; Gruber et al., 1998; Stanley et al., 2012; Stewart et al., 2011; Buesseler et al., 2008; Maiti et al., 2009, 2012; Owens et al., 2013; Lomas et al., 2010), in order to 5
quantify various aspects of biological production and to shed light on this enigma. Floating sediment traps give a direct measure of export production but may be biased by collection efficiency due to hydrodynamic biases and swimmers (Buesseler, 1991), as well as by the limited amount of time they are in the water. Bottle incubations though primarily used to determine net primary production (Marra, 2002, 2009), can 10
also be conducted to give determinations of new production when conducted with15N
(Dugdale et al., 1992). Bottle incubations give useful information but may be limited by so-called bottle effects of constraining organisms to a bottle (Peterson, 1980; Harrison and Harris, 1986; Scarratt et al., 2006). Geochemical tracers give large scale averages of rates of new production, net community production, or export production. These 15
rates, however, can be difficult to interpret since quantitative interpretation of the tracer data often depends on estimates of physical transport. Thus it is useful to calculate rates of production using numerous approaches and to compare them.
One approach that has been used before in the Sargasso Sea is to estimate a lower bound of new production by calculating the upward physical nutrient flux (Jenkins and 20
Doney, 2003; Jenkins, 1988a). The global inventory of natural tritium has been dwarfed by the production of so-called “bomb tritium” that was created during the atmospheric nuclear weapons tests in the 1950s and 1960s (Weiss and Roether, 1980). This tritium was deposited in large part in the Northern Hemisphere (Doney et al., 1992; Stark et al., 2004) and has subsequently entered the oceanic thermocline and abyss by subduction, 25
BGD
12, 4183–4211, 2015The3He flux gauge in
the Sargasso Sea
R. H. R. Stanley et al.
Title Page
Abstract Introduction
Conclusions References
Tables Figures
◭ ◮
◭ ◮
Back Close
Full Screen / Esc
Printer-friendly Version
Interactive Discussion
Discussion
P
a
per
|
Discussion
P
a
per
|
Discussion
P
a
per
|
Discussion
P
a
per
|
within the main thermocline of the North Atlantic. There is evidence of an efflux of this isotope via gas exchange from the surface ocean (Jenkins, 1988b, c). Inasmuch as this tritiugenic excess3He has a nutrient-like distribution in the thermocline – it is small in the surface ocean due to gas exchange loss and reaches a maximum within the thermocline due to in situ tritium decay – it is tempting to argue that the physical 5
return of this isotope to the shallow ocean can be used as a “flux gauge” to determine the rate of physical nutrient supply to the euphotic zone (Jenkins, 1988c; Jenkins and Doney, 2003). Here we report the results of a three year time-series of helium isotope measurements taken approximately monthly between 2003 and 2006 in the surface ocean near Bermuda that allow yet another determination of this nutrient flux. We 10
compare the calculated nutrient flux to the nutrient flux determined at the same location using the same method for the period of 1985–1998, as well as to export production fluxes calculated in the Sargasso Sea for the time period of 2003–2006.
2 Methods
2.1 Data collection
15
Samples for 3He, a suite of noble gases, and tritium were collected at the BATS
site (31.7◦N, 64.2◦W) on core BATS cruises at approximately monthly resolution
between April 2003 and April 2006. The BATS site, located in the subtropical North Atlantic, is representative of a typical oligotrophic gyre. Much biogeochemical research has occurred at that site, because of the long-standing time-series located there 20
(Lomas et al., 2013). In particular, as part of the regular time-series, export fluxes are estimated monthly from surface-tethered floating, upper-ocean sediment traps (Lomas et al., 2010) and rates of net primary production are estimated monthly from radiocarbon bottle incubations (Steinberg et al., 2001). In addition, other researchers have measured export using234Th (Maiti et al., 2009), neutrally buoyant sediment traps 25
BGD
12, 4183–4211, 2015The3He flux gauge in
the Sargasso Sea
R. H. R. Stanley et al.
Title Page
Abstract Introduction
Conclusions References
Tables Figures
◭ ◮
◭ ◮
Back Close
Full Screen / Esc
Printer-friendly Version
Interactive Discussion
Discussion
P
a
per
|
Discussion
P
a
per
|
Discussion
P
a
per
|
Discussion
P
a
per
1980). Net community production has been estimated from the seasonal accumulation of O2/Ar (Spitzer and Jenkins, 1989) and the drawdown of dissolved inorganic carbon
(Gruber et al., 1998; Brix et al., 2006; Fernandez-Castro et al., 2012). New production has been estimated from bottle incubations (Lipschultz, 2001; Lipschultz et al., 2002) and has also been studied using nitrogen isotopes (Fawcett et al., 2014; Knapp et al., 5
2008).
The 3He and noble gas samples for this study were collected from Niskin bottles
by gravity feeding through tygon tubing into valved 90 mL stainless steel cylinders. Typically 22 samples were collected within the upper 400 m, and thus depending on mixed layer depth, there were usually several samples collected within the mixed layer. 10
Within 24 h of sampling, the gas was extracted from the water stored in the cylinders
into ∼30 mL aluminosilicate glass bulbs. The bulbs were then brought to the Isotope
Geochemistry Facility at WHOI where they were analyzed for3He,4He, Ne, Ar, Kr, and
Xe using a dual mass spectrometric system with the3He being analyzed by a magnetic
sector mass spectrometer and the other noble gases being analyzed by a quadrupole 15
mass spectrometer (Stanley et al., 2009a). In particular, the magnetic sector mass
spectrometer for 3He measurements was a purposefully constructed, branch tube,
statically operated, dual collector instrument equipped with a Faraday cup and a pulse
counting secondary electron multiplier. Precision of the3He measurements, based on
duplicates, was 0.15 %. The focus of this paper is on the3He measurements, but the
20
other noble gases were used to calculate gas exchange fluxes (Stanley et al., 2009b), which is an important term in the calculation of3He flux from the3He data.
Samples for tritium were collected from the same Niskins by gravity feeding through tygon tubing into 500 mL argon-filled flint glass bottles, as described in Stanley et al. (2012). The tritium samples were degassed at the Isotope Geochemistry Facility 25
at WHOI (Lott and Jenkins, 1998), and then the resulting3He ingrowth was measured
BGD
12, 4183–4211, 2015The3He flux gauge in
the Sargasso Sea
R. H. R. Stanley et al.
Title Page
Abstract Introduction
Conclusions References
Tables Figures
◭ ◮
◭ ◮
Back Close
Full Screen / Esc
Printer-friendly Version
Interactive Discussion
Discussion
P
a
per
|
Discussion
P
a
per
|
Discussion
P
a
per
|
Discussion
P
a
per
|
tritium concentrations were used to correct for tritium ingrowth in the 3He samples
between time of collection and time of measurement (see Sect. 3.3).
2.2 Calculation of fluxes
The nitrate flux was calculated in a similar way as is described in Jenkins and Doney
(2003). The most notable difference was that in this study the dynamic solubility
5
equilibrium value of3He was modeled taking both solubility and bubble injection into account, as described in more detail below. To calculate the nitrate flux, first a3He flux was calculated and then the slope of the nitrate :3He ratio was applied. The 3He flux was calculated from the gas exchange parameterization of Stanley et al. (2009b), which had been devised specifically from the noble gas samples collected at the same time 10
as the3He samples and thus is well suited to the study site and sampling conditions. In particular, the3He flux (FHe3) was calculated as the product of a gas transfer velocity
k, as determined in Stanley et al. (2009b), and the difference in concentration between the measured3He concentration (C) and the dynamic solubility equilibrium value (Ceq):
FHe3=k·(C−Ceq) (1)
15
Laboratory experiments have determined the isotope effect in solution for helium in water as a function of temperature (Benson and Krause, 1980). Given that the helium isotope ratio may be further affected by isotopic fractionation in molecular diffusion (Bourg and Sposito, 2008) associated with the balance between wave-induced bubble trapping and air–sea exchange (Fuchs et al., 1987; Jenkins, 1988a) we have used 20
our observations of the full suite of noble gases on these samples to develop a much more complete model of this equilibrium isotope effect. Thus the dynamic solubility
equilibrium value for 3He, Ceq, was determined by adding
3
He isotopes to a one dimensional Price–Weller–Pinkel (PWP) model (Price et al., 1986) forced by 6 hourly NCEP reanalysis forcing (Kalnay et al., 1996) and QuikSCAT winds from the BATS site 25
BGD
12, 4183–4211, 2015The3He flux gauge in
the Sargasso Sea
R. H. R. Stanley et al.
Title Page
Abstract Introduction
Conclusions References
Tables Figures
◭ ◮
◭ ◮
Back Close
Full Screen / Esc
Printer-friendly Version
Interactive Discussion
Discussion
P
a
per
|
Discussion
P
a
per
|
Discussion
P
a
per
|
Discussion
P
a
per
3
He from Benson and Krause (1980) and the molecular diffusivity value from Bourg and Sposito (2008). The calculated dynamic solubility equilibrium is sensitive to the amount of air injection, and thus the other noble gases were used to constrain the air injection (Stanley et al., 2009b). Calculations of the dynamic solubility equilibrium and the flux
of 3He were also made using NCEP reanalysis winds instead of QuikSCAT winds.
5
Note that when the NCEP reanalysis winds were used in the model, the gas exchange parameterization of Stanley et al. (2009b) was modified to a parameterization that was calculated using NCEP winds. For example, the gas exchange scaling factor is 0.97 when using QuikSCAT winds (as reported in Stanley et al., 2009b) but is only 0.7 using NCEP winds.
10
The3He flux is then corrected for the flux due to in situ tritium decay (FHeFromTrit)):
FHeCorr=FHe−FHeFromTrit (2)
The flux of helium from tritium decay is calculated by using the radioactive decay equation, the half-life of tritium (12.31 years), and the mixed layer tritium concentrations measured in this study.
15
The nitrate flux (FNO3) was then calculated as the product between the corrected 3
He flux and the nitrate :3He ratio (R):
FNO3=FHeCorr×R (3)
The ratioR was calculated by determining the slope of a type II regression of NO3
vs.3He for samples measured in the upper 400 m of water during the three year time
20
series (N=218). Only data with [NO3]>2 umol kg− 1
were used in the regression since
water with NO3 concentration below this threshold represents water in the euphotic
BGD
12, 4183–4211, 2015The3He flux gauge in
the Sargasso Sea
R. H. R. Stanley et al.
Title Page
Abstract Introduction
Conclusions References
Tables Figures
◭ ◮
◭ ◮
Back Close
Full Screen / Esc
Printer-friendly Version
Interactive Discussion
Discussion
P
a
per
|
Discussion
P
a
per
|
Discussion
P
a
per
|
Discussion
P
a
per
|
3 Results and discussion
3.1 The fluxes of helium-3 and nitrate
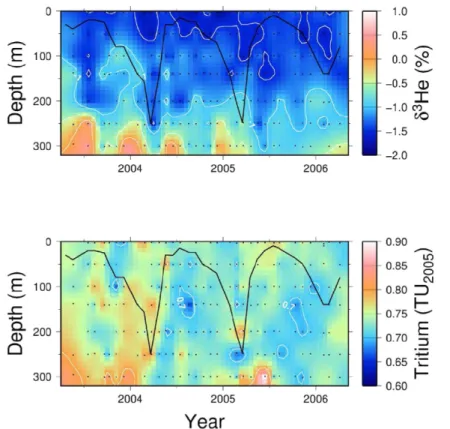
The3He and tritium data collected in this study between 2003 and 2006 are presented in Fig. 1. The gradient of 3He with depth is clearly visible. In contrast, tritium has a more uniform distribution with depth in the upper 300 m. The lack of excess3He in the 5
mixed layer (mixed layer is demarcated by thick black line) is because of air–sea gas exchange, which results in a flux of excess3He out of the ocean into the atmosphere. This sustained air–sea gas exchange results in a decreasing inventory of tritiugenic
3
He in the ocean through time. Multiple measurements within the mixed layer were
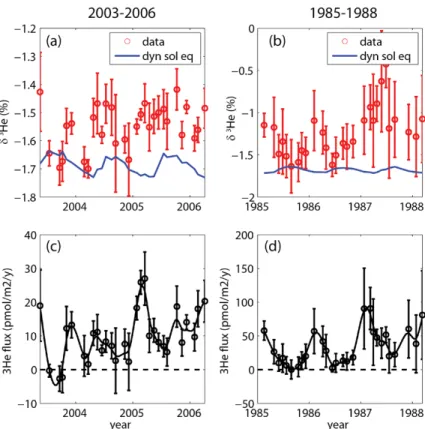
averaged in order to calculate the mixed layer concentrations of 3He (Fig. 2a). The
10
dynamic solubility equilibrium (blue curve on Fig. 2a) is significantly smaller than the
3
He concentrations, resulting in a sea to air flux of3He (Fig. 2c).
Additionally, since we now have a better understanding of the dynamic solubility equilibrium, both because of the extensive information on gas exchange garnered by
the noble gases and because of more accurate estimates of molecular diffusivity of
15
3
He, we also have recalculated the 3He and nitrate fluxes for the data from 1985–
1988 that was originally presented in Jenkins and Doney (2003). Thus the 3He
concentrations from 1985–1988 as well as the dynamic solubility equilibrium for that time-period are presented in Fig. 2b. Note the difference of scales in Fig. 2a and b.
There is much less3He in 2003–2006 than in the 1980s because of a decreased3He
20
source in the thermocline due to tritium decay over time and decades of outgassing of
3
He.
The average3He flux, corrected for tritium ingrowth, over the 2003–2006 time period is calculated to be 7.9±1 pmol m−2y−1 (Table 1). The flux due to tritium ingrowth in
the mixed layer during this period was 1.2±0.1 pmol m−2y−1. The integrated3He flux
25
is multiplied by a NO3: 3
He ratio of 82.9×10⁹±2×10⁹mol NO3mol− 1 3
BGD
12, 4183–4211, 2015The3He flux gauge in
the Sargasso Sea
R. H. R. Stanley et al.
Title Page
Abstract Introduction
Conclusions References
Tables Figures
◭ ◮
◭ ◮
Back Close
Full Screen / Esc
Printer-friendly Version
Interactive Discussion
Discussion
P
a
per
|
Discussion
P
a
per
|
Discussion
P
a
per
|
Discussion
P
a
per
the flux gauge method used here represents the lower bound of new production in the northern half of the subtropical gyre. It represents a lower bound estimate because it only includes the new production based on the upward physical transport of nutrients. It does not include any new production due to nitrogen fixation, zooplankton migration, or atmospheric deposition of nitrate. At BATS, nitrogen fixation has been estimated to be 5
0.03 to 0.08 mol N m−2y−1(Singh et al., 2013; Knapp et al., 2008), which is equivalent to 5 to 12 % of the new production we report from the flux gauge method. Zooplankton migration from 2003 to 2006 has been estimated to support a new production of 2 g C m−2y−1 (Steinberg et al., 2012), which is equivalent to 0.025 mol N m−2y−1using the revised Redfield ratios of Anderson and Sarmiento (1994), and thus is only 4 % of 10
the new production rate estimated by the flux gauge technique. Estimates of the nitrate supply due to atmospheric deposition range from 0.006 to 0.026 mol N m−2y−1(Singh et al., 2013; Knapp et al., 2010), thus being at most 4 % of the new production flux estimated here from the flux gauge method. Thus in total, the sources of new nitrate that are not accounted by the flux gauge method may mean that the new production 15
estimate given here is only about 80 to 85 % of the total new production rate. The flux estimate represents the northern half of the gyre – rather than just the BATS site – because the water in the thermocline that is vertically transported at the BATS site sources from the Northern half of the gyre (Talley, 2003).
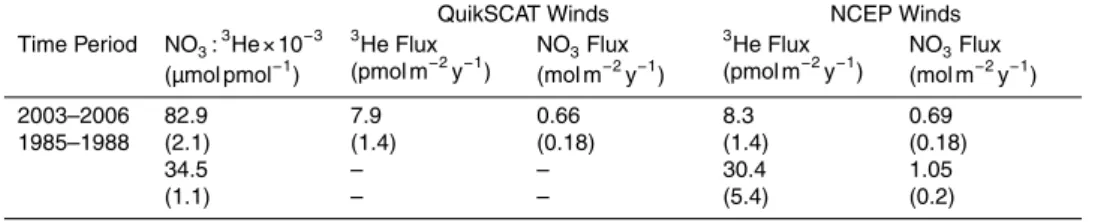
The nitrate fluxes calculated with the NCEP wind-derived3He fluxes are very similar 20
to those calculated by QuikSCAT winds (Table 1). This is because the gas exchange
parameterizations we used to calculate the flux from the3He concentration data and
to calculate the dynamic solubility equilibrium were separately tuned to observed noble gas data for QuikSCAT and NCEP. We were able do this since we had the wealth of noble gas data collected concurrently allowing for a good model of air–sea gas 25
BGD
12, 4183–4211, 2015The3He flux gauge in
the Sargasso Sea
R. H. R. Stanley et al.
Title Page
Abstract Introduction
Conclusions References
Tables Figures
◭ ◮
◭ ◮
Back Close
Full Screen / Esc
Printer-friendly Version
Interactive Discussion
Discussion
P
a
per
|
Discussion
P
a
per
|
Discussion
P
a
per
|
Discussion
P
a
per
|
3.2 Comparison to 1980s fluxes
The estimated nitrate flux for the period between 1985 to 1988 is 50 % larger than the nitrate flux for the 2003–2006 period, though over half of this difference can be accounted for by uncertainties in the flux estimates. For 1985–1988, our recomputed nitrate flux estimate is 1.05±0.2 mol N m−2y−1 (Table 1), which is 25 % larger than
5
the nitrate flux calculated for the same time period in Jenkins and Doney (2003). This difference between the1985–1988 fluxes calculated here vs. those calculated in Jenkins and Doney (2003) stems from this calculation using a well-modeled dynamic solubility equilibrium. In the earlier study, we did not have the other noble gas
data nor updated estimates of molecular diffusivity (Bourg and Sposito, 2008) and
10
thus employed a simpler and likely less accurate estimate of the dynamic solubility equilibrium.
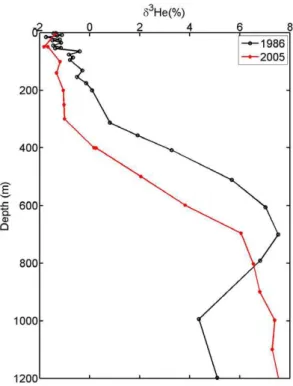
It is interesting to note that although the nitrate flux in 1985–1988 is only 50 % larger than the nitrate flux in 2003–2006, the3He flux in 1985–1988 is 300 % larger
than the 3He flux in 2003–2006. This is because in the 1980s, there was a much
15
larger tritium inventory and consequently larger concentrations of 3He in the main
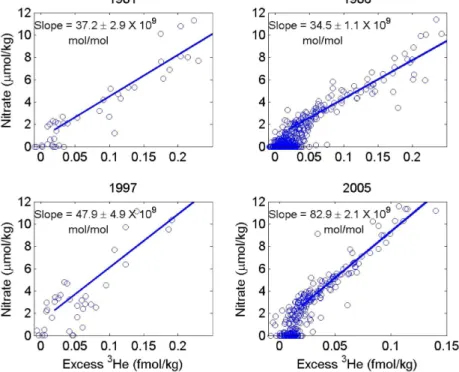
thermocline (Fig. 4). However, the slope of the NO3: 3
He relationship also changes with time. The distribution of nutrients in the main thermocline are in an approximate steady state established by a balance between nutrient release by in situ remineralization of organic material and removal by physical processes related to ventilation, advection, 20
and mixing. The corresponding thermocline distribution of tritiugenic 3He is evolving as a transient tracer. Over time, as the bomb-tritium pulse penetrates the thermocline,
the resultant3He maximum deepens and broadens (Jenkins, 1998). Consequently the
relationship between3He and nutrients is changing with time. Figure 3 is a plot of the NO3:3He relationship for the upper 500 m of the water column near Bermuda at four 25
points in time. Notably, the slope of the NO3: 3
BGD
12, 4183–4211, 2015The3He flux gauge in
the Sargasso Sea
R. H. R. Stanley et al.
Title Page
Abstract Introduction
Conclusions References
Tables Figures
◭ ◮
◭ ◮
Back Close
Full Screen / Esc
Printer-friendly Version
Interactive Discussion
Discussion
P
a
per
|
Discussion
P
a
per
|
Discussion
P
a
per
|
Discussion
P
a
per
flux from this method is almost the same in 2003–2006 as in 1985–1988 illustrates the robustness of this technique.
While the nitrate flux is broadly similar between the two time periods, there is still
a 50 % difference with the flux being larger in 1985–1988 than in 2003–2006. What
can account for this difference? It is not because of NCEP winds being used in the
5
1985–1988 calculation and QuikSCAT winds being used in the 2003–2006 calculation, because even if we do the 2003–2006 calculation with NCEP winds, we still get a 40 % difference between the flux in the two different decades (Table 1). It also is not likely due to the 1985–1988 data being from Hydrostation S whereas the 2003–2006 data is from
BATS. Those two sites are only 28 km apart and since the3He flux gauge estimate
10
is reflection of a much broader region, the relatively small difference in locations of samples likely does not play a role. It could be, in part, due to a time lag between the evolving subsurface NO3–
3
He ratio and surface fluxes. Most likely, however, it is due to a real elevation in new production in the late 1980s compared to the 2003–2006 period. Winter mixed layers in the two time periods are similar, with the exception of 15
a shallower than typical winter mixed layer depth in 1986, and thus are likely not an explanation for the difference in production between the periods.
Lomas et al. (2010) observed significant changes in export production at BATS over time, with the period between 1988 and 1995 having lower export fluxes than the period from 1995 to 2008. They attributed these changes to a shift in the North 20
Atlantic Oscillation (NAO) from positive in the 1988 to 1995 period to neutral in the 1996 to 2008 period. Our older data is from 1985 to 1988 and was not included in the Lomas et al. (2010) study. The winter NAO index (JFM) which has been shown to be most sensitive to changes in subtropical mode water formation (Billheimer and Talley, 2013) and primary production (Lomas et al., 2010) was−1.2, 0.2, and−1.1 for 1985,
25
1986 and 1987 respectively. It was −0.3, −0.5, and −0.6 for 2004, 2005, and 2006
BGD
12, 4183–4211, 2015The3He flux gauge in
the Sargasso Sea
R. H. R. Stanley et al.
Title Page
Abstract Introduction
Conclusions References
Tables Figures
◭ ◮
◭ ◮
Back Close
Full Screen / Esc
Printer-friendly Version
Interactive Discussion
Discussion
P
a
per
|
Discussion
P
a
per
|
Discussion
P
a
per
|
Discussion
P
a
per
|
A more negative NAO is usually correlated with a greater production of subtropical mode waters (STMW) via enhanced surface buoyancy loss and vertical convection (Billheimer and Talley, 2013). Indeed, estimates of Kelly and Dong (2013) suggest that there was increased formation of STMW in 1985–1988 compared to 2003–2006. We thus find higher rates of new production are associated with time periods of higher 5
generation of STMW. This is in contrast to the hypothesis of Palter et al. (2005) who suggested that increased STMW production would lead to a reduction in primary production due to decreased nutrients below the mixed layer in the vertically-homogenized mode water region since the decreased nutrients would lead to a smaller nutrient supply from the main thermocline below the mode water region and thus to 10
smaller rates of primary production.
The highest annual flux in the 1985–1988 period comes from 1987 (Fig. 2d). Interestingly, while the NAO index of 1987 was similar to that of 1985 and 2003–2006, the NAO index of 1986 was positive. It has been shown that chlorophyll correlates better with NAO index at BATS using a one year time lag (Cianca et al., 2012). Thus potentially 15
the higher fluxes we see in 1987 are a result of the higher NAO index in 1986. However, this would be counter to the general trend suggested by Lomas et al. (2010) and seen in the rest of our data of higher rates of production with more negative NAO indices.
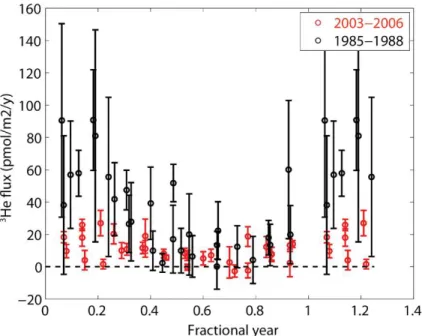
3.3 Seasonal cycle
A seasonal cycle in3He flux is observed in both the 1985–1988 time period and the
20
2003–2006 time period (Fig. 5). The3He fluxes are highest in winter-time when the
deep winter mixed layers at BATS mine water from the seasonal thermocline, bringing
up higher amounts of 3He and nitrate. But even in the summer, there is an upward
flux of 3He suggesting an upward flux of nitrate. There is no observable nitrate in
the summer mixed layer at BATS (Michaels et al., 1994; Steinberg et al., 2001) likely 25
BGD
12, 4183–4211, 2015The3He flux gauge in
the Sargasso Sea
R. H. R. Stanley et al.
Title Page
Abstract Introduction
Conclusions References
Tables Figures
◭ ◮
◭ ◮
Back Close
Full Screen / Esc
Printer-friendly Version
Interactive Discussion
Discussion
P
a
per
|
Discussion
P
a
per
|
Discussion
P
a
per
|
Discussion
P
a
per
at BATS without observable nutrients is in some sense answered by this clear sign that there is an upward nutrient flux, even in the summer. This supports the recent finding of Fawcett et al. (2014) showing evidence of nitrate supply to the mixed layer at BATS even in the summer.
3.4 Comparison to other rates of biological productivity at BATS
5
The rate of new production estimated by the helium flux gauge technique presented in this study is larger than most of the rates of new production, net community production or export production at BATS derived from other geochemical tracer approaches. Over long periods of time and long spatial scales, new production, net community production and export production should be equal (Dugdale and Goering, 1967). In carbon units, 10
using the revised Redfield ratio of Anderson and Sarmiento (1994) of 106 : 16, new production estimated in this study was 4.6±1.2 mol C m−2y−1in 2003–2006 and 6.96±
1.3 mol C m−2y−1in 1985–1988. As noted above, these rates represent new production over the Northern half of the subtropical gyre.
Export fluxes as estimated by apparent oxygen utilization rates (AOUR) also 15
represent fluxes over a similar northern region (Jenkins, 1980). Tritium samples were collected and used in conjunction with3He and O2data from the same cruises in 2003–
2006 that the3He data in this paper come from to estimate apparent oxygen utilization rates (Stanley et al., 2012). The AOUR values were integrated to 500 m to yield a lower bound on annual export from the remineralization and oxygen consumption between 20
200 and 500 m of 2.1±0.5 mol C m−2y−1. Thus the fluxes estimated by the helium flux
gauge technique are nearly a factor of two greater than the fluxes by AOUR, even though both represent a large geographical region.
A more local estimate of production comes from seasonal drawdown of DIC at BATS or by seasonal accumulation of O2with respect to Ar. Both techniques rely on the fact
25
that photosynthesis produces O2 and consumes CO2 whereas respiration produces
CO2 and consumes O2. Thus the seasonal changes in O2 or CO2 constrain the net
BGD
12, 4183–4211, 2015The3He flux gauge in
the Sargasso Sea
R. H. R. Stanley et al.
Title Page
Abstract Introduction
Conclusions References
Tables Figures
◭ ◮
◭ ◮
Back Close
Full Screen / Esc
Printer-friendly Version
Interactive Discussion
Discussion
P
a
per
|
Discussion
P
a
per
|
Discussion
P
a
per
|
Discussion
P
a
per
|
3
He flux gauge technique were collected, the seasonal accumulation of O2 and Ar
was measured and used to estimate rates of net community production of 1.2 to 2.4 mol C m−2
y−1
(Stanley, 2007). Notably, this rate is similar to that of the AOUR
estimate and a factor of 2 smaller than the 3He flux gauge estimate. The seasonal
accumulation of oxygen and argon has been used at other time periods to estimate 5
the rate of net community production at BATS to be 2.2 to 3 mol C m−2y−1(Spitzer and
Jenkins, 1989; Luz and Barkan, 2009). Seasonal drawdown of DIC directly as well as the change in isotopic composition of13C of DIC have been used to estimate annual net community production fluxes of 1.7 to 4.9 mol C m−2y−1(Gruber et al., 1998; Brix et al.,
2006; Fernandez-Castro et al., 2012). The upper end of this range approximates the 10
rate of new production we find here using the flux gauge technique. Interestingly, the
DIC drawdown and O2/Ar approaches reflect a smaller spatial scale than the AOUR
estimates, but at least in some cases agree better with the3He flux gauge approach.
On even smaller spatial and temporal scales, 234Th has been used to estimate
export fluxes at BATS, resulting in rates of export production calculated to be 0.3 to 15
0.8 mol C m−2y−1 (Maiti et al., 2009) These fluxes are much smaller than the fluxes estimated by other geochemical tracers, which may in part be due to the fact that
the234Th technique does not include the contribution of export due to DOC whereas
the other geochemical techniques do. DOC export in the Sargasso Sea has been estimated to be up to 1 mol C m−2y−1(Hansell et al., 2012).
20
Why is the helium flux gauge technique yielding rates of new production at the high end of the range of rates from other geochemical tracers? In part this may be due to the broader spatial coverage of the flux gauge technique, but that is not enough to explain fully the discrepancy since the AOUR technique has similar spatial area but smaller
fluxes. One reason may be that 3He and NO3 are decoupled during obduction in the
25
BGD
12, 4183–4211, 2015The3He flux gauge in
the Sargasso Sea
R. H. R. Stanley et al.
Title Page
Abstract Introduction
Conclusions References
Tables Figures
◭ ◮
◭ ◮
Back Close
Full Screen / Esc
Printer-friendly Version
Interactive Discussion
Discussion
P
a
per
|
Discussion
P
a
per
|
Discussion
P
a
per
|
Discussion
P
a
per
and Huang, 1995). This outcropping brings remineralized nutrients and tritiugenic3He back to the seasonal layer. Whereas the time constant associated with nutrient removal by biological processes is a matter of days, the exchange time-scale for tritiugenic3He loss to the atmosphere from a deep mixed layer may be several weeks. In this respect
the nutrients may have been removed while the3He “signal” may persist, so the 3He
5
flux gauge may measure not only local new production, but may also hold a more “regional” memory of the upstream, previous winter’s production.
3.5 Uncertainties and sensitivity studies
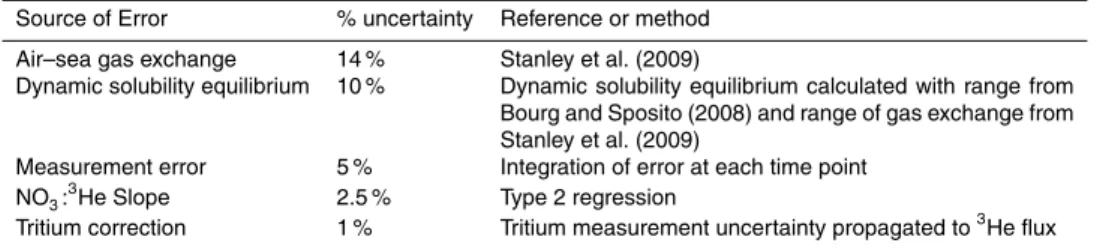
There are a number of sources of uncertainty in the estimate of nitrate fluxes from the helium flux gauge technique. Here we describe these uncertainties and the results of 10
sensitivity studies examining the effect of the sources of error. Table 2 lists the main sources of uncertainty in the calculations. One of the largest sources of uncertainty is uncertainty in the gas transfer velocity k (Eq. 1). Stanley et al. (2009b) illustrates how the time-series of noble gases collected concurrently with this data results in uncertainties of 14 % in the gas transfer velocityk. Sincek is directly used to calculate 15
the 3He air–sea flux from the difference between measured 3He concentration and
dynamic solubility equilibrium, this uncertainty directly translates to a 14 % uncertainty in3He flux and ultimately in nitrate flux.
The second largest source of uncertainty in the nitrate flux is the uncertainty in the determination of dynamic solubility equilibrium. The largest uncertainty in the dynamic 20
solubility equilibrium is caused by uncertainties in the molecular diffusivity of 3He with respect to 4He. The dynamic solubility equilibrium is sensitive to the molecular diffusivity due to the relative diffusive gas exchange of3He vs.4He (i.e. Schmidt number dependence) and due to the effect of air injection of partially trapped bubbles – during air injection,3He diffuses more quickly out of the bubbles than4He. We ran sensitivity 25
BGD
12, 4183–4211, 2015The3He flux gauge in
the Sargasso Sea
R. H. R. Stanley et al.
Title Page
Abstract Introduction
Conclusions References
Tables Figures
◭ ◮
◭ ◮
Back Close
Full Screen / Esc
Printer-friendly Version
Interactive Discussion
Discussion
P
a
per
|
Discussion
P
a
per
|
Discussion
P
a
per
|
Discussion
P
a
per
|
and found that the3He flux changed by±10 % depending on the molecular diffusivities
used.
We also ran sensitivity studies to calculate the dynamic solubility equilibrium and the resulting3He and nitrate fluxes using a range of gas exchange parameters. Specifically, we use many of the parameter sets determined in Table 1 of Stanley et al. (2009b) 5
including the sets of parameters determined for different physical parameters in the model and different weightings of the cost function. We found that the dynamic solubility equilibrium changed by only a small amount in these scenarios so that the overall SD of the 3He flux for all the different scenarios was only 2 %. We add 2 and 10 % in quadrature to find that the overall uncertainty in3He or nitrate flux associated with the 10
dynamic solubility equilibrium is 10.2 %.
The effect of measurement error of3He is a smaller uncertainty than the systematic uncertainties listed above but does lead to an error of 5 % when propagated through all the calculations. Interestingly, for the 1985–1988 period, the absolute3He concentrations were much higher but the measurement uncertainty at that time was 15
much worse, resulting in a similar 5 % contribution of measurement uncertainty during that period as well.
Uncertainties in the slope of NO3:3He feed directly into uncertainty in the nitrate flux, resulting in a 2.5 % uncertainty in the nitrate flux. The uncertainties were derived from the uncertainty associated with the calculation of slope using a type II regression and 20
appropriate measurement uncertainties for the individual data points. Additional error in the3He flux – and thus propagated to the nitrate flux – comes from the correction for tritium ingrowth in the water column. However, since the 3He flux due to in situ tritium production is relatively small (12 % of the total3He flux), the uncertainty on that number only contributes to a small fraction of the total uncertainty in the helium and 25
BGD
12, 4183–4211, 2015The3He flux gauge in
the Sargasso Sea
R. H. R. Stanley et al.
Title Page
Abstract Introduction
Conclusions References
Tables Figures
◭ ◮
◭ ◮
Back Close
Full Screen / Esc
Printer-friendly Version
Interactive Discussion
Discussion
P
a
per
|
Discussion
P
a
per
|
Discussion
P
a
per
|
Discussion
P
a
per
4 Conclusions
In summary, we have used the approach of Jenkins and Doney (Jenkins and Doney,
2003) to calculate the physical supply of subsurface nitrate to the euphotic zone
at BATS to be 0.65±0.3 mol m−2y−1. This flux may support the new production of
approximately 4.8±2 mol C m−2y−1 due to the upward flux of nutrients over a broad
5
region of the subtropical Northwestern Atlantic. We show that the rates are consistent with, but lower than, rates of new production recalculated from similar data from 1985– 1988 and that this difference may be related to subtropical mode water formation. We also show that the rates estimated by this technique are higher than most other rates of new production estimated at the BATS site. This work thus shows that upward flux 10
of nutrients – even if not directly observed at BATS by traditional techniques – is more than sufficient to support the observed rates of net community production and export production calculated at BATS.
Acknowledgements. We would like to thank Mike Lomas, Rod Johnson, and the BATS research
team for the opportunity to collect samples. We are grateful for the assistance of the captain
15
and crew of the R/VWeatherbird IIand the R/VAtlantic Explorer. This research was funded by the National Science Foundation (OCE-1434000 and OCE-221247).
References
Anderson, L. A. and Sarmiento, J. L.: Redfield ratios of remineralization determined by nutrient data-analysis, Global Biogeochem. Cy., 8, 65–80, 1994.
20
Benson, B. B. and Krause, D., Jr.: Isotopic fractionation of helium during solution: a probe for the liquid state, J. Solution Chem., 9, 895–909, 1980.
Billheimer, S. and Talley, L. D.: Near cessation of Eighteen Degree Water renewal in the western North Atlantic in the warm winter of 2011–2012, J. Geophys. Res.-Oceans, 118, 6838–6853, doi:10.1002/2013jc009024, 2013.
25
BGD
12, 4183–4211, 2015The3He flux gauge in
the Sargasso Sea
R. H. R. Stanley et al.
Title Page
Abstract Introduction
Conclusions References
Tables Figures
◭ ◮
◭ ◮
Back Close
Full Screen / Esc
Printer-friendly Version
Interactive Discussion
Discussion
P
a
per
|
Discussion
P
a
per
|
Discussion
P
a
per
|
Discussion
P
a
per
|
Brew, H. S., Moran, S. B., Lomas, M. W., and Burd, A. B.: Plankton community composition, organic carbon and thorium-234 particle size distributions, and particle export in the Sargasso Sea, J. Mar. Res., 67, 845–868, 2009.
Brix, H., Gruber, N., Karl, D. M., and Bates, N. R.: On the relationships between primary, net community, and export production in subtropical gyres, Deep-Sea Res. Pt. II, 53, 698–717,
5
2006.
Broecker, W. S. and Peng, T. H.: The distribution of bomb-produced tritium and radiocarbon at GEOSECS station 347 in the eastern North Pacific, Earth Planet. Sc. Lett., 49, 453–462, 1980.
Buesseler, K. O.: Do upper-ocean sediment traps provide an accurate record of particle flux?,
10
Nature, 353, 420–423, 1991.
Buesseler, K. O., Lamborg, C., Cai, P., Escoube, R., Johnson, R., Pike, S., Masque, P., McGillicuddy, D., and Verdeny, E.: Particle fluxes associated with mesoscale eddies in the Sargasso Sea, Deep-Sea Res. Pt. II, 55, 1426–1444, doi:10.1016/j.dsr2.2008.02.007, 2008. Cianca, A., Godoy, J. M., Martin, J. M., Perez-Marrero, J., Rueda, M. J., Llinas, O., and
15
Neuer, S.: Interannual variability of chlorophyll and the influence of low-frequency climate modes in the North Atlantic subtropical gyre, Global Biogeochem. Cy., 26, Gb2002, doi:10.1029/2010gb004022, 2012.
Doney, S. C., Glover, D. M., and Jenkins, W. J.: A model function of the global bomb-tritium distribution in precipitation, 1960–1986, J. Geophys. Res., 97, 5481–5492, 1992.
20
Dong, S. F. and Kelly, K. A.: How well do climate models reproduce North Atlantic subtropical mode water?, J. Phys. Oceanogr., 43, 2230–2244, doi:10.1175/jpo-d-12-0215.1, 2013. Dugdale, R. C. and Goering, J. J.: Uptake of new and regenerated forms of nitrogen in primary
productivity., Limnol. Oceanogr., 12, 196–206, 1967.
Dugdale, R. C., Wilkerson, F. P., Barber, R. T., and Chavez, F. P.: Estimating new production in
25
the equatorial Pacific Ocean at 150 W, J. Geophys. Res., 97, 681–686, 1992.
Fawcett, S. E., Lomas, M. W., Ward, B. B., and Sigman, D. M.: The counterintuitive effect of summer-to-fall mixed layer deepening on eukaryotic new production in the Sargasso Sea, Global Biogeochem. Cy., 28, 86–102, doi:10.1002/2013gb004579, 2014.
Fernández-Castro, B., Anderson, L., Marañón, E., Neuer, S., Ausín, B., González-Dávila, M.,
30
BGD
12, 4183–4211, 2015The3He flux gauge in
the Sargasso Sea
R. H. R. Stanley et al.
Title Page
Abstract Introduction
Conclusions References
Tables Figures
◭ ◮
◭ ◮
Back Close
Full Screen / Esc
Printer-friendly Version
Interactive Discussion
Discussion
P
a
per
|
Discussion
P
a
per
|
Discussion
P
a
per
|
Discussion
P
a
per
in the North Atlantic subtropical gyre, Biogeosciences, 9, 2831–2846, doi:10.5194/bg-9-2831-2012, 2012.
Fuchs, G., Roether, W., and Schlosser, P.: Excess3He in the ocean surface layer, J. Geophys. Res., 92, 6559–6568, 1987.
Gruber, N., Keeling, C. D., and Stocker, T. F.: Carbon-13 constraints on the seasonal inorganic
5
carbon budget at the BATS site in the northwestern Sargasso Sea, Deep-Sea Res. Pt. I, 45, 673–717, 1998.
Hansell, D. A., Carlson, C. A., and Schlitzer, R.: Net removal of major marine dissolved organic carbon fractions in the subsurface ocean, Global Biogeochem. Cy., 26, GB1016, doi:10.1029/2011GB004069 2012.
10
Harrison, W. G. and Harris, L. R.: Isotope-dilution and its effects on measurements of nitrogen and phosphorus uptake by oceanic microplankton, Mar. Ecol.-Prog. Ser., 27, 253–261, 1986. Jenkins, W. J.: Tritium and He-3 in the Sargasso Sea, J. Mar. Res., 38, 533–569, 1980. Jenkins, W. J.: Nitrate flux into the euphotic zone near Bermuda, Nature, 331, 521–523, 1988a. Jenkins, W. J.: The use of anthropogenic tritium and 3He to study subtropical gyre ventilation
15
and circulation, Philos. T. Roy. Soc. A, 325, 43–61, 1988b.
Jenkins, W. J.: Nitrate flux into the euphotic zone near Bermuda, Nature, 331, 521–523, 1988c. Jenkins, W. J. and Goldman, J. C.: Seasonal oxygen cycling and primary production in the
Sargasso Sea, J. Mar. Res., 43, 465–491, 1985.
Jenkins, W. J. and Doney, S. C.: The subtropical nutrient spiral, Global Biogeochem. Cy., 17,
20
1110.11, doi:10.1029/2003GB002085, 2003.
Kalnay, E., Kanamitsu, M., Kistler, R., Collins, W., Deaven, D., Gandin, L., Iredell, M., Saha, S., White, G., Woollen, J., Zhu, Y., Chelliah, M., Ebisuzaki, W., Higgins, W., Janowiak, J., Mo, K. C., Ropelewski, C., Wang, J., Leetmaa, A., Reynolds, R., Jenne, R., and Joseph, D.: The NCEP/NCAR 40 year reanalysis project, B. Am. Meteorol. Soc., 77, 437–471, 1996.
25
Knapp, A. N., DiFiore, P. J., Deutsch, C., Sigman, D. M., and Lipschultz, F.: Nitrate isotopic composition between Bermuda and Puerto Rico: implications for N(2) fixation in the Atlantic Ocean, Global Biogeochem. Cy., 22, Gb3014, doi:10.1029/2007gb003107, 2008.
Knapp, A. N., Hastings, M. G., Sigman, D. M., Lipschultz, F., and Galloway, J. N.: The flux and isotopic composition of reduced and total nitrogen in Bermuda rain, Mar. Chem., 120, 83–89,
30
doi:10.1016/j.marchem.2008.08.007, 2010.
BGD
12, 4183–4211, 2015The3He flux gauge in
the Sargasso Sea
R. H. R. Stanley et al.
Title Page
Abstract Introduction
Conclusions References
Tables Figures
◭ ◮
◭ ◮
Back Close
Full Screen / Esc
Printer-friendly Version
Interactive Discussion
Discussion
P
a
per
|
Discussion
P
a
per
|
Discussion
P
a
per
|
Discussion
P
a
per
|
Lipschultz, F., Bates, N. R., Carlson, C. A., and Hansell, D. A.: New production in the Sargasso Sea: history and current status, Global Biogeochem. Cy., 16, 1001, doi:10.1029/2000gb001319, 2002.
Lomas, M. W., Steinberg, D. K., Dickey, T., Carlson, C. A., Nelson, N. B., Condon, R. H., and Bates, N. R.: Increased ocean carbon export in the Sargasso Sea linked to climate
5
variability is countered by its enhanced mesopelagic attenuation, Biogeosciences, 7, 57–70, doi:10.5194/bg-7-57-2010, 2010.
Lomas, M. W., Bates, N. R., Johnson, R. J., Knap, A. H., Steinberg, D. K., and Carlson, C. A.: Two decades and counting: 24-years of sustained open ocean biogeochemical measurements in the Sargasso Sea, Deep-Sea Res. Pt. II, 93, 16–32,
10
doi:10.1016/j.dsr2.2013.01.008, 2013.
Lott, D. E. and Jenkins, W. J.: Advances in analysis and shipboard processing of tritium and helium samples, International WOCE Newsletter, 30, 27–30, 1998.
Luz, B. and Barkan, E.: Net and gross oxygen production from O-2/Ar, O-17/16 and O-18/O-16 ratios, Aquat. Microb. Ecol., 56, 133–145, 2009.
15
MacMahon, D.: Half-life evaluations for3H,90Sr, and90Y, Appl. Radiat. Isotopes, 54, 1417– 1419, 2006.
Maiti, K., Benitez-Nelson, C. R., Lomas, M. W., and Krause, J. W.: Biogeochemical responses to late-winter storms in the Sargasso Sea, III-Estimates of export production using Th-234 : U-238 disequilibria and sediment traps, Deep-Sea Res. Pt. I, 56, 875–891,
20
doi:10.1016/j.dsr.2009.01.008, 2009.
Maiti, K., Buesseler, K. O., Pike, S. M., Benitez-Nelson, C., Cai, P. H., Chen, W. F., Cochran, K., Dai, M. H., Dehairs, F., Gasser, B., Kelly, R. P., Masque, P., Miller, L. A., Miquel, J. C., Moran, S. B., Morris, P. J., Peine, F., Planchon, F., Renfro, A. A., van der Loeff, M. R., Santschi, P. H., Turnewitsch, R., Waples, J. T., and Xu, C.: Intercalibration studies of
short-25
lived thorium-234 in the water column and marine particles, Limnol. Oceanogr.-Meth., 10, 631–644, doi:10.4319/lom.2012.10.631, 2012.
Marra, J.: Approaches to the measurement of plankton production, in: Phytoplankton Productivity: Carbon Assimilation in Marine and Freshwater Ecosystems, edited by: Williams, P. J. L., Thomas, D. N., and Reynolds, C. S., Blackwell, Malden, MA, 31 pp., 2002.
30
BGD
12, 4183–4211, 2015The3He flux gauge in
the Sargasso Sea
R. H. R. Stanley et al.
Title Page
Abstract Introduction
Conclusions References
Tables Figures
◭ ◮
◭ ◮
Back Close
Full Screen / Esc
Printer-friendly Version
Interactive Discussion
Discussion
P
a
per
|
Discussion
P
a
per
|
Discussion
P
a
per
|
Discussion
P
a
per
Michaels, A. F., Bates, N. R., Buesseler, K. O., Carlson, C. A., and Knap, A. H.: Carbon system imbalances in the Sargasso Sea, Nature, 372, 537–540, 1994.
Ostlund, H. G., Dorsey, H. G., and Rooth, C. G.: GEOSECS North Atlantic radiocarbon and tritium results, Earth Planet. Sc. Lett., 23, 69–86, 1974.
Owens, S. A., Buesseler, K. O., Lamborg, C. H., Valdes, J., Lomas, M. W., Johnson, R. J.,
5
Steinberg, D. K., and Siegel, D. A.: A new time series of particle export from neutrally buoyant sediments traps at the Bermuda Atlantic Time-series Study site, Deep-Sea Res. Pt. I, 72, 34–47, doi:10.1016/j.dsr.2012.10.011, 2013.
Palter, J. B., Lozier, M. S., and Barber, R. T.: The effect of advection on the nutrient reservoir in the North Atlantic subtropical gyre, Nature, 437, 687–692, 2005.
10
Peterson, B. J.: Aquatic primary productivity and the C-14-Co2 method – a history of the productivity problem, Annu. Rev. Ecol. Syst., 11, 359–385, 1980.
Price, J. F., Weller, R. A., and Pinkel, R.: Diurnal cycling – observations and models of the upper ocean response to diurnal heating, cooling, and wind mixing, J. Geophys. Res.-Oceans, 91, 8411–8427, 1986.
15
Qiu, B. and Huang, R. X.: Ventilation of the North Atlantic and North Paciifc: subduction vs. obduction, J. Phys. Oceanogr., 25, 2374–2390, 1995.
Rooth, C. G. and Ostlund, H. G.: Penetration of tritium into the North Atlantic thermocline, Deep-Sea Res., 19, 481–492, 1972.
Scarratt, M. G., Marchetti, A., Hale, M. S., Rivkin, R. B., Michaud, S., Matthews, P.,
20
Levasseur, M., Sherry, N., Merzouk, A., Li, W. K. W., and Kiyosawa, H.: Assessing microbial responses to iron enrichment in the Subarctic Northeast Pacific: do microcosms reproduce the in situ condition?, Deep-Sea Res. Pt. II, 53, 2182–2200, 2006.
Singh, A., Lomas, M. W., and Bates, N. R.: Revisiting N-2 fixation in the North Atlantic ocean: significance of deviations from the Redfield ratio, atmospheric deposition and climate
25
variability, Deep-Sea Res. Pt. II, 93, 148–158, doi:10.1016/j.dsr2.2013.04.008, 2013. Spitzer, W. S. and Jenkins, W. J.: Rates of vertical mixing, gas-exchange and new production
– estimates from seasonal gas cycles in the upper ocean near Bermuda, J. Mar. Res., 47, 169–196, 1989.
Stanley, R. H. R., Jenkins, W. J., and Doney, S. C.: Quantifying seasonal air–sea gas exchange
30
BGD
12, 4183–4211, 2015The3He flux gauge in
the Sargasso Sea
R. H. R. Stanley et al.
Title Page
Abstract Introduction
Conclusions References
Tables Figures
◭ ◮
◭ ◮
Back Close
Full Screen / Esc
Printer-friendly Version
Interactive Discussion
Discussion
P
a
per
|
Discussion
P
a
per
|
Discussion
P
a
per
|
Discussion
P
a
per
|
Stanley, R. H. R., Baschek, B., Lott, D. E., and Jenkins, W. J.: A new automated method for measuring noble gases and their isotopic ratios in water samples, Geochem. Geophy. Geosy., 10, Q05008, doi:10.1029/2009GC002429, 2009a.
Stanley, R. H. R., Jenkins, W. J., Doney, S. C., and Lott III, D. E.: Noble gas constraints on air–sea gas exchange and bubble fluxes, J. Geophys. Res., 114, C11020,
5
doi:10.1029/2009JC005396, 2009b.
Stanley, R. H. R., Doney, S. C., Jenkins, W. J., and Lott, III, D. E.: Apparent oxygen utilization rates calculated from tritium and helium-3 profiles at the Bermuda Atlantic Time-series Study site, Biogeosciences, 9, 1969–1983, doi:10.5194/bg-9-1969-2012, 2012.
Stark, S., Jenkins, W. J., and Doney, S. C.: Deposition and recirculation of tritium in the North
10
Pacific Ocean, J. Geophys. Res., 109, C06009, doi:10.1029/2003JC002150, 2004.
Steinberg, D. K., Carlson, C. A., Bates, N. R., Johnson, R. J., Michaels, A. F., and Knap, A. H.: Overview of the US JGOFS Bermuda Atlantic Time-series Study (BATS): a decade-scale look at ocean biology and biogeochemistry, Deep-Sea Res. Pt. II, 48, 1405–1447, doi:10.1016/s0967-0645(00)00148-x, 2001.
15
Steinberg, D. K., Lomas, M. W., and Cope, J. S.: Long-term increase in mesozooplankton biomass in the Sargasso Sea: linkage to climate and implications for food web dynamics and biogeochemical cycling, Global Biogeochem. Cy., 26, Gb1004, doi:10.1029/2010gb004026, 2012.
Stewart, G., Moran, S. B., Lomas, M. W., and Kelly, R. P.: Direct comparison of Po-210, Th-234
20
and POC particle-size distributions and export fluxes at the Bermuda Atlantic Time-series Study (BATS) site, J. Environ. Radioactiv., 102, 479–489, 2011.
Talley, L. D.: Shallow, intermediate, and deep overturning components of the global heat budget, J. Phys. Oceanogr., 33, 530–560, 2003.
Weiss, W. M. and Roether, W.: The rates of tritium input to the world oceans, Earth Planet. Sc.
25
Lett., 49, 435–446, 1980.
BGD
12, 4183–4211, 2015The3He flux gauge in
the Sargasso Sea
R. H. R. Stanley et al.
Title Page
Abstract Introduction
Conclusions References
Tables Figures
◭ ◮
◭ ◮
Back Close
Full Screen / Esc
Printer-friendly Version
Interactive Discussion
Discussion
P
a
per
|
Discussion
P
a
per
|
Discussion
P
a
per
|
Discussion
P
a
per
Table 1. Fluxes calculated from the flux gauge technique for two different time periods. 1σ
uncertainty estimates for each flux is given in parentheses underneath the reported value for each quantity.
QuikSCAT Winds NCEP Winds Time Period NO3:3He×10−3
(µmol pmol−1)
3He Flux
(pmol m−2y−1) NO3Flux
(mol m−2y−1)
3He Flux
(pmol m−2y−1) NO3Flux
(mol m−2y−1)
2003–2006 82.9 7.9 0.66 8.3 0.69 1985–1988 (2.1)
34.5
(1.4) –
(0.18) –
(1.4) 30.4
BGD
12, 4183–4211, 2015The3He flux gauge in
the Sargasso Sea
R. H. R. Stanley et al.
Title Page
Abstract Introduction
Conclusions References
Tables Figures
◭ ◮
◭ ◮
Back Close
Full Screen / Esc
Printer-friendly Version
Interactive Discussion
Discussion
P
a
per
|
Discussion
P
a
per
|
Discussion
P
a
per
|
Discussion
P
a
per
|
Table 2.The fractional uncertainty caused by different sources in the calculations of nitrate flux (numbers given are for 2003–2006 time period but results are similar if use 1985–1988 time period).
Source of Error % uncertainty Reference or method Air–sea gas exchange 14 % Stanley et al. (2009)
Dynamic solubility equilibrium 10 % Dynamic solubility equilibrium calculated with range from Bourg and Sposito (2008) and range of gas exchange from Stanley et al. (2009)
Measurement error 5 % Integration of error at each time point NO3:3He Slope 2.5 % Type 2 regression
BGD
12, 4183–4211, 2015The3He flux gauge in
the Sargasso Sea
R. H. R. Stanley et al.
Title Page
Abstract Introduction
Conclusions References
Tables Figures
◭ ◮
◭ ◮
Back Close
Full Screen / Esc
Printer-friendly Version
Interactive Discussion
Discussion
P
a
per
|
Discussion
P
a
per
|
Discussion
P
a
per
|
Discussion
P
a
per
Figure 1.A time series of helium isotope ratio anomaly (in percent) relative to the atmospheric
3
BGD
12, 4183–4211, 2015The3He flux gauge in
the Sargasso Sea
R. H. R. Stanley et al.
Title Page
Abstract Introduction
Conclusions References
Tables Figures
◭ ◮
◭ ◮
Back Close
Full Screen / Esc
Printer-friendly Version
Interactive Discussion
Discussion
P
a
per
|
Discussion
P
a
per
|
Discussion
P
a
per
|
Discussion
P
a
per
|
BGD
12, 4183–4211, 2015The3He flux gauge in
the Sargasso Sea
R. H. R. Stanley et al.
Title Page
Abstract Introduction
Conclusions References
Tables Figures
◭ ◮
◭ ◮
Back Close
Full Screen / Esc
Printer-friendly Version
Interactive Discussion
Discussion
P
a
per
|
Discussion
P
a
per
|
Discussion
P
a
per
|
Discussion
P
a
per
Figure 3.The observed relationship between excess (tritiugenic)3He and dissolved inorganic nitrate near Bermuda at four points in time. The 1986 and 2005 relations are based on approximately 3 year time series occupations near Bermuda (the former at Hydrostation S and the latter at BATS). The 1981 and 1997 data sets are from cruise stations within∼500 km of the site. Only samples with potential density anomalies less than 26.8 kg m−3
are plotted and used. Note the “waterfall” effect at low 3He and nitrate concentrations in the euphotic zone, where the two tracers become uncoupled due to differing boundary conditions. The straight lines, from which the slopes are obtained, are type II linear regressions of points with nitrate concentrations in excess of 2 µmol kg−1
BGD
12, 4183–4211, 2015The3He flux gauge in
the Sargasso Sea
R. H. R. Stanley et al.
Title Page
Abstract Introduction
Conclusions References
Tables Figures
◭ ◮
◭ ◮
Back Close
Full Screen / Esc
Printer-friendly Version
Interactive Discussion
Discussion
P
a
per
|
Discussion
P
a
per
|
Discussion
P
a
per
|
Discussion
P
a
per
|
BGD
12, 4183–4211, 2015The3He flux gauge in
the Sargasso Sea
R. H. R. Stanley et al.
Title Page
Abstract Introduction
Conclusions References
Tables Figures
◭ ◮
◭ ◮
Back Close
Full Screen / Esc
Printer-friendly Version
Interactive Discussion
Discussion
P
a
per
|
Discussion
P
a
per
|
Discussion
P
a
per
|
Discussion
P
a
per