USING GEM - GLOBAL ECONOMIC MODEL IN ACHIEVING
A GLOBAL ECONOMIC FORECAST
Camelia Mădălina Orac
Faculty of Law, Social and Political Sciences, Dunărea de Jos University of Galati
Florentin Caloian
The Bucharest University of Economic Studies
The global economic development model has proved to be insufficiently reliable under the new economic crisis. As a result, the entire theoretical construction about the global economy needs rethinking and reorientation. In this context, it is quite clear that only through effective use of specific techniques and tools of economic-mathematical modeling, statistics, regional analysis and economic forecasting it is possible to obtain an overview of the future economy.
Keywords: evolution of real GDP, consumption and investment, labor and capital factor, productivity, governmental sector
JEL Code: F00
1. Introduction
The present paper aims to describe the global forecasting economic models: GEM2004, GEM2007, GEM2008 and GEM2010 in their historical evolution through the advantages and limitations of each model.
The first such model is GEM2004, based on the correlation between the academic scientific research and the existing economic policy models. After its application, the result was that the real GDP in the Euro area will increase as a result of higher capital stock and the number of hours worked. Consumption will increase as a result of increased investment and depreciation of the Euro, while investment will be influenced by economic reforms implemented.
The GEM 2007 is a multiregional model covering the global economy and allows the analysis of bilateral trade flows and their relative prices (including exchange rates) for each region. After simulation, the result is a different economic development on regional blocks. The highest quarterly growth rates will continue to have the emerging economies in Asia.
Meanwhile, another applied model GEM2008, and the latest version GEM2010, that are conducted by the World Bank, unfortunately they lead to some conflicting results.
2. The evolution of the GEM models
The global models have evolved both in terms of quality and the number of restrictions considered. Moreover, the restrictions of global models must take into account the international situation that changes constantly, so it can be used to quantify the economic development in the current crisis conditions, for example.
The global economic models can be analyzed in terms of quality, in terms of three stages.
The first stage is related to the GEM 2004 model. This model has provided a non-technical approach of the development based on microeconomic connections developed in the IMF's Research Department. The GEM 2004 had as predecessor the model MULTIMOD.
The GEM 2004 was based on the correlation between the academic scientific research and the economic policy models available.
The evolution of the macroeconomic models can be divided into the following steps:
expansionary macroeconomic policies. This approach was reflected in growth patterns made by Flemming and Mundell.17,18;
the rational expectations the Keynesian approach: this has allowed the generation of a more realistic response to the cyclical economic dysfunctions. On the other hand, this approach does not seem to be strongly grounded theory, which represents a difficulty for analyzing the effects of economic policies on aggregate supply. The main model of this type is MULTIMOD19;
the real business cycle approach: it presents a strong theoretical foundation, which improves the approach in terms of supply and allows direct determination of the economic welfare. The prices flexibility premise limits the use of the macroeconomic policy analysis. One such model is that of Mendoza20;
the dynamic stochastic general equilibrium approach: integrates supply and aggregate demand response through microeconomic theory. Models in this category are in an early stage of development and presents difficulties of construction and implementation. From this class of models belongs GEM, with its different variants.
The GEM model, version 2004, operates with companies that produce goods, households that consume and provide the labor and capital factor to firms, and a government sector that collects taxes and carries out specific costs.
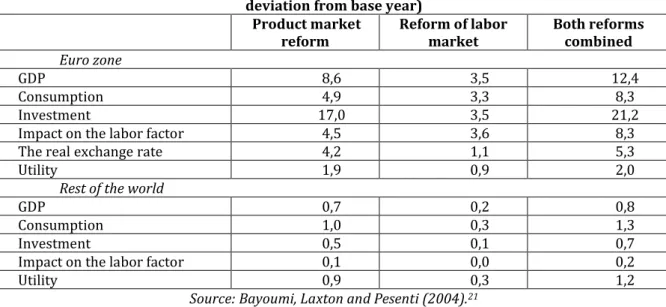
Table 1: Projected long-term effects of economic reforms in the GEM 2004 (percentage deviation from base year)
Product market
reform Reform of labor market Both reforms combined Euro zone
GDP 8,6 3,5 12,4
Consumption 4,9 3,3 8,3
Investment 17,0 3,5 21,2
Impact on the labor factor 4,5 3,6 8,3
The real exchange rate 4,2 1,1 5,3
Utility 1,9 0,9 2,0
Rest of the world
GDP 0,7 0,2 0,8
Consumption 1,0 0,3 1,3
Investment 0,5 0,1 0,7
Impact on the labor factor 0,1 0,0 0,2
Utility 0,9 0,3 1,2
Source: Bayoumi, Laxton and Pesenti (2004).21
The microeconomic structure of the GEM 2004 uses standard functional approach, enabling businesses and consumers to be aggregated as if they were one entity.
In terms of output, the small firms that produce different goods operate under the same elasticity of substitution. As a result, the GEM 2004 uses simple CES production function that quantifies labor and capital.
The goods are differentiated and firms have market power and restrict the output in order to obtain additional profits. Intermediate goods and capital are produced and can be traded, while the factor labor in each country is considered to be fixed. The labor factor chooses how much is willing to work and how much to relax and have fun.
Based on the income obtained, the labor factor acquires imported or national goods, process highlighted by a CES function. The model focuses on trade and macroeconomic interdependence.
17Fleming, J. M., Domestic Financial Policies under Fixed and under Floating Exchange Rates, Staff Papers, International Monetary
Fund, Washington, November 1962, pp. 369-379.
18 Mundell, R. A., Capital Mobility and Stabilization Policy under Fixed and Flexible Exchange Rates, Canadian Journal of Economics and
Political Science 29, November 1963, pp. 475-485.
19 IMF, MULTIMOD Mark III, The Core Dynamic and Steady-State Models, IMF Occasional Paper No. 164, 1998.
20 Mendoza E. G., Endogenous sudden stops in a business cycle model with collateral constraints: a Fisherian deflation of Tobin's Q, NBER
Working Paper Series, Working Paper 12564, 2006.
21 Bayoumi T., Laxton D. and Pesenti P., Benefits and Spillovers of Greater Competition in Europe: A Macroeconomic Assessment, ECB
As a result, the fiscal and financial components are relatively simple. The forecast horizon is 25 years, divided into 100 quarters.
The GEM 2004 was initiated on the premise of increasing competition in the Euro area and the U.S., which will lead to benefits for both the EU and the rest of the world.
Based on data from Table 1, it can be highlight the following trends in the economic development of countries of the world for the period 2004-2029:
the real GDP in the euro area has increased by 12.4% as a result of higher capital stock by 20% and the number of hours worked by 8%. Almost two thirds of these benefits are attributed to the property market reform and over 1/3 to the labor factor market reform. The projected evolution of the real GDP is shown in Figure 1;
-4 -2 0 2 4 6 8 10 12 14
0 10 20 30 40 50 60 70 80 90 100
Euro zone
Other industrialized countries
Figure 1: Quarterly evolution of Real GDP (%)
the consumption growth in the euro area is 2/3 of the real GDP and it reflects the increased investment and depreciation of the Euro;
-4 -2 0 2 4 6 8 10
0 10 20 30 40 50 60 70 80 90 100
Euro zone
Other industrialized countries
Figure 2: Quarterly evolution of consumption (%)
the increased demand in the Euro area as a result of increasing consumer income leads to increase imports from the rest of the world. External consumption will increase by 1.25%, which is 1/6 of the same indicator growth in the Euro area;
the welfare increase is significant: it has reached 2.5% in the Euro area and 1.25% in the rest of the
world, if we refer to consumption;
the wages and prices in the Euro area have become more flexible, which facilitates the intervention of
the European Central Bank (ECB) in the monetary area, in order to cyclic stabilize of the economy;
the increase of the national output does not change, even if the control parameters are changed, except for the changes in the labor market, which depends on the correlation between the number of hours worked and the real wage. In case of the rest of the world, the effects are much more sensitive to control parameters, especially when considering substitution of national to the imported goods;
the economic reforms allow rapid growth of investment but consumer benefits appear later.
0 5 10 15 20 25 30
0 10 20 30 40 50 60 70 80 90 100
Euro zone
Other industrialized countries
The GEM model, version 2007 was implemented by specialists of the National Bank of Canada. They expanded standard GEM model by introducing analysis also the unsold and the traded goods sectors, including petroleum products, respectively non-oil products22. In addition, the oil sector was decomposed in oil production and petroleum products for retail consumption.
The GEM 2007 is a multiregional model covering the global economy and allows the analysis bilateral trade flows and their relative prices (including exchange rates) for each region.
The model divides the world economy into five regional blocks: Canada (CA), USA (U.S.), the emerging economies in Asia (AS), goods exporting countries (CX) and the remaining countries (RC)
Table 2: Regions analyzed by the GEM 2007 model
No. Region Member States
1. CA Canada
2. US U.S.A.
3. CX OPEC states (Iran, Iraq, Kuwait, Libya, Nigeria, Qatar, Saudi Arabia,
Venezuela), Algeria, Argentina, Australia, Azerbaijan, Bahrain, Brazil, Chile, Indonesia, Mexico, New Zealand, Norway, Oman, Russia and South Africa 4. AS China, Hong Kong, India, South Korea, Malaysia, Philippines, Singapore and
Thailand
5. RC The EU-25 and Japan
Source: Lalonde R., Muir D.
Each of the five regional blocks consists of:
the companies sector (the monopoly), which produces raw materials, intermediate and final goods; two categories of households (to differentiate their limited liquidity from the consumers’ perspective)
that consume final goods and represents the labor offer to the companies;
the government, consisting of a fiscal authority which consume goods and services financed by taxes and loans, and a monetary authority that influence short-term interest rates through the monetary policy.
In the GEM model 2007, the companies are covering the goods offer for the domestic and foreign customers and meet their labor factor needs from the inside of the analyzed country. The companies also need intermediate goods, which are purchased from other domestic or foreign manufacturing companies. Consumers, in turn, size the demand for the domestic and foreign firms’ goods and provide the labor factor for the national companies.
The model in its linear form can be regarded as a system characterized by functions of demand, supply and price, using substitution’s constant elasticity, of E.S.C. function type.
The practical use of the GEM 2007 model is based on the following assumptions:
for areas where the foreign countries impact occurs (rest of world), regional indices are explicitly incorporated into the notation, where H is the inner region and the R region representative for the rest of the world;
productivity trend (TREND) is the same for the world economy. All quantitative variables of the model
are expressed in terms of TREND. But productivity growth is just one component of economic growth. Another component is population growth, but model assumed this increase zero during the forecast.
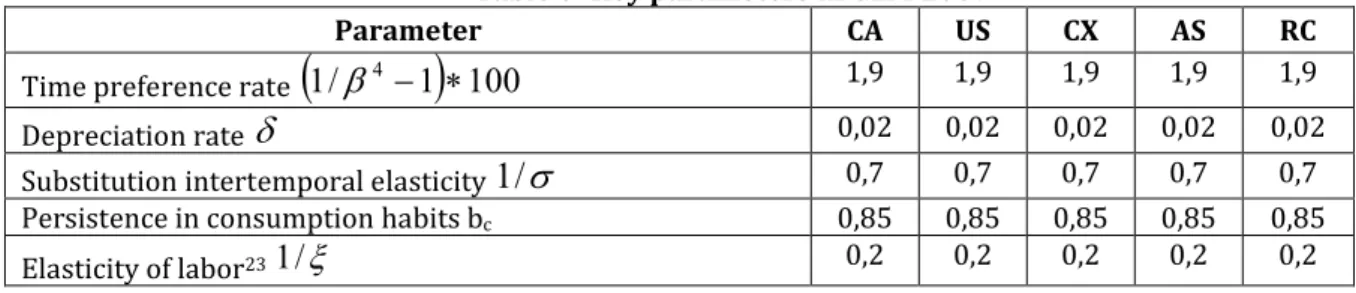
The GEM 2007 simulation has used the following key parameters:
Table 3: Key parameters in GEM 2007
Parameter CA US CX AS RC
Time preference rate
1
/
4
1
100
1,9 1,9 1,9 1,9 1,9Depreciation rate
0,02 0,02 0,02 0,02 0,02Substitution intertemporal elasticity
1
/
0,7 0,7 0,7 0,7 0,7 Persistence in consumption habits bc 0,85 0,85 0,85 0,85 0,85Elasticity of labor23
1
/
0,2 0,2 0,2 0,2 0,222Lalonde R., Muir D., The Bank of Canada’s Version of the Global Economy Model (BoC-GEM), Ottawa, 2007.
23 Frisch R., A complete scheme for computing all direct and cross demand elasticities in a model with many sectors, Econometrica 27,
Parameter CA US CX AS RC Share of liquidity constraints in consumption SLC 0,2 0,2 0,2 0,2 0,2 Persistence of traditions in the labor factor bl 0,75 0,75 0,75 0,75 0,75
After simulation, the result is a different economic development on regional blocks. The largest quarterly growth rates will still have the emerging economies in Asia.
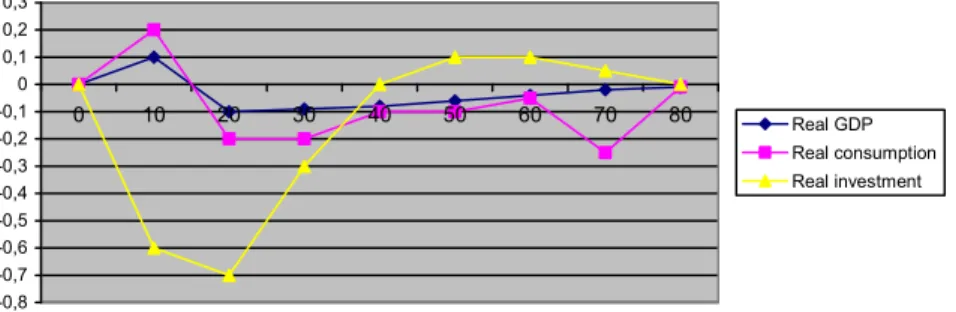
-0,8 -0,7 -0,6 -0,5 -0,4 -0,3 -0,2 -0,1 0 0,1 0,2 0,3
0 10 20 30 40 50 60 70 80 Real GDP Real consumption Real investment
Figure 4: Quarterly evolution of GDP, consumption and investment in Canada (%)
-0,7 -0,6 -0,5 -0,4 -0,3 -0,2 -0,1 0 0,1 0,2 0,3
0 10 20 30 40 50 60 70 80 Real GDP Real consumption Real investment
Figure 5: Quarterly evolution of GDP, consumption and investment in the U.S. (%)
0 1 2 3 4 5 6
0 10 20 30 40 50 60 70 80
Real GDP Real consumption
Figure 6: Quarterly evolution of GDP and consumption in the emerging economies in Asia (%)
0 0,1 0,2 0,3 0,4 0,5 0,6
0 10 20 30 40 50 60 70 80
Real GDP Real consumption
Figure 7: Quarterly evolution of GDP and consumption in the EU and Japan (%)
1. households: they consume final goods and provide labor factor (l) to all the national companies. Some of these households do not have access to the capital markets. They finance their consumption exclusive with revenues from work. Other households benefit from the portfolio of national companies and the domestic capital stock (K), which they rent to these companies. In addition, they buy and sell two types of securities: national, denominated in national currency and international.
When households are buying and selling international titles, they pay a premium (fee) to the financial intermediaries, whose size depends on the total net asset position of the country.
Labor and capital are considered internationally immovable. The capital market is competitive and the capital accumulation is affected by cost adjustment. On the labor factor market, the wage contracts are relatively rigid.
2. companies: they produce final goods and provide brokering services. In each country, there are two categories of final goods: consumption goods (A) and investment goods (E), which are produced by firms on a market with perfect competition.
Consumer goods are purchased by households or government (GC). The demand for investment goods is supported by private agents (I) and the public sector (GI). Final goods are produced using all available inputs of intermediate goods.
There is a variety of intermediate goods, each produced by a single company, which operates in a monopolistic market. The intermediate goods are produced using the domestic labor factor and internal capital. Intermediate goods are non-marketable (N) or marketable (T) on the international market.
The intermediate non-marketable goods can be purchased by the government (NG) or used to produce final goods (NN).
Tradable intermediate goods used by the national firms are denoted by Q and M imports from other countries.
3. government: it acquires the two categories of the national final goods and non-marketable services. Through Treasury, the government finances its expenditures from the net taxes imposed to the national private sector. Through the central bank, government handles the nominal short-term interest. Monetary policy is considered as a credible government commitment to guarantee the price stability by influencing the nominal interest rate on short term.
The world economy is considered to be composed of N regional blocs. The size of the world economy is normalized to 1. Each H country size is denoted by SH, where:
1
0
s
H
and
Hs
H
1
whereH
N
.
The global economic trend is the variable TREND. The gross rate of global growth during t - τ is denoted by
g
t, :t
t
TREND
TREND
g
, .
All quantitative variables for each country are expressed in terms of TREND. The exception is the labor factor effort l, defined by endowment. In the long term, gt,t+1 converges to gss and
g
t converges tot ss
g
, where gss is a constant.
Nominal prices expressed in national currency are denoted by capital letters variables, while relative prices are denoted by lowercase variables.
Without affecting the level of generality, it is considered that in each country, relative prices are expressed in terms of domestic consumption by the consumer price index (CPI).
The inflation rate for the same period of time, t - τ, is denoted by
t,and is calculated as itfollows:
t A A
P
P
, ,
3. Conclusions
The GEM models have been developed based on the latest research in finance and international monetary economics. First, this class of models is based on the theory of the New Open Economy whose initiators are Obstfeld and Rogoff24,25,26.
Currently, the GEM is an intertemporal approach, which is able to analyze the fundamental problems of international economic policy and the effects of structural shocks in the context of highlighting the connections established between different countries and regional blocks.
Like other general equilibrium, stochastic, dynamic models, the GEM combines the long-term features of business cycle models with short term Keynesian models.
Furthermore, the GEM model provides a microeconomic structure that allows an integrated analysis of the positive elements and the economic welfare.
References
1. Lalonde R., Muir D., The Bank of Canada’s Version of the Global Economy Model (BoC-GEM), Ottawa, 2007.
2. Mendoza E. G., Endogenous sudden stops in a business cycle model with collateral constraints: a Fisherian deflation of Tobin's Q, NBER Working Paper Series, Working Paper 12564, 2006.
3. Bayoumi T., Laxton D. and Pesenti P., Benefits and Spillovers of Greater Competition in Europe: A Macroeconomic Assessment, ECB Working Paper no.341, Frankfurt, 2004.
4. Obstfeld M., Rogoff K., Global Implications of Self-Oriented National Monetary Rules, Quarterly Journal of Economics 117, 2002, pp. 503-36.
5. Obstfeld M., Rogoff K., New Directions for Stochastic Open Economy Models, Journal of International Economics 50 (1), 2000, pp. 117-153.
6. IMF, MULTIMOD Mark III, The Core Dynamic and Steady-State Models, IMF Occasional Paper No. 164, 1998. 7. Obstfeld M., Rogoff K., Exchange Rate Dynamics Redux, Journal of Political Economy 103, 1995, pp. 624-660.
8. Mundell, R. A., Capital Mobility and Stabilization Policy under Fixed and Flexible Exchange Rates, Canadian Journal of Economics and Political Science 29, November 1963, pp. 475-485.
9. Fleming, J. M., Domestic Financial Policies under Fixed and under Floating Exchange Rates, Staff Papers, International Monetary Fund, Washington, November 1962, pp. 369-379.
10. Frisch R., A complete scheme for computing all direct and cross demand elasticities in a model with many sectors, Econometrica 27, 1959, pp. 177-196.
24 Obstfeld M., Rogoff K., Exchange Rate Dynamics Redux, Journal of Political Economy 103, 1995, pp. 624-660.
25 Obstfeld M., Rogoff K., New Directions for Stochastic Open Economy Models, Journal of International Economics 50 (1), 2000, pp.
117-153.
26 Obstfeld M., Rogoff K., Global Implications of Self-Oriented National Monetary Rules, Quarterly Journal of Economics 117, 2002, pp.