Instituto Superior de Economia e Gestão
Mestrado em: Economia Monetária e Financeira
Business Cycle Accounting in Japan
Gustavo Alberto Martins Ribeiro da Cunha
Orientação:
Prof. Doutor Luís Costa
Júri composto por:
Prof. Doutor Miguel St. Aubyn (Presidente do júri)
Profª. Doutora Isabel Horta Correia
Prof. Doutor Luís Costa
Índice
Índice ... 1
1.Introduction ... 5
2. A Brief View of the Business Cycle Accounting Technology... 6
3. Japan: from the miracle economy to the depression of the nineties... 7
3.1. The Japanese outstanding growth... 7
4. The Japanese “Lost Decade”: the crisis and causes ... 10
4.1. Financial System Distress... 10
4.1.1. Post-War Financial System ... 10
4.1.2 The Main Bank System ... 11
4.1.3 The Causes and the Character of the Crisis... 13
4.1.3.1. The Causes... 13
4.1.3.2. The Process of Financial Deregulation... 13
4.1.3.3. The Ever-Greening Problem... 15
4.1.3.4. Adverse Selection and Moral Hazard... 15
4.1.3.5. Creation and burst of the twin bubble ... 16
4.1.3.6 Consequences of globalization ... 18
4.1.3.7 Financial technological inovation... 19
4.1.3.8 Some remarks ... 19
4.1.4. Possible Wedges arising from the Financial System Distress... 19
4.1.4.1. Efficiency Wedges... 19
4.1.4.2 Investment Wedges ... 21
4.2. Corporate Governance in Japan... 22
4.2.1.1. Labor-Management Relations ... 23
4.2.1.2. Ownership and Control... 23
4.1.2.3. Cross-shareholding ... 24
4.1.2.3. The of Role Banks ... 25
4.2.2. System Overview and Recent Developments... 25
4.2.3. Possible Wedges in Corporate Governance... 26
4.2.3.1.Efficiency Wedges... 26
4.2.3.2. Labor Wedges... 27
4.3. Dualist Economic System... 27
4.3.1 Possible Wedges ... 29
4.3.1.1. Efficiency Wedge ... 29
4.3.1.2. Labor Wedge ... 29
4.4 Saving surplus, over-capacity and over-employment... 29
4.4.1. Possible Wedges ... 31
4.4.1.1. Efficiency Wedges... 31
4.4.1.2 Investment wedge ... 32
4.5. Government policy mismanagements and bureaucrats vested interests... 32
4.5.1. Government Policy Mismanagements... 32
4.5.2. Bureaucrats Vested Interests ... 35
4.5.3 Possible wedges... 35
4.5.3.1. Efficiency Wedge ... 35
4.5.3.2 Labor Wedges... 36
4.5.3.3 Investment Wedges ... 36
5. Business Cycle Accounting: a detailed explanation... 36
5.2 Model frictions and wedges... 38
5.2.1 Efficiency wedges ... 38
5.2.2 Labor Wedge ... 38
5.2.3 Investment wedge ... 39
5.3 The Prototype Growth Model... 39
5.4 The accounting procedure ... 43
5.4.1 Measuring the wedges ... 43
5.4.2 Accounting results ... 50
5.4.3 Model findings using a single wedge ... 53
5.4.4 Model findings with wedge combinations ... 59
6. Business Cycle Accounting and the literature on the Japanese crisis ... 65
7. Conclusions ... 68
8. Bibliography: ... 72
9. List of Tables ... 75
1.Introduction
The performance of the Japanese economy in the 1990s was less than stellar. The average annual growth rate of per capita GDP was 0.5 percent in the 1991-2000 period. The comparable figure for the United States was 2.6 percent. Japan in the last decade, after steady catch-up for 35 years, not only stopped catching up but lost ground relative to the industrial leader. The question is why.
In Hayashi and Prescott (2002)
In the aftermaths of World War II Japan was a country in tatters with an economic system completely destroyed. They, then, engaged in a tremendous process of economic development that made them, in the beginning of the 1990’s, the second largest economy in the world, behind the United States of America, and ahead of the European Union. Japan based its growth on a state oriented market system, where Keiretsu were the main star of their industrial organization. This growth process was made with high technology export oriented firms, and with a strong bank based financial system.
However, at the end of 1980’s, with the burst of the twin speculative bubble in the real-estate and stock markets, everything changed. This asian country entered in a prolonged period of economic depression, with a very low GDP growth, a very strong deflationary spiral, and a financial system in complete failure. What happened to Japan? What were the economic distortions that made this once economically brilliant country suffer such a deep economic crisis?
able to explain better the Japanese “lost decade”, and to compare the results obtained with the existing literature about Japan’s crisis.
The strongest conclusions reached in this dissertation are that: (i) investment market frictions and total factor productivity fluctuations play a very important role in replicating the Japanese economy in the crisis period; (ii) the labor wedge does not play any significant role; and, (iii) the results are very consistent with the literature that explains the Japanese crisis. Consequently, any hypothesis or model that tries to explain what went wrong in Japan should always focus on efficiency and investment frictions.
This dissertation is organized as follows. Section 2 provides a brief explanation of business cycle accounting, as in Chari et al. (2004). Section 3 describes Japan’s growth process. The Japanese economic crisis, its causes and its possible wedges are presented in section 4. Section 5 explains the business cycle technology extensively, and provides us with the model’s results. Section 6 compares the model’s outcomes with the broad literature about the crisis in Japan. Finally, the section 7 presents us the conclusions.
2. A Brief View of the Business Cycle Accounting
Technology
This method has two components, namely, an equivalence result and an accounting procedure. The first one states that a large class of models with various frictions is equivalent to a prototype growth model with time-varying wedges. There are, mainly, four wedges, which are: (i) the efficiency wedge; (ii) the labor wedge; (iii) the investment wedge; and, (iv) the government consumption wedge. These wedges resemble, respectively, time varying productivity, labor taxes, investment taxes, and government consumption. Therefore, any economic distortion that generates an efficiency fluctuation will produce an efficiency wedge. In the same way any economic friction that creates a labor tax, or an investment tax will create a labor wedge, or an investment wedge, respectively. The government consumption wedge is generated by government expenditures. The accounting procedure will assess which wedge is able to better explain the Japanese fluctuations.
In section 4 below, it is presented the main causes and characteristics of Japan’s economic crisis, and all the possible wedges found in it.
3. Japan: from the miracle economy to the depression
of the nineties
3.1. The Japanese outstanding growth
focused on home investment intended to create domestic-based firms, specifically hierarchical vertical Keiretsu conglomerates (which substituted the Zaibatsu dismantled by the Americans). In doing so, Japan entailed an industrial technological upgrade, emulating more developed nations, such as the U.S.
All this process was completely driven by the government in the form of protectionist regulations and through investment guidance using a state-augmented bank-based financial system to channel the capital stock to policy-targeted sectors and projects. Therefore each bank in the “Main Bank System” would finance their own Keiretsu
group, under the close supervision and control of the government. In this development process stock and bond markets were completely repressed by state authorities.
The event that triggered all of this was the burst, in 1990, of the real-estate and stock speculative bubbles that grew in the 1980’s. In that decade, the Japanese Yen suffered a strong appreciation that harmed the economy. In consequence, a very loose and an expansive monetary policy was followed, allowing the interest rates to achieve a post- war low. This policy overheated the economy permitting the creation of stock and real- estate inflation, that peaked in 1989. Japan’s Nikkei 225 Stock Average rose from 6000 yen in 1980 to 40000 yen in 1989, while in the same period real-estate prices almost doubled (see Hoshi and Kashyap, 2003).
However, by 1989 those bubbles were considered unsustainable by the Ministry of Finance (MoF) and monetary policy was tightened. The outcome was the end of both speculative bubbles (the Nikkei 225 Stock fell 50% in the first nine months after the burst) and consequently an outburst of deep financial distress with a huge non-performing loan problem and an economic deflationary stagnation.
Notwithstanding the 1990’s depression, in the post-war years Japan was able to build the second-largest economy in the world. It is a high-saving, high-investment, low-consumption economy with a very developed industry based mainly on high-tech
Table I:
AVERAGE GROWTH OF GDP1950-2000(% PER YEAR)
1950-73 1973-90 1990-2000
Japan
USA
Western Europe
8,8 3.8 1.3
2.9 3.4 3.6
2.0 2.2
4. The Japanese “Lost Decade”: the crisis and causes
4.1. Financial System Distress
One of the most decisive characteristics of the Japanese lost decade is its financial system meltdown with a huge non-performing loan problem and widespread bankruptcies. All this financial disruption started with the well-known burst of the twin asset and real-estate bubble in the late 1980s, but it seems that this event on its own cannot explain all the deepness of Japan’s financial distress. Some more profound and structural features may help to illuminate all this financial mess. Therefore, in the next section it will be made a concise discretion of the Japanese post-war financial system and then the possible causes and character of this crisis will be exposed. In the last part of this section the possible wedges related with this feature will be stated.
4.1.1. Post-War Financial System
4.1.2 The Main Bank System
In the Main Bank System (for more details see Patrick, 1998) a main bank has strong business relationships – usually including cross-shareholding - with its industrial customers, lending funds to finance their investments. It involves close monitoring by the bank of the company, gathering exhaustive information on the company’s strategy and performances, that otherwise would not be available. In return the bank is obliged to rescue its client when this falls in financial difficulties.
It is an extremely segmented system designed to specialize by size of customer and by term and type of loan. The Big Banks were the core of the banking system. These were divided in city banks (which operate all over the country), trust banks (that accept longer term deposits), and the long-term credit banks (that finance the building and functioning of factories). These were the banks that had the function of financing the large industries. Below them came the regional banks which provided funds to medium and small local firms. To complete this entire repertoire there was a whole panoply of deposit-taking institutions – like mutual savings, credit associations or credit co-operatives.
Moreover, a “convoy” system was built where all banks would grow at the same speed, in a way similar to ships in a convoy, navigating at the pace of the slowest one (Spiegel, 1999). Whenever a financial institution was in trouble, it would be merged with a larger and stronger one. Any losses would be more than offset by the franchise value of the branches and by future favours given by the Ministry of Finance (MoF). Therefore, the system’s safety would be provided by the system itself.
One of the main features of this financial system was the close, symbiotic relationship between state authorities, namely the MoF, and the Big Banks, securities companies and insurance companies. A collusive behaviour with the leadership of the MoF existed through severe “(…) administrative guidance, price setting, protection and restriction of competitive impulses” (Patrick, 1998). Due to this promiscuous relations between banks and state, the system was allowed to be extremely opaque with little disclosure and non transparency. This was needed because banks made many loans based on criteria other than creditworthiness.
4.1.3 The Causes and the Character of the Crisis
In this section some of the main causes which contributed for the current situation of financial distress in Japan will be exposed. Later, the major features of this financial mess will be analysed.
4.1.3.1. The Causes
Here, the phenomena that are thought to be the most important origins of the reported crisis will be described. The causes analyzed are: (i) the process of financial deregulation that began in the 1980s in Japan and its consequences; (ii) the ever-greening problem; (iii) the adverse selection and moral hazard problems; (iv) the rise and burst of the twin bubble; (v) the effects of globalization; and (vi) the financial technological innovation.
4.1.3.2. The Process of Financial Deregulation
rates came down pressuring for a system of market based interest rates where banks could enhance their competitiveness.
Another important reason for this deregulation was the expansionist fiscal policy of the mid 1970’s that was intended to fight the recession, implemented with a record issuing of government bonds. Then, for these bonds to be placed, the public authorities had to liberalise the bonds market in some way. This liberalisation proved contagious forcing eventually a progressive deregulation in various important markets such as the money market, the domestic securities market, or the wholesale funds market. With the foreign trade law in 1980, and some relaxation in the restrictions on international financing, this kind of funding has also become a good borrowing font for Japanese companies. Thus, by the end of the 1970’s the autarkic and regulated corporate financial system had started a one-way trip to deregulation. This process of deregulation had some negative effects on the Japanese financial system helping to its weakness and later collapse.
The first negative outcome of this process was the fact that it was constructed without the creation of an effective prudential regulation and supervision system adapted to this new environment of free competition. On the opposite the old collusive and “Wait-and-See” regulation of the convoy system was kept (Schaede, 1996). The obvious outcome was still an opaque system with a huge lack of disclosure, full of potential dangerous moral hazards situations.
households) meant that these agents could have access now to new, and sometimes cheaper, forms of funds. This led to large market-share losses for the banks. Big and financially strong companies started using their internal cash flows to finance their investments (lowering their dependence on bank loans). Unfair competition from government financial institutions which had better lending conditions. All these structural economic changes helped to deteriorate bank’s profit margins and to narrow their market shares, contributing to a weaker financial system.
4.1.3.3. The Ever-Greening Problem
The so called “ever-greening problem”, can be described as the phenomenon where the Japanese banks consciously continue to extend credit to insolvent borrowers where the prospects of being repaid are extremely doubtful (Hoshi and Kashyap, 2003). This behaviour artificially maintains inefficient firms in business and bars efficient new ones from entering the market, harming the productivity of the economy. Hoshi and Kashyap (2003) argue that this irrational behaviour happens due to strong pressures of the government, as, on one hand, the failure of these “zombie” firms would create more unemployment, and, on the other hand, banks want to hide the true situation of their customers and consequently also theirs.
4.1.3.4. Adverse Selection and Moral Hazard
which started to be channelled to their investments. Another cause is the financial liberalization of the domestic and international markets allowed for most credential and solid firms to get their financing from there. Only the smaller and weaker firms continued to depend heavily on bank loans boosting the risk faced by these institutions.
The profits and market shares loss faced by banks due to the process of deregulation, made them face some moral hazard situations. First of all, banks have been trying to overcome lower profit margins with riskier loans, using higher interest rates, but accepting a greater probability of default. An example of this behaviour was the increasing amount of loans given to risky real estate projects. Finally, with lower interest rates, banks have lost some incentive to continue the competent monitoring of their clients. Therefore, banks have been relaxing its monitoring facing a large risk due to their client’s risky behaviour.
All these situations only made Japanese banks more fragile, since they are now facing greater risk and dangerous client behaviour.
4.1.3.5. Creation and burst of the twin bubble
markets. Japan’s Nikkei Stock Average rose from 6000 yen in 1980 to peak at 40.000 yen at the end of 1989 and land prices doubled from 1980 to 1991 (Hoshi and Kashyap, 2003).
In 1989, the MoF tightened its monetary policy, increasing the interest rates with the idea that it would be possible to gradually shrink the bubble until it disappeared. However what happened was its burst with a consequent steep decline in both the stock and real estate prices. In the first nine months of 1990 the Nikkei Average Stock lost 50% of its value and continued its loss through the 1990’s. Real-estate prices had fallen to its 1980 values By 2003 (Hoshi and Kasyap, 2003). Consequently, a large number of firms and households started to experience great problems in paying their loans due to their loss wealth. Banks, already struggling with their own structural difficulties and weaknesses, were faced with an enormous amount of bad loans. The result was the collapse of the financial system with a huge non-performing loan (NPL) problem and some wide-spread bankruptcy.
loans and bankruptcies the banks liquidity decreased dramatically and, consequently, loans had to be rationed. Therefore, less money was available to lend and that damaged the investment channel of the Japanese economy; (ii) it increased inefficiency in bank loans, since they tried to save themselves by lending to riskier “zombie” projects, always expecting rescue from the state in the case anything would go wrong.
4.1.3.6 Consequences of globalization
Patrick (1999) refers that globalization had also a strong role in Japan’s financial mess. Moreover, this author argues that four important elements have contributed to the present situation. Firstly, Japan has become the largest creditor in the world due to its persistent current account-surplus. Therefore, Japanese financial institutions have engaged in foreign lending and portfolio investments exposing them selves to a massive exchange-rate risk. When the yen appreciated the losses were huge, almost in the same order of the NPL problem (Patrick, 1999). Second, as Japan has become a large country in the world markets, it now faces pressures and retaliatory measures by the U.S.A. or the E.U. Thus, it cannot export their way out of the crisis. Third, the flourishing of a free global capital market has increased the competition faced by the Japanese financial institutions, as the most solid firms would now obtain their funds abroad. Lastly, the deregulation process has allowed the installation in Japan of foreign banks which enhanced the competition in domestic financial markets.
4.1.3.7 Financial technological inovation
Japanese banks have not been able to keep up the pace of technological innovation that blurred in the 1990’s. That is a consequence of the way Main Bank System worked, as new products were prohibited for a long time, which did not allowed these banks to innovate. This system had clearly some characteristics that did not motivate banks to entail in more efficient forms of functioning. This collusive and promiscuous system stimulated the Japanese banks to keep their inefficient and non-innovating behaviour. The result was lack of capacity to adapt to the new forms of financial intermediation and consequent loss of competitiveness.
4.1.3.8 Some remarks
The persistence and deepness of the Japanese financial crisis make us believe that the burst of the twin speculative bubble only triggered the crisis. It cannot explain all the difficulties banks went through. The fact that these financial institutions did not seem able to overcome this distress, was clearly a result of structural deficiencies and handicaps brought in by the collusive, promiscuous, and opaque financial system built in the post war period. Therefore, if Japan wanted to return to financial stability it had to continue the reform packages with determination.
4.1.4. Possible Wedges arising from the Financial System Distress
4.1.4.1. Efficiency Wedges
from big banks and smaller businesses would obtain more expensive loans from smaller banks. Chari, Kehoe and Mcgrattan (2004) demonstrate in their paper that this kind of friction will always create an efficiency wedge since funds are applied not by efficiency criteria but by the company’s size. This will produce an input misallocation and consequently an efficiency wedge.
The convoy bank system had two characteristics that gave birth to a pair of efficiency wedges. Therefore, the fact that banks are obliged to grow at the same pace drag back the more efficient banks originating a less efficient system. Second, inefficient banks were not allowed to fail and that had the obvious consequence of decreasing the overall efficiency of the Japanese banking system.
The lack of disclosure, transparency and the severe opaqueness of the main bank system due to collusive and promiscuous relations with the state implied that banks would lend money to firms that were not very creditworthy and efficient. Funds would be channelled to more inefficient firms instead of going to efficient ones, creating a misallocation of resources and consequently an efficiency wedge.
In the Japanese banking system large profits were guaranteed. Thus, banks did not have an incentive to enhance their efficiency and to cut costs creating more inefficiency.
The ever-greening problem, comprehensibly described above, also created an efficiency wedge hence inefficient “zombie” firms obtained funds that could be applied in new more efficient ones. Total factor productivity will undoubtedly diminish.
The burst of the bubble produced a very steep decline in stock and real-estate prices, resulting in an extreme financial distress where banks suffered a severe solvency problem due to the huge NPL phenomenon. Then, banks tried to save themselves through reckless and inefficient lending in an attempted to obtain higher interest rates. Therefore, inefficient enterprises obtained funds that otherwise would have gone to efficient ones breaking the overall economic efficiency. This originates an efficiency wedge.
4.1.4.2 Investment Wedges
The post-war financial system completely repressed capital markets not allowing Japanese firms to have access to cheaper financial sources. Therefore, these firms were forced to contract more expansive loans from banks, creating an implicit tax on investment. This in turn originates an investment wedge.
liquidity, investment funds became more expensive and harder to find, leading to more deflationary pressures and therefore to a higher real interest rate.
Finally, the strong yen appreciation caused banks capital losses at the same level of the NPL problem. As a consequence, it also strongly contributed to the credit crunch, since their liquidity decreased. Thus, less credit was made available which led to more expensive loans. This increase in the costs of investment generated an investment wedge.
4.2. Corporate Governance in Japan
Japan has a very unique and typical corporate governance system which is, in a way, a consequence of its cultural and social characteristics. This briefly analyses the Japanese type of governance, which evolved essentially after World War II, and then it explains the possible wedges (efficiency, labor and investment) that arose from it.
4.2.1 Post-War Corporate Governance
4.2.1.1. Labor-Management Relations
Japanese corporations and managers see themselves as a community with responsibilities and obligations, in particular to its employees (Patrick, 2004). Therefore, the life-time employment system, where all employees have an almost (if not) 100% safety in the job, simultaneously, the seniority system was established, in which promotions and wages increases are based on age and not on merit.
The level of commitment of Japanese firms to their workers is enormous. Even when an economic recession strikes in, like it did in the 1990’s, the lay-offs and the resulting unemployment are always the very last resource. Japanese managers prefer to continue with unproductive workers or to transfer them into associated firms, or even to force early retirement with special benefits. These measures are extremely harmful to business activity as they diminish its efficiency and raise its costs. Thus, managers favour their employees instead of their company’s present and future competitiveness, i.e. instead of their shareholders interests.
4.2.1.2. Ownership and Control
It can be said that Japan is the most severe case of separation between ownership and control of companies. In this country, managers control and the ownership is, in the majority of cases, disseminated or inactive. This structure is one of great managerial independence and corporate governance strong norms of self-restraint, only partially constrained by its stakeholders, essentially their employees and creditors.
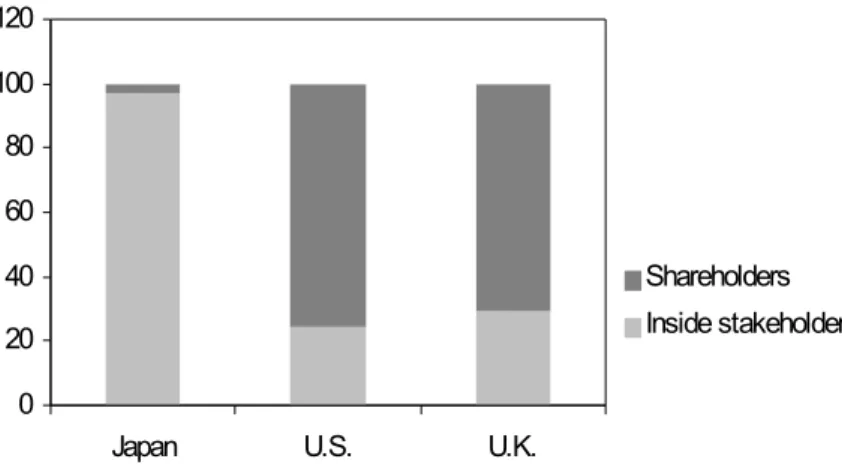
achieve the independent survival of the firm in perpetuity. Bankruptcy and mergers are seen as the worst possible outcomes. On the other hand, profit maximization has never been a top priority for Japanese managers and it is even seen as an anti-social, selfish behaviour. Indeed, in the 1990s, managers, when asked whose interest should be given primacy, inside stakeholders or shareholders, 97.1 per cent responded stakeholders (Patrick, 2004). By contrast, in the U.S. and in the U.K. only 24.4 per cent and 29.5 per cent, respectively, gave the same answer. Figure 1 shows it below.
0 20 40 60 80 100 120
Japan U.S. U.K.
Shareholders Inside stakeholders
Figure 1 – Shareholders vs Stakeholders
4.1.2.3. Cross-shareholding
relationships. The outcome of this was a very obscure and promiscuous system which Hugh Patrick describes as:
“(…) a system of cozy back-scratching, some might say collusion, among the management of
Japan’s large industrial companies, financial institutions, and the government bureaucracies –
particulary the Ministry of Finance (…) The system was opaque with minimal disclosure;
forbearance was the policy stance (…)”
In Patrick (2004).
4.1.2.3. The of Role Banks
Bank financing was clearly the main financial source used by the Japanese firms in their investments in the past decades since World War II – mostly until the 1980’s. This bank-firm relationship consisted in informal regular practices, institutional arrangements, and behaviours which formed a system of corporate finance and governance. In the finance distress point of this dissertation the banking system will be described more extensively.
4.2.2. System Overview and Recent Developments
The Japanese corporate government method, described above, worked reasonably well during the high-growth period. Hence, this prosperity hided all its errors and difficulties. But, when the crisis arrived it became obvious that this system would have to be changed in order to allow for the Japanese economy to recover.
also changed. Most importantly, some shareholder activism is now possible for the first time. Shareholders can have a greater impact on management. Investments can be financed more heavily by the capital markets and other financial instruments in bank’s detriment. The permanent employment and seniority system is slowly and weakly being challenged by the rise in the unemployment and meritocracy.
Although all this changes started to occur at the beginning of the new century, a lot is still to be done. The vested interests of the Japanese bureaucracy blocks the more aggressive, audacious, and most needed reforms in the corporate government system, undermining Japan’s economic growth.
4.2.3. Possible Wedges in Corporate Governance
4.2.3.1.Efficiency Wedges
The life-time employment system can undoubtedly create an efficiency wedge given that it keeps a person on a job, without monitoring their productiveness, implying a misallocation of inputs. The seniority system also produces an efficiency wedge, as more productive younger workers may start to put less effort since they are not compensated for their merit. This lowers productivity and consequently leads to an efficiency wedge.
control gives a great deal of power to the Japanese managers. Thus, a principal-agent problem exists, where those managers tend to undertake many investment projects regardless of their profitability of productivity. For that reason, some inputs will be misallocated originating an efficiency wedge.
The last efficiency wedge comes from the stable cross-shareholding and strong embedded relations that exist between Japanese firms and their suppliers. This is true because even when a supplier is inefficient and unproductive, his client can’t break the existing relation between them to switch to a new more efficient supplier. This clearly creates an efficiency wedge.
4.2.3.2. Labor Wedges
As has been said above, the Japanese corporate governance through its strong cross-shareholding and close ties between their firms, financial institutions (vertical and horizontal keiretsu), and even with the government and its bureaucracy, give space to the occurrence of some monopoly and cartel behaviour. Chari, Kehoe and Mcgrattan (2004) say that this kind of conduct leads to a labor wedge.
4.3. Dualist Economic System
industry. In the meantime, however, it has also created an extremely inefficient import-averse sector, where these industries are heavily regulated and protected from competition both domestic and foreign. Some primary industries (e.g. agriculture), service industries (such as transportations, telecommunications, retailing, finance and others) and manufacturing industries (food and beverage) constitute this sector.
There are two important facts to be reported about this phenomenon in the Japanese economy. The first is that the ever-growing trade surplus and consequent yen appreciation brought by the export oriented sector have putted an immense pressure on the import-adverse sector, as these goods became cheaper. This sector needed some efficiency improvement as well as an opening to competition and imports. Nevertheless, the Japanese authorities continued with their severe protectionist policy, not allowing this sector to enhance its productivity or to import cheaper products. The cost was a bigger efficiency gap between the two sectors and a price discrimination against domestic consumption. The second is that the two structurally differentiated sectors are not completely independent of each other. They are interconnected in a multiplicity of ways, mainly within the big keiretsu where the inefficient sector provides many services or even some inputs.
4.3.1 Possible Wedges
4.3.1.1. Efficiency Wedge
The maintenance of a dualist economic structure by the public authorities and its bureaucracy with one very productive sector and one very inefficient sector will surely lead to a misallocation of inputs and to a more inefficient economy. The lost of efficiency resulting from this phenomenon will give rise to an efficiency wedge.
4.3.1.2. Labor Wedge
One of the consequences of this dualist reality is the higher prices that Japanese consumers are forced to pay due to the strong protectionism. Thus, this can be seen as an implicit tax on the population’s income and so it can possibly induce to a labor wedge.
4.4 Saving surplus, over-capacity and over-employment
economic and financial crisis, this problem became even worse because investment opportunities fell even further and the investment channel collapsed.
This macroeconomic feature was extremely harmful for the Japanese economy since it appears as an insufficient aggregate demand and a huge saving-investment gap (Patrick, 2002). The outcome was a deterioration of the deflationary spiral that hindered the recovery of the Japanese economy, an unprecedented monetary ease and excess liquidity and an enormous government debt (over 140% of the GDP). The excess savings, hence a good thing, turned into a negative feature, as financial capacity not being used in a productive way. It was now a burden.
This economic crisis was also an overcapacity one where aggregate supply largely overcame the existent aggregate demand. A cause of this feature was a clear over-employment situation where firms, pressured by the government and its cultural heritage do not close down inefficient firms and subsidiaries keeping a large number of unproductive and unnecessary employees (labor hoarding). This excess supply pressured prices down, contributing to increase the deflationary spiral. On the other hand, the reluctance or even denial in firing inefficient and excess employees will clearly artificially keep unproductive companies in business, and that will diminish the economy’s efficiency.
Therefore, Japan had to allow some market adjustment and the failure of the “zombie” firms permitting the existence of some unemployment, as this will help a future sustainable economic recovery since new more efficient firms may substitute the inefficient ones. Nevertheless, Japan had also to work on the demand side implementing fiscal and monetary packages to stimulate consumption and investment.
4.4.1. Possible Wedges
4.4.1.1. Efficiency Wedges
4.4.1.2 Investment wedge
The existence of enormous savings surplus and an inadequately low aggregate demand push prices down originating more deflationary pressures. This will increase the real interest rate and conduce to an investment wedge.
The excess supply present in the Japanese economy as a consequence of overcapacity obviously lowers the market prices, and increases both deflation and real interest rates. This way investment becomes more expensive creating an investment wedge.
4.5. Government policy mismanagements and bureaucrats
vested interests
In this section some features related with government and state performance are described. Some policy mismanagements that contributed considerably to Japan’s past situation and the vested interests of powerful bureaucrats will be exposed.
4.5.1. Government Policy Mismanagements
tightening of the monetary policy resulted in the burst of the bubble and in the economic and financial distress of the past fourteen years.
The next policy mistake consisted in not applying an expansionary monetary and fiscal policy sooner and more forcefully in the first years of the 1990’s. In the early stages of the depression, public authorities saw this crisis mainly as a downturn in a normal business cycle, underestimating both the severe structural problems of the Japanese economy and the profound effects of the brutal decrease in asset values, i.e., the perception was that this distress would be short-leaved and the economic recovery would began rapidly. Hence, all this policy lethargy just helped to aggravate the crisis.
extreme deflationary spiral. All these mistakes contributed to weaken domestic demand encouraging even more the deflationary pressures.
The fourth macro policy mismanagement can be identified, in the fiscal area, and it is related to the fact that supplementary budgets of the 1990’s have been applied “(…) to little, too late, and most important, too grudgingly” (Patrick, 1999). Japanese fiscal packages did not inspire any confidence in economic agents because they were presented as temporary and incorporated offsetting policies which made them look ambiguous at the eyes of the private sector. This lack of credibility would, obviously, decrease their effectiveness and usefulness. More, the “real water” (real effective and productive fiscal incentives) that these fiscal budgets contained, was always less than it was claimed by the public authorities. So, the Japanese fiscal policy was also too confused and it had little real stimuli.
As it can be seen, the Japanese economic policy was everything but accurate. Both in monetary and fiscal terms, their measures were almost always too weak, too late, and exhibited several changes in direction that had the perverse effect of decreasing their own effectiveness and credibility. In order to escape such a deep crisis, monetary and fiscal policies need to be strong determined and require a clear and straight path. That is what the Japanese authorities needed to entail.
4.5.2. Bureaucrats Vested Interests
The magnitude of the Japanese economic crisis requested a huge amount of deep and consistent reform packages in almost all economic sectors and even more in the inefficient ones. Furthermore, these reforms would clearly hurt some strong vested interest groups in the Japanese society. Thus, these groups of bureaucrats, representing the inefficient part of the economy, started to lobby against big structural changes that might hurt them. Their power was and still is very large since they are one of the main forces that provide votes and money to the LPD. Consequently, they began to draw back some important actions that would help Japan moving out of the economic malaise. It is consensual that one of the main reasons for the persistence of the Japanese crisis is the lack of political determination to take correct measures, which is the outcome of pressure made by some vested interest groups.
4.5.3 Possible wedges
4.5.3.1. Efficiency Wedge
inefficient sectors. Therefore, this group of interests, by lobbying against reform is not allowing many inefficient segments of the Japanese economy to shut down. This certainly decreases the total factor productivity creating an efficiency wedge.
4.5.3.2 Labor Wedges
Chari, Kehoe and Mcgrattan (2004), demonstrate that monetary policy shocks combined with wage stickiness induce the formation of a labor wedge. As we know, monetary shocks in Japan were plenty in the past decade and wage rigidity is an observed fact as well. Therefore, a labor wedge arises from the combination of these two realities in Japan.
4.5.3.3 Investment Wedges
The overall conduct of the Japanese economic policy – fiscal and monetary – has been poor. It has been too weak, too late and ambiguitous. Thus, the lack of a determined, strong, and straight-forward economic policy has helped to increase the stagnation or even the deterioration of the Japanese domestic demand with obvious consequences of increasing the deflationary spiral. This means that the Japanese public authorities contributed to a rise in the real interest rate leading to an investment wedge.
5. Business Cycle Accounting: a detailed explanation
fluctuations, in a better way. This methodology has an equivalence result and an accounting procedure.
5.1 The equivalence result
In this specific technology, a large group of models with several different frictions are equivalent to a prototype growth model with dynamic wedges that look like time-varying productivity, labor taxes, and investment taxes. Thus, this time time-varying wedges are labelled as efficiency wedge, labor wedge, and investment wedge.
The theory behind this method is the well known idea that frictions that resemble taxes distort the relation between various marginal rates. As an illustrative example, that will be seen later, taxes in labor distort the intertemporal marginal rate of substitution, between consumption and labor, from the labor marginal product, and consequently creates a labor wedge. Also, taxes in investment distort the intertemporal marginal rates of substitution and the intertemporal marginal rates of transformation, producing an investment wedge. In the same way, taxes on intermediate goods cause inefficiencies in the production leading to an inefficiency wedge.
5.2 Model frictions and wedges
In this section I present and describe a large number of frictions which, according to Chari et al. (2004), map into efficiency wedges, labor wedges, and investment wedges. Notice that one friction can produce more then one wedge, for example, Chari et al. (2004) argues that input-financing frictions distort all three wedges.
5.2.1 Efficiency wedges
Chari et al. (2004) argue that the prototype model with an efficiency wedge is equivalent to a large class of models with different frictions. More precisely, it is stated the equivalence between this prototype model and economies with: (i) constant technology but where input-financing frictions vary over time; (ii) within-firm frictions resulting from work rules as in Schmitz (2001); (iii) monetary shocks in the presence of nominal rigidities; (iv) government policies; and (v) moral hazard in financial markets. This means that models with this sort of frictions can lead to aggregate product inefficiency mirrored in the prototype economy by the efficiency wedge. However, this paper also states that, besides these ones, all the economic frictions that leads to total factor productivity break down creates an efficiency wedge.
5.2.2 Labor Wedge
unions and antitrust policy shocks; (iii) cartelization theories; (iv) monopoly power exerted by firms and unions; (v) government policies; (vi) input financial frictions. This means that some economies with this kind of distortions produce a form of labor tax that resembles the labor wedge of the prototype economy. Once again is also argued that any friction resulting in a labor tax will originate a labor wedge.
5.2.3 Investment wedge
Finally, Chari et al. (2004) demonstrate there exists a found equivalence between the prototype economy with an investment wedge and models with: (i) credit-market frictions as in Bernanke and Gertler (1989) and Carlstom and Fuerst (1997); (ii) monetary shocks; (iii) government policies; (iv) costly state verification; and (v) input financial frictions. This implies that models with this sort of disturbances give rise to an increase in investment costs that are equivalent to the investment wedge of the prototype economy. More generally, all the frictions that give birth to a tax on investment will produce an investment wedge.
It is essential to notice that, in business cycle accounting, it is not important if a particular wedge exists or not, but its fluctuations overtime.
5.3 The Prototype Growth Model
in explaining the cyclical fluctuations in the post-bubble-burst period. This method is able to propose what classes of models are more accurate in reproducing the Japanese economic crisis. In the next chapter the outcomes at the simulation procedure will be used to identify the most promising explanations advanced in recent literature.
The benchmark prototype model that will be used to account for the “Japanese lost decade” is a growth model with three stochastic variables: the efficiency wedge At, the
labor wedge (1-τlt) and the investment wedge 1/ 1
(
+τxt)
. In each period the economyconsists on Nt identical agents. The representative household chooses per capita
consumption ct, per capita investment xt, and per capita labor lt as to solve the following
maximization problem:
(
)
(
)
(
)
0 0 , , 1 1max . . ( ,1 )
. . 1 . 1 . . .
. 1 . .
, 0, in all states,
t t t
t t
t
t t t
t c x l
t x t l t t t t t
t t t t t
t t
E N u c l
s t c x w l r k T
N k k x N
c x β τ τ δ ∞ = + + − + + = − + + = − + ≥
∑
(1)where kt denotes the per capita capital stock, wt the wage rate, rt the rental rate on
capital, β the discount factor, δ the depreciation rate for capital, and Tt is a lump-sum
tax. The first constraint is the intratemporal budget constraint and the second represents the aggregate capital-accumulation identity.
A representative firm uses capital and labor to produce the final good. The firms production function is given by At.F(kt,(1+gz)t.lt), where (1+gz)t is labor-augmenting
profits choosing the per capita labor lt and per capita capital kt, both implied by
households, that solves:
(
)
(
)
,
max . , 1 . . . . . . . , 1 .
0, 0 t t
t
t t z t t t t t
k l
t
t t t t z t
t
A F k g l r k w l
s t N y A F K g L
y t + − − = + ≥ ∀ ≥ (2)
where yt stands for aggregate per capita output. The government sets its taxes and
transfers such as its budget constraint
. .( . . . )
t t
t t t t l t t x t
N g + =T N τ w l +τ x , (3)
is satisfied. In this equation gt stands for government consumption. Furthermore, it is
assumed that the government spending is wasted every period and does not enter in the representative agent’s utility function. Since the representative household is infinitely living, ricardian equivalence holds, thus we can ignore government borrowing in its budget constraint.
In equilibrium the following conditions must hold:
(
)
(
)
. . . , 1 t.
t t t t t t t t z t
N c + +x g =N y =A F K +g L (4)
Note that in the following first order conditions any detrended variable *
t
v is given by:
* /(1 )t
t t t
v =v +g , i.e. a variable vt discounted by the long-term growth rate of
The first order conditions for the pair of maximization problems presented before give rise to the following equations:
,(1 ) .
t t
t
t z t
y A
F k g l
=
+
(5)
t (1 ). .
t t
t
l
l t l
c
U
A F
U τ
− = − (6)
1 1 1 1
.(1 ) . [ . (1 ).(1 )]
t t t t t
c x t c t k x
U +τ =β E U + A+ F+ + −δ +τ + (7)
ct+ +xt gt = yt (8)
where, Ulis the marginal utility of labor; Uc is the marginal utility of consumption; Fl
is the labor marginal product; and, Fk is the capital marginal product.
Thus, given the state of the economy by the wedges, St = (At,
t
l τ ,
t
x
τ , gt), and by the per
capita capital stock kt it is possible to obtain the recursive laws of motion for the
decision variables:
yt = yt(St,kt) (9) ct = ct(St,kt) (10) lt = lt(St,kt) (11) kt+1 = kt+1(St,kt) (12)
5.4 The accounting procedure
In the accounting procedure the preference’s parameters of the prototype model are chosen as in the standard quantitative business-cycle literature. Then, the data and the equilibrium conditions of the prototype model are used together to obtain the time series for the four wedges. In the following step, these values of the wedges are fed back to the model, either isolated or in combinations, so we can weigh up the fraction of output, labor, and investment movements that can be attributed to each wedge individually and to the various combinations of them. The role of the wedges is quantified by comparing the realizations of variables like output, labor, and investment from the model to their data values. Note that all four wedges put together account for all the observed movements in output, consumption, investment, and employment, which is what makes this method an accounting procedure.
5.4.1 Measuring the wedges
5.4.1.1 Working the data
total hours worked in each year, and values are obtained by adding monthly taken from OECD (2004).
Some accounting conventions were used. The investment Xt is the sum of the gross
fixed-capital formation and the change in inventories. Our aggregate consumption Ct is
calculated adding the net exports. This is not the only way of dealing with an open-economy reality in this closed-open-economy set up. However, this was the choice in Chari et al. (2004), Chakraborty (2004), and in Kobayashi and Inaba (2005). Using the same convention facilitates comparing the results with existing literature.
The capital stock series is calculated using the capital formation equation, kt+1 = xt +
(1−δ).kt. The initial capital stock, k0, is assumed to be its Japanese value in 1980.
5.4.1.2 Estimating the wedges
The process of measuring the wedges consists in two steps: (i) an estimation of the stochastic process for the wedges is done; and (ii) the realized wedges are obtained. We use it to estimate the efficiency wedge, the labor wedge, and the investment wedge. The government wedge is taken directly from the data. Having all the data needed and the model’s parameters we can use equations (5) to
decision rules of the model in question would depend on this expectations and thus on the stochastic process driving the wedges.
As it is mentioned above, without assuming the perfect foresight hypothesis it would be impossible to calculate the investment wedge directly from equation (7), as this would depend on expectations over future values of some variables, which are unknown. Chari et al. (2004) and Chakraborty (2004) present two alternative ways of overcoming this problem. In Chari et al. (2004) the investment wedge is generated through a kalman filter and the stochastic process for the wedges is estimated applying a Maximum Likelihood Estimation. In Chakraborty (2004), the investment wedge is produced, and the stochastic process is estimated through an iterative process between model simulations and SVAR estimations. However, Kobayashi and Inaba (2005) apply the business cycle technology to Japan using the perfect foresight assumption.
The first two methods may have the advantage of producing more accurate estimations, but have against it the fact that what we gain in accuracy may not compensate the extreme complexity of its computation. The third method may produce estimations with less accuracy, but it is simpler to compute. I have chosen this method for the sake of simplicity and following Kobayashi and Inaba (2005), when they argue that the perfect foresight method is almost as accurate as the other two. Nevertheless, I will test in the future the robustness of this technology results with respect to the estimation method used, or its parameterization sensibility.
production function is Cobb-Douglas with constant returns to scale At.F[kt,(1 + gz)t.lt] = At.ktθ.[(1 + gz)t.lt]1−θ. The felicity function is additively separable and is logarithmic, i.e.
it is given by u(c, 1 − l) = logc + ψlog(1 – l)1. The parameters values are taken from Prescott and Hayashi (2002). They chose θ = 0.36, i.e. a labor-share of 64 per cent of national income; β = 0.972, i.e. a discount factor of 2.9 per cent per year; δ = 0.089, i.e. a depreciation rate of 8.9 per cent per year; ψ = 1:13. The time endowment is of 5000 hours per annum.
Now, using the utility and the production functions we can obtain the following expressions for equations (5) to (8):
( ) (
)
*
1
* . 1 .
t t
t
t z t
y A
k g l
θ θ − = + (13) * *
. . 1
1 1 t
t t l t t c l y l ψ τ
θ = −
− − (14)
(
)
(
)
(
)
(
)
1 * 1 * * * 1 11 . 1 1
. . . 1 . 1
t
t
t
x z t
t x
t t t
g y
E
c c k
τ
β θ + δ τ +
+ +
+ + = + − +
(15)
* *
(
) (
)
*(
)
* * 11 . 1 . 1 .
t t z n t t t
c +g + +g +g k+ − −δ k = y (16)
Where gn is the constant growth rate of the population.
1
The next step is to obtain the stochastic process for the wedges. Since we have the data on yt, ct, lt and xt we can obtain gt directly from the data. The efficiency wedge At, the
labor wedge (1− t
l
τ ), and the investment wedge 1/(1+τxt) are calculated from equations
(13), (14) and (15), respectively. With all the values of the wedges we can now obtain the solution for the recursive laws of movement for the model.
In order to do that, the model is log-linearised about its steady-state, using the method described in King et al (1989). To complete the process the method of undetermined coefficients is used to obtain a solution for the log-linearised recursive laws of motion. Notice that if there were no shock on the wedges the economy would always be on its balanced-growth path with the per capita values of consumption, output, and investment growing at rate gz, and employment would be constant over time. Consequently, to
solve for the steady state it is needed to discount all variables on the balanced growth path by their balanced growth path rate gz (Chakraborty, 2004). This is done in
equations (13) to (16) by using the detrended values of the variables.
Let us now use equations (13) to (16) to compute the steady state values for the detrended variables. Note that from the
corresponding steady-state equations below we can also obtain the steady-state values for all the other variables. The year of 1980 is considered to be the steady-state where consumption ct, output yt, investment xt, capital stock kt, and employment lt are at their
steady state values. Thus, the steady-state equations solving for the wedges are given by:
( )
19801980 1
1980. 1980 y A
kθ l −θ
= (17)
1980 1980 1980 1980
1 . .
1 1 l c l y l ψ τ θ − =
− − (18)
(
)
1980
1980
1
1 . . .
1 . 1
x
y k
τ β θ
β δ
+ =
− − (19)
(
) (
)
(
)
1980 1980 1 z . 1 n . 1980 1 . 1980 1980
c +g + +g +g k − −δ k = y (20)
Now, the systemis log-linearized about its steady state, in order to obtain the laws of motion:
* . *
(
1)
.t t t t
A = y −θk − −θ l (21)
. * * 1 .
1 t 1
l
l t t t
l
y c l
l
τ τ τ
− = − −
− − (22)
(
)
(
)
(
) (
)
(
)
(
) (
)
1 * * 1 1 1. . . . 1 . .
. . 1 . 1 . 1 . . 1 . 1 .
t
t
t t t x t x
x t t z x x z x t
y
E y k E
k y
E c g g c
k
β θ β δ τ τ
β θ δ τ τ τ τ
+ + + + − + − − − + − + = + − + + (23)
where any variable zt =
(
zt −z)
/z and z is its steady state value. The next step is to specify a stochastic process for the wedges, more precisely, a vector autoregressive process (VAR1). If we define a vector [ , , , ]t t
t = At τ τl x gt
S , the VAR1 process is given by St+1 = P0 + P.St + Q.Et+1 and where εt+1 is normal and i.i.d. and Q is a lower
triangular matrix.
The parameters of this stochastic process are very important, as the parameters of the recursive laws of motion depend directly on them. Therefore, the next step in the accounting procedure is to find P0, P, and Q. This is done simply by estimating the
VAR with a Cholesky decomposition. With the values of P0, P, Q, and the stochastic
process of the wedges the parameters of the recursive laws of motion of the model can now be calculated.
5.4.1.3 Decomposition
The model’s measured realizations are used to decompose movements in variables from an initial date (1980), given an initial capital stock, into the four components consisting of movements driven by each of the four wedges away from their initial values at the initial date (Chari et al., 2004), assuming all the others stay at their steady state values, e.g. the efficiency component will be presented as [ , 0, 0, 0]T
t
A
=
A t
S . Other components can be defined in a similar fashion. Now, using these components and the initial period capital stock, k1980, we can calculate the capital-stock series fromkt+1 =kt+1(StA, )kt . Note
that 1 1( A, )
t t t
k+ =k+ St k is the estimated recursive law of motion of the capital-stock. Then, applying both A
t
decision variables of the model that can be attributed to the efficiency wedge. Thus, we obtain a set of equations for the log-deviations of the key variables:
yt = yt
(
A,kt)
t
S
(25)
ct =ct
(
SAt ,kt)
(26)lt =lt
(
A,kt)
t
S (27)
kt+1=kt+1
(
A,kt)
t
S
(28)
To obtain the movements in the decision variables due to other wedges, the same procedure is repeated, considering the appropriate wedge.
We can also compute the model using joint components, i.e. two or more wedges simultaneously. As an example, a joint component with the efficiency and the investment wedge is given by ,
[ , 0, , 0]
t T t x A τ = A x t
S . Thus, we obtain four simple wedge components, six dual components ( A l,
t
S , A x,
t
S , A g,
t
S , l x,
t
S , l g,
t
S , and x g,
t
S ), and four more triple components ( A l x, ,
t
S , A l g, ,
t
S , A x g, ,
t
S , and l x g, ,
t
S ).
5.4.2 Accounting results
In this sub-section the outcomes from applying the business-cycle accounting procedure to the Japanese case between 1980 and 2001, are presented and analysed. First, let us observe the evolution of variables like GDP or investment in Japan. Then, we will present the wedges and compare them with the GDP. In a second stage, the model’s findings with only one wedge will be compared with the Japanese data and finally in the last subsection, the model’s outcomes are presented for two-wedge combinations. Notice, since this is an accounting procedure, the model’s output from applying the four wedges simultaneously will not be presented, as it is known they account for 100 per cent of data fluctuations.
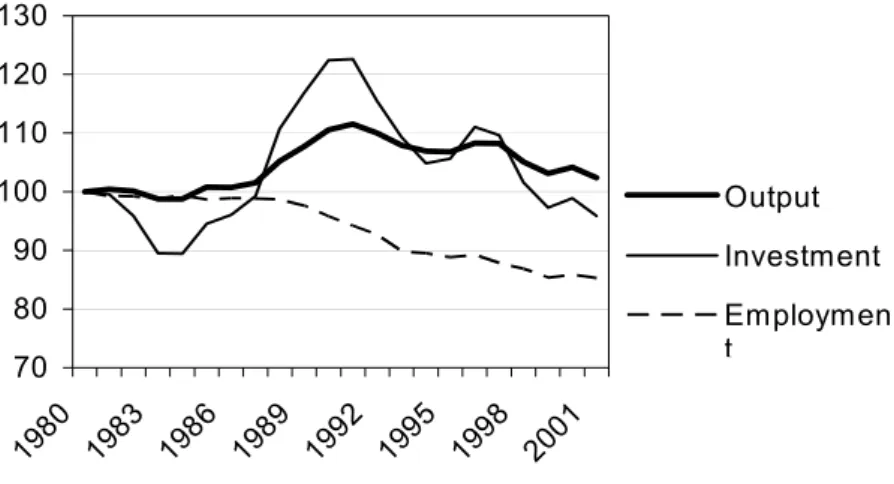
5.4.2.1 Japanese trends
70 80 90 100 110 120 130 198 0 198 3 198 6
1989 199 2 199 5 199 8 2001 Output Investment Employmen t
Figure 2 – Japanese detrended per capita values
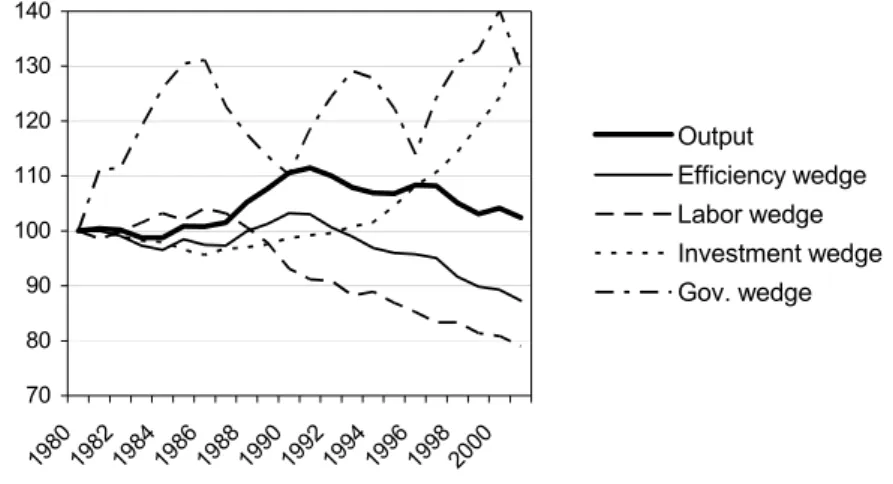
5.4.2.2 Wedges and Japanese GDP
70 80 90 100 110 120 130 140
19801982198419861988199019921994199619982000
Output
Efficiency wedge Labor wedge Investment wedge Gov. wedge
Figure 3 – Detrended output per capita and wedges (1980=100)
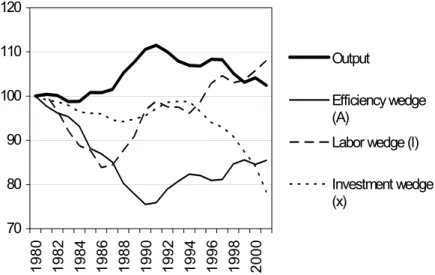
5.4.3 Model findings using a single wedge
It is important to notice that in the analysis presented below, four distinctive time periods were defined. The first period goes from 1980 to 1991, representing the bubble boom period. The second one begins in 1991 and goes until 1995, where the consequences of the bubble burst are visible. The third period ranges from 1995 to 1997 when Japan presented some signals of recovery. At last, it is defined the period between 1997 and 2001, as the recovery stalled and the crisis returned.
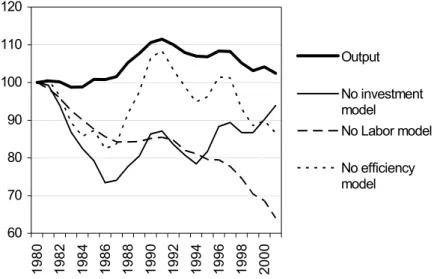
5.4.3.1Output
70 80 90 100 110 120 19 80 19 82 19 84 19 86 19 88 19 90 19 92 19 94 19 96 19 98 20 00 Output Efficiency wedge (A)
Labor wedge (l)
Investment wedge (x)
Figure 4 – Detrended output per capita (1980=100)
The efficiency wedge alone would imply a fall of −24.12 per cent between 1980 and 1991 (the boom period), a rise of 6.15 per cent between 1991 and 1995, a drop of 0.9 per cent between 1995 and 1997, and a positive growth of 4.3 per cent from 1997 throughout 2001. As it can be seen in figure 4, the efficiency wedge cannot explain output evolution, as it always produces the opposite growth rates when compared with the ones given by data.
Lastly, the investment wedge, cannot predict the output evolution from 1980 to 1991, as it generates a negative growth rate of −2.88 per cent. For the period between 1991 and 1995 this wedge explains 13.7 per cent of the output evolution. From 1995 to 1997 it shows a −3.51 per cent growth rate, which is a conflicting result with output data. For the last period, the investment wedge reproduces a growth rate of −14.74 per cent, as the output per capita data presents us a rate of −5.8%.
Observing the wedges effectiveness in predicting output evolution we can say that both investment and the labor wedges out perform the efficiency wedge. The efficiency wedge is not able to explain the output path in any of the defined time periods. The labor wedge, despite of the lack of accuracy, can reproduce some of the observed output evolution. The investment wedge can also explain part of the output path for the periods that go from 1991 to 1995, and 1997 to 2001. However, it is important to see that even when the labor and investment wedges replicate part of the output evolution, they tend to under or over-estimate the data.
5.4.3.2 .Employment
45 55 65 75 85 95 105 115 198 0 198 2 198 4 198 6 198 8 199 0
19921994199619982000
Employment
Efficiency wedge (A)
Labor wedge (l)
Investment wedge (x)
Figure 5 – Employment per capita (1980 = 100)
The model with only the efficiency wedge over-estimates the employment evolution between 1980 and 1991, as it generates a negative growth of −51.5 per cent, when the data registers a negative evolution of only −5.8 per cent. From 1991 to 1995 this wedge does not explains the employment evolution, as it suggests a rise of 9.81 per cent, opposed to a decline of 5.37 per cent observed in data. Between 1995 and 1997, this wedge overestimates, again, the employment data since it produces a drop of −3.78 per cent, when the data shows a fall of −0.95 per cent. In the last period, 1997 to 2001, the efficiency wedge cannot explain the data, as it shows an opposite evolution.
between 1997 and 2001, this wedge overestimates employment’s negative evolution, as it produces rates of −5.21 per cent and −18.9 per cent for periods where the data presents rates of −0.95 per cent and −2.6 per cent.
Therefore, the investment wedge clearly presents a better performance then the other two wedges. Nevertheless, the labor wedge can explain part of the employment progress in the 1991 to 1995 period, and the efficiency wedge normally overestimates employment. In spite of an improvement on the model’s accuracy in replicating the employment data (when compared with the output data), the simulations produced by the wedge models tend to overestimate the data.
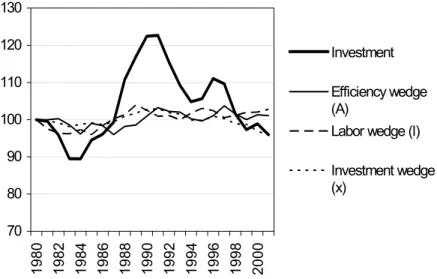
5.4.3.3 Investment
In figure 6, detrended investment per capita, in the data is compared with the model outcomes, when wedges are put separately.
70 80 90 100 110 120 130 198 0 198 2 198 4 198 6 198 8 199 0 199 2 199 4 199 6 199 8 200 0 Investment Efficiency wedge (A)
Labor wedge (l)
Investment wedge (x)
The efficiency wedge is comprehensively more precise in replicating the investment. For the period between 1980 and 1991 it accounts for 14.31 per cent of the rise in investment. From 1991 to 1995 it explains 21.1 per cent of the drop. For the time between 1995 and 1997 it presents a growth of 4.1 per cent, as the data registers a rate of 3.97 per cent. For the last period, (1997 to 2001) this wedges accounts for 19.1 per cent of the fall in investment.
The labor wedge captures 3.9 per cent of the investment evolution between 1980 and 1991. For the three remaining periods this wedge completely misses the investment data.
The investment wedge explains 13 per cent of the rise in investment between 1980 and 1991. From 1991 to 1995 it accounts for 18.21 per cent of its drop. For the period that 1995 − 1997 this wedge reproduces 10.75 per cent of the investment evolution. Lastly, between 1997 and 2001 the investment fall is accounted by the investment wedge in 31.71 per cent.