Chemical Characteristics Combined with Bioactivity for
Comprehensive Evaluation of Tumuxiang Based on
HPLC-DAD and Multivariate Statistical Methods
Xia Gao, Yu-Ling Ma, Pei Zhang, Xiao-Ping Zheng, Bo-Lu Sun and Fang-Di Hu* School of Pharmacy, Lanzhou University, Lanzhou 730000, China
*Correspondence:Fang-Di Hu, School of Pharmacy, Lanzhou University, Lanzhou Donggang Rd West199, Lanzhou, 730000, China. Tel./fax:+86 931 8915685;E-mail:hufd@lzu.edu.cn
ABSTRACT
Background: The dried roots ofInula heleniumL. (IH) andInula racemosaHook f. (IR) are used commonly as folk medicine under the name of“tumuxiang (TMX)”. Phenolic acid compounds and their derivatives, as main active constituents in IH and IR, exhibit prominent anti-inflammation effect.
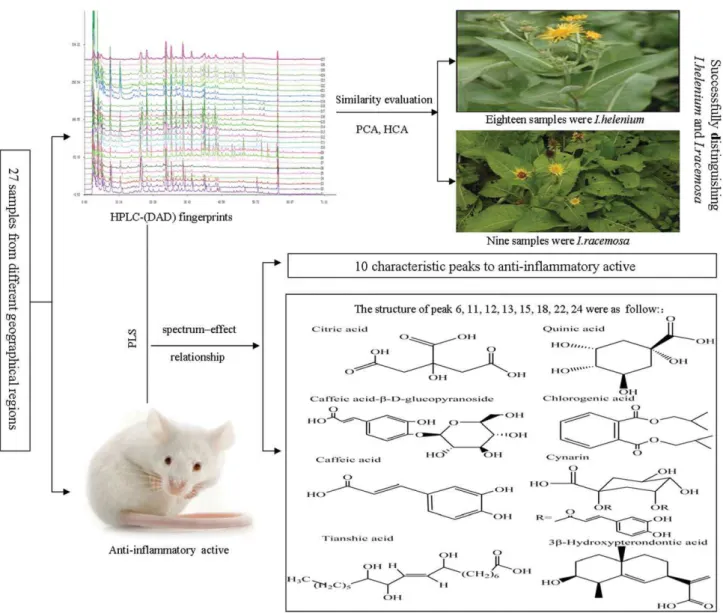
Objective: To develop a holistic method based on chemical characteristic and anti-inflammation effect for systematically evaluating the quality of twenty-seven TMX samples (including 18 IH samples and 9 IR samples) from different origins.
Methods: HPLC fingerprints data of AL (Aucklandia lappa Decne.) whose dried root was similar with HR was added for classification analysis. The HPLC fingerprints of twenty-seven TMX samples and four AL samples were evaluated using hierarchical clustering analysis (HCA) and principle component analysis (PCA). The spectrum-efficacy model between HPLC fingerprints and anti-inflammatory activities was investigated by principal component regression (PCR) and partial least squares(PLS).
Results: All samples were successfully divided into three main clusters and peaks 7, 9, 11, 22, 24 and 26 had a primary contribution to classify these medicinal herbs. The results were in accord with the appraisal results of herbs. The spectrum-efficacy relationship results indicated that citric acid, quinic acid, caffeic acid-β-D-glucopyranoside, chlorogenic acid, caffeic acid, 1,3-O-dicaffeoyl quinic acid, tianshic acid and 3β-Hydroxypterondontic acid had main contribution to anti-inflammatory activities.
Conclusion: This comprehensive strategy was successfully used for identification of IH, IR and AL, which provided a reliable and adequate theoretical basis for the bioactivity relevant quality standards and studying the material basis of anti-inflammatory effect of TMX.
Key words:Inula heleniumL.,Inula racemosaHook f., HPLC fingerprints, Spectrum-efficacy relationship, Multivariate statistical methods
Abbreviations:IH:Inula helenium L.; IR:Inula racemosa Hook f.; TMX: Tumuxiang; AL: Aucklandia lappaDecne.; HCA: Hierarchical clustering analysis; PCA: Principle component analysis; PCR: Principal component regression; PLS: Partial least squares; TCMs: Traditional Chinese Medicines; ChP 2015: Chinese Pharmacopoeia 2015; WHO: World health organization; FDA: Food and drug administration; HPLC-DAD: performance liquid chromatography-diode array detection; GC-MS: Gas chromatography-mass spectroscopy; HPLC-MS: High-performance liquid chromatography-mass spectroscopy; UPLC-MS: Ultra high-High-performance liquid chromatography-mass spectroscopy; RMSE: Root mean square error; RMSECV: Root mean square error of cross-validation; RRT: Relative retention time; RPA: Relative peak area; RSDs: Relative standard deviations
Received 15 November 2015; Accept 25 January 2016
INTRODUCTION
There are more than 20 species of the genusInulawidely found in China[1]. Among of them, the root ofInula racemosaHook f. (IR) and Inula helenium L. (IH) are used commonly as folk medicine under the name of“tumuxiang (TMX)”, and the later is especially used by Tibetan and also named“Manu”[2]. IH is recorded in Chinese Pharmacopoeia 2015 (ChP 2015) while IR is not recorded[3]. Since IH and IR possess anti-inflamma-tory, fungicidal, anticancer properties and other biological activities[4–7], they have been widely used for the treatment of abdominal distension and pain, acute enteritis and bacillary dysentery[8–9]. The studies on the chemical composition of IH and IR showed that both of them contained the active ingredients alantolactone, isoalantolactone, dihydroalantolac-tone and dihydroisoalantolacdihydroalantolac-tone[10–11]
. However, IH also
contained β-elemene, alantol, inulic acid and aromaden-drene[12–13], which were not contained in IR. IR contained sitisterol, daucosterol, inunolide, aplotaxene, phenyllacetonitile and isoinunal[14], while these chemical constituents were not found in IH. The dried root of IH and IR are difficult to distinguish because of the similarity of their morphology. In fact, it's a universal phenomenon that IH and IR are easily confused in the process of medicinal materials circulation and clinical use[2]. Because of the chemical composition of IH and IR is obvious difference, whether they can be substituted each other has been a problem urgently to be solved by pharmaceutical workers. Aiming at this problem, first of all, it’s in need of developing a rapid and effective identification method for two herbs.
The chromatographic fingerprinting has been widely used for the identification, authentication, characterization and classification of herbal medicines[15–16]
advised as an efficient method to control the quality of herbal medicines by world health organization (WHO) and food and drug administration (FDA)[17–18]. Modern hyphenated chromatographic techniques, such as high-performance liquid chromatography-diode array detection (HPLC-DAD), gas chromatography-mass spectroscopy (GC-MS) and high-performance liquid chromatography-mass spectroscopy (HPLC-MS), ultra high-performance liquid chromatography-mass spectroscopy (UPLC-MS), have become the most frequently applied and powerful techniques in analyzing such complicated systems. HPLC fingerprint analysis has been drawn much attention owing to its stable performance and getting large amount of information[19]. Multivariate statistical methods, HCA (hierarchical cluster analysis), PCA (principal component analysis), PCR (principal component regression) and PLS (partial least square) are frequently applied to analysis chromatographic fingerprints of TCMs to achieve the classification and identification of TCMs[20].
It has been widely acknowledged that TCMs take effects via a holistic mode of components and multiple-targets, the conventional modes based on the quantitative analysis of single active ingredient or several index ingredi-ents are not appropriate for reflecting the holistic bioactivity of TCMs. Meanwhile, the selection of index ingredients usually lack sufficient chemical and pharmacological evi-dence, resulting in poor bioactivity relevance in the quality control[21]. Spectrum-efficacy relationship is an emerging approach to facilitating the bioactivity relevant quality control of TCMs[22–23]
. There is no doubt that fingerprint-activity approach fits very well with the holistic mode of TCMs eliciting the pharmacological efficacy via multiple components. Liu et al. investigated the spectrum-effect relationship between UPLC fingerprints and energy metabo-lism of mitochondria of Fuzi, Yanfuzi, Heishunpian and Paofupian by using canonical correlation analysis, the results showed a representative way to discover the primary active ingredients from the complicated herbal drugs[24]. Shan et al. had reported that the spectrum-efficacy model between HPLC fingerprints and T-lymphocyte proliferative activities of Panax ginsengC.A. Meyer was investigated by PCR and PLS, that revealed the real bioactive compounds acting on the lymphocyte proliferative capacity[25].
In this study, the chemical fingerprint characteristics of IH and IR in twenty-seven samples from four different geogra-phical regions were analyzed by HPLC-DAD, for studying the differences between IH and IR from the perspective of the overall chemical compositions. In order to verify whether the taxonomic methods could be successfully applied to the classification and identification of the easily confused herbs, HPLC fingerprints data of AL whose dried root was similar with HR was added for HCA and PCA. Hence, HCA and PCA were performed to evaluate the HPLC fingerprints of twenty-seven TMX samples and four AL samples. The anti-inflammatory capacity of the 27 TMX samples (S1-27) was studied by using the inflammatory model of auricle edema induced by dimethylbenzene in mice. The spectrum-efficacy relationship of HPLC fingerprints and anti-inflammatory
activities was established by multivariate calibration techniques to simultaneously assess the predominant active components. The structure identification of the detected characteristic peaks was achieved by comparing their resolved spectra with the standard ones as well as the MS/MS fragments. Figure 1 displayed the entire analytical process of this work. On the one hand, the proposed strategy provided a method for the chemical identification of IH and IR; on the other hand, it could discover anti-inflammatory activity ingredients and provided the basis to select quality control indexes of TMX associated with anti-inflammatory activities.
METHODS
1. Materials and reagents
HPLC-grade acetonitrile was purchased from Merck (Darmstadt, Germany). Distilled water was further purified using a Milli-Q system (Millipore, Milford, MA, USA). Analytical grade formic acid was obtained from Nanjing Chemical Reagent CO. LTD. Citric acid, quinic acid, caffeic acid-β-D-glucopyranoside, chlorogenic acid, caffeic acid, 1,3-O-dicaffeoyl quinic acid, tianshic acid, 3β -Hydroxypter-ondontic acid were purchased from Shanghai Research Center of Chinese Medicine Standardization. All solvents were filtered through a 0.45 µm filter before injecting into HPLC.
Both TMX and AL grew at an altitude of 2000 meters above. Twenty-seven TMX samples and four AL samples were collected from the provinces of Gansu, Qinghai, Sichuan, Tibet and Yunnan during two years (Table 1). The voucher specimens were identified by Dr.Yinsuo Zhou (Lanzhou University).
2. Sample preparation
1.0 g of TMX powder after passing through a 40 mesh sieve was weighed accurately and introduced into a 50 mL round-bottom flask, and 20 mL water was added. The mixture was reflux extracted for 2 h and then allowed to stand for 60 min at room temperature to cool down. The extraction solution was filtered through a 0.45 µm syringe filter prior to HPLC analysis. AL samples were prepared with the same procedure.
3. Instrumentation and chromatographic condition
3.1. Liquid chromatographyA waters e2695 separations module equipped with a 1250 binary pump, a 2998 diode array detector (DAD) and a 717 plus autosampler was utilized to obtain HPLC fingerprints chromatograms. The system was controlled by Empower 3 software (Waters, USA). The chromatographic separation was performed using a Diamonsil C18(250×4.6 mm, 5μm) maintained at 30 °C. The mobile phase was acetonitrile (A) and 0.1% formic acid water (B) with a gradient program as follows: 0–8 min, 5% A, 8–25 min, 5–15% A, 25–40 min, 15–
23% A, 40–45 min, 23–30% A, 45–55 min, 30–60% A, 55–65 min, 60–100% A, 65–70 min, 100% A. Other chromato-graphic parameters were as follows: the flow rate was 1 mL/ min, the wavelength of detector was set at 280 nm. All samples were injected with 20μL.
www.wjtcm.org 37 2016 | Vol. 2 | Issue 2
World J Tradit Chin Med 2016; 2(2): 36–47 X. Gaoet al
Table 1. A summary of tested samples
No. Name Region Collection date No. Name Region Collection date
S1 IHQHXN1 Xining, Qinghai 2013.06.08 S16 IHTZSMZ1 Shimen zheng,Ganshu 2014.7.22 S2 IHQHXN2 Xining, Qinghai 2013.06.08 S17 IHTZSMZ2 Shimen zheng,Ganshu 2014.7.22 S3 IHQHXN3 Xining, Qinghai 2013.06.08 S18 IHTZSMZ3 Shimen zheng,Ganshu 2014.7.22
S4 IHQHXN4 Xining, Qinghai 2013.08.20 S19 IHSCCD1 Chendu, Sichuan 2013.7.8
S5 IHQHXN5 Xining, Qinghai 2013.08.20 S20 IHSCCD2 Chendu, Sichuan 2013.7.8
S6 IHQHXN6 Xining, Qinghai 2013.08.20 S21 IHSCCD3 Chendu, Sichuan 2013.7.8
S7 IRQHKM1 Kumbum Monastery,Qinghai 2013.3.9 S22 IRGSGN1 Gannan, Ganshu 2013.8.20 S8 IRQHKM2 Kumbum Monastery,Qinghai 2013.3.9 S23 IRGSGN2 Gannan, Ganshu 2013.8.20 S9 IRQHKM3 Kumbum Monastery,Qinghai 2013.3.9 S24 IRGSGN3 Gannan, Ganshu 2013.8.20 S10 IHQHKM4 Kumbum Monastery, Qinghai 2013.7.15 S25 IRTCD1 Changdu, Tibet 2013.8.20 S11 IHQHKM5 Kumbum Monastery, Qinghai 2013.7.15 S26 IRTCD2 Changdu, Tibet 2013.8.20 S12 IHQHKM6 Kumbum Monastery, Qinghai 2013.7.15 S27 IRTCD3 Changdu, Tibet 2013.8.20
S13 IHGSTZF1 Tianzhu,Ganshu 2014.7.22 S28 ALSCCD1 Chendu, Sichuan 2013.9.13
S14 IHGSTZF2 Tianzhu,Ganshu 2014.7.22 S29 ALSCCD2 Chendu, Sichuan 2013.9.11
S15 IHGSTZF3 Tianzhu,Ganshu 2014.7.22 S30 ALSCCD1 Yunnan 2013.9.9
S31 ALSCCD2 Yunnan 2013.9.14
Note:Inula heleniumL. (abbreviated: IH) andInula racemosaHook f. (abbreviated: IR) andAucklandia lappaDecne. (abbreviated: AL). Principles of naming: species abbreviations add the initial letter of collection areas.
3.2. Mass spectrometry
All experiments were conducted with a Quattro Premier XE Micro mass spectrometer (Waters Corporation) equipped with an electrospray ionization (ESI) source interfaced with an HPLC system (Waters Corporation). MS detection was performed in both positive ion and negative ion mode. The source parameters were electrospray capillary voltage 3.0 kV for positive ionization mode and 2.8 kV for negative ionization mode, source temperature 120 °C and desolvation temperature 300 °C. The cone voltage of 40 V was used throughout, with extractor voltage of 3 V and the RF lens voltage was set at 0.1 V. The desolvation and cone gas flows were set at 600 h/L and 50 h/L, respectively.
4. Animals
Kunming mice (18–22 g body weight, n=10 per group) were obtained from the Laboratory Animal Center of Lanzhou University (Lanzhou, China) and housed with unlimited access to food and water, the animals were maintained on an ambient temperature of 22–25 °C and a relative humidity of 60%. All animals were housed for 1 week before experiment. All animal experiments were conducted in accordance with the Guidelines for Animal Experimentation of Lanzhou University, and the protocol was approved by the Animal Ethics Committee of that institution.
5. Anti-inflammatory testing
The anti-inflammatory property of TMX was investigated using the model of auricle edema induced by dimethylben-zene in mice. The mice were divided into twenty-nine groups of 10 each. The positive group, test groups and blank group were intragastric administered with reference drug (indome-tacin, 30 mg/kg), tested extracts (9 g/kg) and normal saline for 10 days respectively. On the tenth day after administra-tion, the mice were topical applied 0.05 mL dimethylbenzene to both inner and outer surface of right ear. Mice were sacrificed by cervical dislocation 15 min later, and then the ear biopsies of both ears were obtained with a punch (a diameter of 8 mm) and weighed. Weight-increase-rate of the right ear over the left one indicated the vasodilatation[26].
6. Data analysis
6.1. Data pretreatmentThe data set consisted of an n×m matrix, in which rows represented the 27 TMX samples and 4 AL samples, and columns for the 28 peaks area for all data analyses. The similarity analysis was performed using Similarity Evaluation System for Chromatographic Fingerprint of TCM (Version 2004 A). HCA, PCA and PCR were implemented using SPSS 18.0 software. PLS was performed by SIMCA-P 11.5 Demo for statistical analysis.
6.2. Similarity analysis
The similarity analysis of IH and IR samples was carried out to determine the degree of similarity or dissimilarity of samples from each other. HPLC-DAD chromatogram data of all samples was submitted for analysis by the professional
software of Similarity Evaluation System for Chromato-graphic Fingerprint of TCM (Version 2004A). Then, S1 was chose as the reference chromatogram and the peaks would be matched. Subsequently, the standard chromatogram was produced, and the similarity value of all input chromato-grams relative to standard chromatogram would be calcu-lated by using the cosine value of the angle[27]. They were formulated respectively as follows[28]:
Rcon¼ ∑
n
i¼1 XiYi
ffiffiffiffiffiffiffiffiffiffiffiffiffi ∑
n
i¼1 X2
i
r ffiffiffiffiffiffiffiffiffiffiffiffi ∑
n
i¼1 Y2
i r
whereXi was the peak area in different fingerprints,Yiwas the mean peak area of twenty-seven samples and n was the number of peaks.
6.3. Hierarchical cluster analysis (HCA) and principal component analysis (PCA)
HCA[29] is a multivariate analysis technique so as to find relatively homogeneous clusters in view of the characteristics of the cases. PCA[30–31] is applied to determine underlying information from multivariate raw data by transforming and reducing the dimensions of the original data matrix for n samples and m variables into a product of two matrices, scores (T) and loadings (P), while containing the same information as of the original data[32]. The information about the samples is presented in the form of scores, while loadings focus on the variables that have the most influence over the difference between groups of samples. This new, smaller set contains the uncorrelated components called principal components (PCs), the linear combinations of the original variables[33]. The two multivariate statistical methods confirm mutually and each approach possesses own advan-tage that HCA reveals patterns across whole cases while PCA across variables.
6.4. Principal components regression (PCR) and partial least squares (PLS)
For the fingerprint-efficacy investigation, comparison of PCR and PLS was conducted to select preferable one to establish satisfactory calibration models[25]. PCR is a combination of PCA and least-squares regression[34]. Firstly PCA is performed to reduce the number of predictor variables as mentioned above. Some of these latent variables are used to build a predictive model by least-squares regression. PLS[35–36] expresses the inner relationship between independent variables (the m×n data matrix X) and dependent variables (y), which are simultaneously modeled by taking into account not only X variance, but the covariance between X and y. Generally, model complexity, such as the optimal number of PCs (latent variables) in PCR and latent factors in PLS, is estimated through the cross-validation procedure[37]. In order to char-acterize model suitably and prediction abilities, root mean square error (RMSE) and root mean square error of cross-validation (RMSECV) are usually calculated respectively[38].
www.wjtcm.org 39 2016 | Vol. 2 | Issue 2
World J Tradit Chin Med 2016; 2(2): 36–47 X. Gaoet al
RESULTS AND DISCUSSION
1. HPLC Fingerprints
Reversed-phase HPLC procedure was conducted in this work. Varying the ratios of 0.1% formic acid water and acetonitrile in the mobile phase provided a significant improvement in separation by yielding narrow and better-resolved peaks. The DAD wavelengths were monitored, Figure 2A showed the comparison of fingerprint spectra in the different wavelengths, and UV absorption at a wavelength of 280 nm was chosen because it generated the highest responses for the detection of all peaks. The HPLC finger-prints of 27 TMX samples at a wavelength of 280 nm were shown in Figure 2C. Twenty-eight peaks were labeled in the chromatographic fingerprints of 31 samples as input data for data analysis, if some peaks of the corresponding retention time were not found in the chromatogram of sample, the peak area was expressed used zero.
Nineteen peaks with large areas and good resolution under the present chromatographic conditions were collectively presented in chromatographic fingerprints of 27 TMX samples and selected as the common characteristic peaks (Figure 2B). Among of 19 common peaks, the 8th and 9th peak were identified as chlorogenic acid and caffeic acid by comparing with the chlorogenic acid standard and caffeic acid standard. Furthermore, the chlorogenic acid and caffeic
acid were at P13 and P15 in twenty-eight peaks of full spectrum respectively. The chlorogenic acid with the highest intensity in chromatography fingerprints of 27 TMX samples was chosen only as the reference peak to calculate the relative retention time (RRT) and relative peak area (RPA) for 19 common peaks in method validation.
2. Method Validation
To ensure the validity of this proposed method, the method precision was investigated by injecting sample 1 extracts on the same day and on three consecutive days for intra-day and inter-day variability with the selected condition. The varia-tion of the nineteen common peaks was expressed as RSDs. The RSDs of intra-day variability were below 1% for RRT and 5% for RPA. For inter-day precision, the RSDs were less than 0.6% for RRT and 5% for RPA. The sample stability was determined by analyzing a single sample solution stored at room temperature for 0, 2, 4, 6, 10, 24, 48 and 72 h. The RSDs of stability test were less than 1% for RRT and 5% for RPA, indicating that TMX extraction solution was stable within 72 h. Meanwhile, six replicates of sample 9 were subjected to extraction, and HPLC determination according to the methods discussed in Section 2.3.1 for testing the method repeatability. The results revealed that RSDs of RRT were less than 2% and RSDs of RRA were less than 5%, so the methods of sample preparation and chromatography analysis Figure 2.The comparison offingerprint spectra in the different wavelengths (A). The common peaks (peaks 1-19, peak 8, 10 were chlorogenic acid and caffeic acid respectively) (B). Thefingerprint chromatograms of 27 TMX samples at a wavelength of 280 nm (The chromatogram“R”was the standard
had good repeatability. All validation tests proved the quality of the studied method.
3. Chemometric methods
3.1. Similarity analysisThe standard chromatogram was shown in Figure 2C. Based on the standard fingerprint, the similarity values of twenty-seven fingerprints of TMX were presented in Table 2. The results showed that all the similarity values of each sample with the standard fingerprint of TMX were in a range of 0.575–0.913. The similarity of IR samples (S7–S9) with other IR samples (S22–S27) was higher than IH samples based on the high similarity values (0.729–0.9). It was clear that fingerprint characteristics of IH and IR from different geographical regions were difference.
3.2. Hierarchical cluster analysis (HCA)
HCA was conducted through Average Linkage (Between Groups) as a clustering method and Euclidean Distance was used to measure distances between the cases and clusters[39]. A dendrogram was generated from HPLC files (Figure 3). The thirty-one samples were divided into three main clusters (I, II and III). Cluster I included eighteen IH samples (S1–S6, S10–S21). Cluster II consisted of nine IR samples (S7–S9, S22–S27). Four AL samples (S28–S31) were classified as cluster III. The results were in good agreement with that of plant morphological identification. Samples from the same source or region with the similar longitude and latitude could be gathered together well and the differences between
them were small. This fact demonstrated that the quality of the IH, IR and AL from different regions had significant difference.
In this work, the studied compounds were mostly the principle components of IH, IR and AL. Therefore, the IH and IR could be roughly compared from a distance of the clusters. The results of clustering analysis were consistent with similarity analysis.
3.3. Principal component analysis (PCA)
PCA was processed by using peaks area of twenty-eight common peaks from 31 chromatograms as input data for calculation and all data were mean-centered. The first three principal components (PC 1, PC 2 and PC 3) describing 48%, 24% and 11% of the variability in the original observations respectively were extracted for analysis. The scatter plot of PCA scores was shown in Figure 4A, where each sample was represented as a dot. The plot described that the samples could be clearly classified into three domains. Samples 1-6 and 10–22 were in domain I, samples 7–9 and 23–27 were in domain II, while the others were in domain III. Domain I-III were marked for the IH, IR and AL respectively. Classifica-tion results were in line with clustering analysis results. The two pattern recognition analysis could provide a qualitative comparison and effectively distinguish the IH, IR and AL samples from different regions.
Since PC 1 and PC 2 explained 72% of the total variance, the loadings on these PCs (Figure 4B) were studied to interpret the contributions of the real variables to the model. Table 2. The calculated similarity values for 27 samples.
S1 S2 S3 S4 S5 S6 S7 S8 S9 S10 S11 S12 S13 S14 S15
The weight values of the important variables (P7, P9, P22, P24, P26 and P11) were 0.984, 0.983, 0.977, 0.932, 0.908 and 0.906 respectively, these six characteristic peaks had a primary contribution to distinguish samples. Also, we could find different peaks from the Figure 2C. Region a: P7 (retention time 10.236) didn’t exist in the fingerprints of all IR samples. Region b: there was no P11 (retention time 22.22) in nine IH samples (S13–S21). Region c: other samples had the P26 (retention time 42.362), besides S4–S6 and S18–
S20. Region d: only three IH samples (S4–S6) didn’t detect the P27 (retention time 47.048).
4. Anti-inflammatory activity
The aqueous extract of 27 TMX samples (9 g/kg) was found to significantly (Figure 5; P < 0.01) inhibit auricle edema formation when compared to the blank group. S7 appeared the highest anti-inflammatory capacity (P< 0.05) compared with six IH samples (S4–S6, S19– S21) and six IR samples (S22–S27).
5. Spectrum-efficacy relationship
5.1. Principal component regression (PCR)
Three PCs (1, 2 and 3) were selected to build a PCR model from the chromatograms in view of their ability to predict y assessed by full cross-validation when RMSE and RMSECV were 0.1357 and 0.1278 respectively. Figure 6A showed that the P2, P5, P16, P17, P20 and P27 appeared significant negative contributions to anti-inflammatory activities, and the contribution ratio of the 9 characteristic peaks that had
greater contribution to anti-inflammatory capacity ranked as P15 > P11 > P19 > P6 > P1 > P18 > P12 > P22 > P24. Although it was known that P13 (chlorogenic acid) possessed strong anti-inflammatory activities[40], it should have con-tribute to the model, yet this peak displayed suppression anti-inflammatory effect by PCR. This may be caused by the fact that PCR is primarily searching for the largest variation in the data, which is not necessarily the information in the chromatogram most correlated with the anti-inflammatory capacity[41].
5.2. Partial least squares (PLS)
The PLS was also employed to establish spectrum-efficacy model. The auricle edema rate was chosen as the dependent variable y and the whole data set of fingerprints after preprocessing as the independent variables X. The PLS model with two factors was retained for auricle edema rate with chromatograms by full cross-validation.
Figure 6B illustrated that the P2, P5, P20, P27 appeared greater negative contributions to anti-inflammatory activities, most of peaks appeared positive contributions to the anti-inflammatory activities and the magnitude of the 10 characteristic peaks that had close correlation with anti-inflammatory activities was: P15 > P19 > P6 > P11 > P18 > P12 > P10 > P22 > P24 > P13. The outcome nearly coincided with the results in PCR. Contrary to the result in PCR, the regression coefficient of P13 was correctly positive in the PLS model. Consequently, the interpretation and accuracy of the model established by PLS were described more clearly than Table 2. The calculated similarity values for 27 samples.
S16 S17 S18 S19 S20 S21 S22 S23 S24 S25 S26 S27 R
0.381 0.377 0.384 0.512 0.531 0.514 0.498 0.539 0.541 0.749 0.761 0.673 0.751
0.401 0.391 0.404 0.535 0.555 0.539 0.538 0.585 0.589 0.767 0.782 0.683 0.784
0.557 0.514 0.576 0.557 0.544 0.516 0.702 0.792 0.79 0.556 0.558 0.525 0.78
0.476 0.49 0.495 0.303 0.321 0.301 0.66 0.666 0.675 0.542 0.543 0.55 0.697
0.483 0.483 0.51 0.32 0.335 0.318 0.658 0.668 0.677 0.545 0.546 0.55 0.705
0.579 0.564 0.591 0.346 0.348 0.333 0.665 0.683 0.694 0.556 0.559 0.556 0.723
0.582 0.629 0.585 0.295 0.312 0.28 0.77 0.736 0.754 0.9 0.903 0.897 0.889
0.593 0.638 0.597 0.293 0.308 0.277 0.755 0.729 0.742 0.889 0.886 0.889 0.886
0.593 0.638 0.597 0.293 0.308 0.277 0.755 0.729 0.742 0.889 0.886 0.889 0.886
0.524 0.491 0.531 0.641 0.653 0.61 0.647 0.749 0.774 0.747 0.773 0.68 0.86
0.526 0.501 0.536 0.754 0.774 0.752 0.619 0.72 0.744 0.704 0.725 0.641 0.859
0.526 0.501 0.536 0.754 0.774 0.752 0.619 0.72 0.744 0.704 0.725 0.641 0.859
0.636 0.653 0.652 0.447 0.471 0.408 0.788 0.819 0.855 0.82 0.837 0.8 0.878
0.665 0.677 0.682 0.478 0.434 0.393 0.826 0.845 0.854 0.819 0.835 0.81 0.889
0.651 0.678 0.666 0.376 0.39 0.335 0.812 0.824 0.85 0.836 0.852 0.826 0.876
1 0.931 0.976 0.298 0.309 0.344 0.843 0.833 0.795 0.616 0.601 0.622 0.715
0.931 1 0.885 0.229 0.246 0.259 0.837 0.804 0.803 0.645 0.655 0.674 0.716
0.976 0.885 1 0.313 0.324 0.361 0.86 0.852 0.803 0.629 0.606 0.634 0.728
0.298 0.229 0.313 1 0.899 0.881 0.336 0.465 0.469 0.364 0.38 0.292 0.588
0.309 0.246 0.324 0.899 1 0.966 0.35 0.477 0.486 0.399 0.415 0.324 0.605
0.344 0.259 0.361 0.881 0.966 1 0.374 0.487 0.464 0.35 0.365 0.268 0.575
0.843 0.837 0.86 0.336 0.35 0.374 1 0.97 0.931 0.763 0.756 0.784 0.866
0.833 0.804 0.852 0.465 0.477 0.487 0.97 1 0.97 0.748 0.749 0.744 0.902
0.795 0.803 0.803 0.469 0.486 0.464 0.931 0.97 1 0.764 0.782 0.749 0.913
0.616 0.645 0.629 0.364 0.399 0.35 0.763 0.748 0.764 1 0.985 0.973 0.905
0.601 0.655 0.606 0.38 0.415 0.365 0.756 0.749 0.782 0.985 1 0.957 0.914
0.622 0.674 0.634 0.292 0.324 0.268 0.784 0.744 0.749 0.973 0.957 1 0.875
0.715 0.716 0.728 0.588 0.605 0.575 0.866 0.902 0.913 0.905 0.914 0.875 1
PCR. An advantage of PLS is that this technique not only looks for maximal variance in X (the chromatographic data) as PCR, but also considers the correlation between the chroma-tographic data (X) and the total capacity (y), which results in lower RMSE (0.1133) and RMSECV (0.1084) values than PCR. Overall, both PCR and PLS could be used to simulta-neously screen the main contributive peaks to the anti-inflammatory capability of TMX. PLS provided a more accurate spectrum-activity model than PCR revealed that the 10 characteristic peaks that had most closely correlation with anti-inflammatory capacity.
The anti-inflammatory effects of different samples also could be explained by the results of spectrum-efficacy
relationship. For example, 4 characteristic peaks (P6, P11, P15 and P22) which appeared positive contributions to anti-inflammatory capacity were not found in the fingerprints of samples 19–21, therefore, these samples had lowest anti-inflammatory activities. Also, the P22 didn’t exist in IR samples of Gannan and Tibet, so the anti-inflammatory activities of these samples were relatively low.
6. HPLC-MS-MS analysis of TMX
The TIC chromatograms of S7 by HPLC-MS-MS in negative and positive ESI mode were shown in Figure 7A. The constituents of TMX were well separated and identified by using their retention time and mass spectra. By comparing Figure 3.Hierarchical clustering dendrogram of the samples.
Figure 4.The score plot for thirty-one samples (A) and corresponding loading plot (B).
www.wjtcm.org 43 2016 | Vol. 2 | Issue 2
World J Tradit Chin Med 2016; 2(2): 36–47 X. Gaoet al
with their resolved spectra with the standard ones, 8 characteristic peaks which had close correlation with anti-inflammatory activities were identified. As a result, peak 6, 11, 12, 13, 15, 18, 22, 24 were identified as citric acid, quinic acid, caffeic acid-β-D-glucopyranoside, chlorogenic acid, caffeic acid, 1,3-O-dicaffeoyl quinic acid, tianshic acid and 3β-Hydroxypterondontic acid respectively. The chemical structures, mass spectra and possible fragmentation pathway of these 8 peaks were shown in Figure 7B. The anti-inflammatory activities of citric acid[42], quinic acid[43]and caffeic acid[44]were also reported in the literature.
CONCLUSIONS
In conclusion, a holistic method based on chemical char-acteristic and anti-inflammation effect was established to systematically evaluate the quality of twenty-seven TMX samples from different origins. An integrative outcome revealed that all samples were successfully classified. The results were in accord with the appraisal results of plant morphological. The results of the anti-inflammatory activities
showed that S7 from Kumbum Monastery of Qinghai exhibited significant anti-inflammatory capacity. Meanwhile, citric acid, quinic acid, caffeic acid-β-D-glucopyranoside, chlorogenic acid, caffeic acid, 1,3-O-dicaffeoyl quinic acid, tianshic acid and 3β-Hydroxypterondontic acid had signifi-cant positive correlation with anti-inflammatory activities by means of investigating spectrum-efficacy relationship, most of these active ingredients were phenolic acid compounds. These results were consistent with the reports that both of IH and IR contained abundant phenolic acid compounds[45], and phenolic acids compounds and their derivatives pro-cessed superior anti-inflammatory activities[46].
TCMs are mostly used in the clinic with aqueous extract. Alantolactone and isoalantolactone were not found in the aqueous extract of TMX. However, these two active ingre-dients were selected as chemical markers for the quality control of TMX in ChP 2015[3]. Thus, alantolactone and isoalantolactone may not be appropriate as the markers for the quality control of TMX associated with anti-inflammatory activities. According to our research, it is suggested that phenolic acid compounds and their derivatives can be selected Figure 5. The anti-inflammatory effects of 27 samples. Significant differences with blank group are designated as **P < 0.01.
Figure 7. The base peak chromatogram of S7(A,I); The total ion chromatograms (TIC) of S7 in negative ion mode (A,II); The total ion chromatograms (TIC) of S7 in positive ion mode (A, III); Chemical structures, mass spectra and possible fragmentation pathway of the compounds (B) (a, citric acid; b, quinic acid; c, caffeic acid-ß-D-glucopyranoside; d, chlorogenic acid; e, caffeic acid; f, 1,3-O-dicaffeoyl quinic acid; g, tianshic acid; h, 3ß-Hydroxypterondontic acid).
www.wjtcm.org 45 2016 | Vol. 2 | Issue 2
World J Tradit Chin Med 2016; 2(2): 36–47 X. Gaoet al
as the chemical markers for anti-inflammatory relevant quality assessment of TMX. Consequently, we should pay close attention to the variation of citric acid, quinic acid, caffeic acid-β-D-glucopyranoside, chlorogenic acid, caffeic acid, 1,3-O-dicaffeoyl quinic acid, tianshic acid and 3β -Hydroxypter-ondontic acid in the future quality control study of TMX associated with anti-inflammatory effect.
This comprehensive strategy was successfully used for identification of IH, IR and AL, which provided a reliable and adequate theoretical basis for formulating the bioactivity relevant quality standards and studying the material basis of anti-inflammatory effect of TMX, and provided a methodol-ogy reference for quality evaluation and analyzing related pharmacodynamic material basis of other TCMs.
ACKNOWLEDGEMENTS
The authors acknowledge the support of the Project of Science and Technology Agency of Gansu (1208RTZA211) and Science and Technology Agency of Lanzhou (2013-4-75) and the item of scientific and technological researches from Gansu province administration bureau of traditional Chinese medicine (GZK-2014-13).
Found:the Project of Science and Technology Agency of Gansu (1208RTZA211) and Science and Technology Agency of Lanzhou (2013-4-75) and the item of scientific and technological researches from Gansu province administration bureau of traditional Chinese medicine (GZK-2014-13).
REFERENCES
1. Zhang T, Gong T, Yang Y, Chen RY, Yu DQ. Two new eudesmano-lides from Inula racemosa and their bioactivities. Phytochemistry Letters2012, 5(2): 229–232.
2. Wang KT, Liu HT, Zhao YK, Chen XG, Hu ZD, Song YC, Ma X. Separation and determination of alantolactone and isoalantolactone in traditional Chinese herbs by capillary electrophoresis. Talanta 2000, 52(6): 1001–1005.
3. China Pharmacopoeia Committee. Pharmacopoeia of the People’s Republic of China (The first division).Beijing: ChinaMedical Science Pres 2015;16–17.
4. Alexenizer M, Dorn A. Screening of medicinal and ornamental plants for insecticidal and growth regulating activity.Journal of Pest Science 2007, 80(4): 205–215.
5. Qiu J, Luo M, Wang J, Dong J, Li H, Leng B, Zhang Q, Dai X, Zhang Y, Niu X, Deng X, Isoalantolactone protects against Staphylococcus aureus pneumonia,FEMS Microbiol Lett2011, 324(2):147–155. 6. Park EJ, Kim YM, Park SW, Kim HJ, Lee JH, Lee DU, Chang KC.
Induction of HO-1 through p38 MAPK/Nrf2 signaling pathway by ethanol extract of Inula helenium L. reduces inflammation in LPS-activated RAW 264.7 cells and CLP-induced septic mice.Food And Chemical Toxicology2013, 55: 386–395.
7. Liu CH, Mishra AK, Tan RX. Repellent, insecticidal and phytotoxic activities of isoalantolactone from Inula racemosa.Crop Protection 2006, 25(5): 508–511.
8. Seo JY, Lim SS, Kim JR, Lim JS, Ha YR, Lee IA, Kim EJ, Park JHY, Kim J-S. Nrf2-mediated induction of detoxifying enzymes by alantolactone present in Inula helenium. Phytotherapy Research 2008, 22(11): 1500–1505.
9. Dorn DC, Alexenizer M, Hengstler JG, Dorn A. Tumor cell specific toxicity of Inula helenium extracts. Phytotherapy Research 2006, 20(11): 970–980.
10. Jiang HL, Chen J, Jin XJ, Yang JL, Li Y, Yao XJ, Wu QX. Sesquiterpenoids, alantolactone analogues, and seco-guaiene from the roots of Inula helenium.Tetrahedron2011, 67(47): 9193–9198. 11. Ma YY, Zhao DG, Zhai Y, Li Y, Gao K.Trinorsesquiterpenoids from
Inula racemosa.Phytochemistry Letters2013, 6(4): 645–648. 12. Stojakowska A, Kędzia B, Kisiel W. Antimicrobial activity of
10-isobutyryloxy-8,9-epoxythymol isobutyrate.Fitoterapia2005, 76(7–8): 687–690.
13. Huo Y, Shi H, Li W, Wang M, Li X. HPLC determination and NMR structural elucidation of sesquiterpene lactones in Inula helenium. Journal Of Pharmaceutical And Biomedical Analysis 2010, 51(4): 942–946.
14. Pal HC, Sehar I, Bhushan S, Gupta BD, Saxena AK. Activation of caspases and poly (ADP-ribose) polymerase cleavage to induce apoptosis in leukemia HL-60 cells by Inula racemosa.Toxicology In Vitro2010, 24(6): 1599–1609.
15. Hakimzadeh N, Parastar H, Fattahi M. Combination of multivariate curve resolution and multivariate classification techniques for compre‐ hensive high-performance liquid chromatography-diode array absor-bance detection fingerprints analysis of Salvia reuterana extracts. Journal Of Chromatography A2014, 1326: 63–72.
16. Alaerts G, Matthijs N, Smeyers-Verbeke J, Vander Heyden Y. Chromatographic fingerprint development for herbal extracts: A screening and optimization methodology on monolithic columns. Journal Of Chromatography A2007, 1172(1): 1–8.
17. Gong F, Liang YZ, Fung YS, Chau FT. Correction of retention time shifts for chromatographic fingerprints of herbal medicines.Journal Of Chromatography A2004, 1029(1–2): 173–183.
18. Fan XH, Cheng YY, Ye ZL, Lin RC, Qian ZZ. Multiple chromatographic fingerprinting and its application to the quality control of herbal medicines.Analytica Chimica Acta2006, 555(2): 217–224. 19. Dong HJ, Zhang ZJ, Yu J, Liu Y, Xu FG. Chemical Fingerprinting of
Andrographis paniculata (Burm. f.) Nees by HPLC and Hierarchical Clustering Analysis. Journal Of Chromatographic Science 2009, 47(10): 931–935.
20. Yudthavorasit S, Wongravee K, Leepipatpiboon N. Characteristic fingerprint based on gingerol derivative analysis for discrimination of ginger (Zingiber officinale) according to geographical origin using HPLC-DAD combined with chemometrics. Food Chemistry 2014, 158: 101–111.
21. Shi ZQ, Song DF, Li RQ, Yang H, Qi LW, Xin GZ, Wang DQ, Song HP, Chen J, Hao H, Li P. Identification of effective combinatorial markers for quality standardization of herbal medicines.Journal Of Chromato‐ graphy A2014, 1345: 78–85.
22. Kong WJ, Zhao YL, Shan LM, Xiao XH, Guo WY. Investigation on the spectrum-effect relationships of EtOAc extract from Radix Isatidis based on HPLC fingerprints and microcalorimetry.Journal Of Chro-matography B2008, 871(1): 109–114.
23. Han XH, Zhong J, Guo JY, Shi R, Wang XH, Wang CH, Wang K, Du GL, Shen YH, Ma YM. Relationships between pharmacokinetics and efficacy of Xie-xin decoction in rats with experimental ulcerative colitis.Journal Of Ethnopharmacology2013, 148(1): 182–189. 24. Zheng Q, Zhao Y, Wang J, Liu T, Zhang B, Gong M, Li J, Liu H, Han B,
Zhang Y, Song X, Li Y, Xiao X. Spectrum-effect relationships between UPLC fingerprints and bioactivities of crude secondary roots of Aconitum carmichaelii Debeaux (Fuzi) and its three processed products on mitochondrial growth coupled with canonical correlation analysis. Journal Of Ethnopharmacology2014, 153(3): 615–623. 25. Shan SM, Luo JG, Huang F, Kong LY. Chemical characteristics
combined with bioactivity for comprehensive evaluation of Panax ginseng C.A. Meyer in different ages and seasons based on HPLC-DAD and chemometric methods. Journal Of Pharmaceutical And Biomedical Analysis2014, 89: 76–82.
27. Ahmed AF, Kuo YH, Dai CF, Sheu JH. Oxygenated Terpenoids from a Formosan Soft Coral Sinularia gibberosa.Journal Of Natural Products 2005, 68(8): 1208–1212.
28. Alaerts G, Van Erps J, Pieters S, Dumarey M, van Nederkassel AM, Goodarzi M, Smeyers-Verbeke J, Vander Heyden Y. Similarity analyses of chromatographic fingerprints as tools for identification and quality control of green tea.Journal Of Chromatography B2012, 910: 61–70.
29. Zhu H, Wang C, Qi Y, Song F, Liu Z, Liu S. Fingerprint analysis of Radix Aconiti using ultra-performance liquid chromatography–electro‐ spray ionization/ tandem mass spectrometry (UPLC–ESI/MSn) com-bined with stoichiometry.Talanta2013, 103: 56–65.
30. Xu CJ, Liang YZ, Chau FT, Heyden YV. Pretreatments of chromato-graphic fingerprints for quality control of herbal medicines.Journal Of Chromatography A2006, 1134(1–2): 253–259.
31. Lu HM, Liang YZ, Chen S. Identification and quality assessment of Houttuynia cordata injection using GC–MS fingerprint: A standardiza‐ tion approach. Journal Of Ethnodshypharmacology 2006, 105(3): 436–440.
32. Goodarzi M, Russell PJ, Vander Heyden Y. Similarity analyses of chromatographic herbal fingerprints: A review. Analytica Chimica Acta2013, 804: 16–28.
33. Kim S, Kim K, Han C, Ki K, Min K, Zhang X, Whang W. Simultaneous analysis of six major compounds in Osterici Radix and Notopterygii Rhizoma et Radix by HPLC and discrimination of their origins from chemical fingerprint analysis.Archives Of Pharmacal Research2012, 35(4): 691–699.
34. Keithley RB, Mark Wightman R, Heien ML. Multivariate concentration determination using principal component regression with residual analysis. TrAC Trends in Analytical Chemistry 2009, 28(9): 1127–1136.
35. Li W, Cheng Z, Wang Y, Qu H. Quality control of Lonicerae Japonicae Flos using near infrared spectroscopy and chemometrics.Journal Of Pharmaceutical And Biomedical Analysis2013, 72: 33–39. 36. Dönmez ÖA, As¸c¸ıB, Bozdoğan A, Sungur S. Simultaneous
determina-tion of potassium guaiacolsulfonate, guaifenesin, diphenhydramine HCl and carbetapentane citrate in syrups by using HPLC-DAD coupled with partial least squares multivariate calibration.Talanta2011, 83(5): 1601–1605.
37. Lucio-Gutiérrez JR, Garza-Juárez A, Coello J, Maspoch S, Salazar-Cavazos ML, Salazar-Aranda R, Waksman de Torres N. Multi-wavelength high-performance liquid chromatographic fingerprints
and chemometrics to predict the antioxidant activity of Turnera diffusa as part of its quality control.Journal Of Chromatography A 2012, 1235: 68–76.
38. Mallavadhani UV, Narasimhan K, Sudhakar AVS, Mahapatra A, Li W, Breemen RBv. Three New Pentacyclic Triterpenes and Some Flavo-noids from the Fruits of an Indian Ayurvedic Plant Dendrophthoe falcata and Their Estrogen Receptor Binding Activity.Chemical and Pharmaceutical Bulletin2006, 54(5): 740–744.
39. Uarrota VG, Moresco R, Coelho B, Nunes EdC, Peruch LAM, Neubert EdO, Rocha M, Maraschin M. Metabolomics combined with chemo-metric tools (PCA, HCA, PLS-DA and SVM) for screening cassava (Manihot esculenta Crantz) roots during postharvest physiological deterioration.Food Chemistry2014, 161(67–78).
40. Shin HS, Satsu H, Bae M-J, Zhao Z, Ogiwara H, Totsuka M, Shimizu M. Anti-inflammatory effect of chlorogenic acid on the IL-8 produc-tion in Caco-2 cells and the dextran sulphate sodium-induced colitis symptoms in C57BL/6 mice.Food Chemistry2015;168: 167–175. 41. Dumarey M, van Nederkassel AM, Deconinck E, Vander Heyden Y.
Exploration of linear multivariate calibration techniques to predict the total antioxidant capacity of green tea from chromatographic finger‐ prints.Journal Of Chromatography A2008;1192(1): 81–88. 42. Tang X, Liu J, Dong W, Li P, Li L, Lin C, Zheng Y, Hou J, Li D, The
Cardioprotective Effects of Citric Acid and L-Malic Acid on Myocardial Ischemia/Reperfusion Injury.Evid Based Complement Alternat Med 2013, 2013:820695.
43. Zeng K, Thompson KE, Yates CR, Miller DD. Synthesis and biological evaluation of quinic acid derivatives as anti-inflammatory agents. Bioorganic & Medicinal Chemistry Letters2009, 19(18): 5458–5460. 44. Búfalo MC, Ferreira I, Costa G, Francisco V, Liberal J, Cruz MT, Lopes MC, Batista MT, Sforcin JM. Propolis and its constituent caffeic acid suppress LPS-stimulated pro-inflammatory response by blocking NF-κB and MAPK activation in macrophages.Journal Of Ethnopharmacol-ogy2013, 149(1): 84–92.
45. Konishi T, Shimada Y, Nagao T, Okabe H, Konoshima T. Antiproli-ferative Sesquiterpene Lactones from the Roots of Inula helenium. Biological and Pharmaceutical Bulletin2002, 25(10): 1370–1372. 46. Sala E, Guasch L, Iwaszkiewicz J, Mulero M, Salvadó M-J, Bladé C,
Ceballos M, Valls C, Zoete V, Grosdidier A, Garcia-Vallvé S, Michielin O, Pujadas G. Identification of human IKK-2 inhibitors of natural origin (Part II): In Silico prediction of IKK-2 inhibitors in natural extracts with known anti-inflammatory activity.European Journal Of Medic-inal Chemistry2011, 46(12): 6098–6103.
www.wjtcm.org 47 2016 | Vol. 2 | Issue 2
World J Tradit Chin Med 2016; 2(2): 36–47 X. Gaoet al