RevistaBrasileiradeFarmacognosia25(2015)513–521
w w w . s b f g n o s i a . o r g . b r / r e v i s t a
Original
Article
Response
Surface
Methodology
IV-Optimal
design
applied
to
the
performance
improvement
of
an
RP-HPLC-UV
method
for
the
quantification
of
phenolic
acids
in
Cecropia
glaziovii
products
André
O.
Beringhs,
Milene
Dalmina,
Tânia
B.
Creczynski-Pasa,
Diva
Sonaglio
∗DepartamentodeCiênciasFarmacêuticas,CentrodeCiênciasdaSaúde,UniversidadeFederaldeSantaCatarina,Florianópolis,SC,Brazil
a
r
t
i
c
l
e
i
n
f
o
Articlehistory:
Received5May2015 Accepted26May2015 Availableonline19June2015
Keywords:
RP-HPLC-UVmethod ResponseSurfaceMethodology
Cecropiaglaziovii
Vegetalextract Chlorogenicacid Caffeicacid
a
b
s
t
r
a
c
t
ChlorogenicandcaffeicacidsarebioactivephenoliccompoundspresentinCecropiaglazioviiSnethl.,
Urticaceae,productsthathavebeenusedasanalyticalmarkers.Thispaperreportsachemometricstudy
aimedatimprovingchromatographicperformanceforquantificationofthesemarkersbyRP-HPLC.The
organictoaqueouscontentratio,theacidcontentofthemobilephase,andtheelutionmethodwere
ana-lyzedusingaResponseSurfaceMethodologyIV-Optimaldesign.Theresolutionbetweenpeaks,retention
time,tailingandretentionfactors,numberoftheoreticalplatesandpeakwidthswereevaluated.The
opti-mizedconditionsweremathematicallydeterminedas(A)trifluoroaceticacid0.05%(v/v),(B)12%(v/v)
acetonitrileand(C)increasinggradient.Themethodwasconsideredspecific,fast,precise,reliableand
linearintherangesof1.0–200.0and2.5–100.0g/mlforthechlorogenicandcaffeicacids,respectively.
TheadequateconditionstoseparateandquantifybothphenolicacidsinC.glazioviiproductswere
demon-strated.Satisfactoryresolutionwasachievedwhencomparedtoapreviouslypublishedchromatographic
methodwhichisunabletoseparatethechlorogenicacidandaninterferingcompoundpresentedunder
certainextractiveconditions,demonstratingtheimportanceofsystematicstudies,specificallywhen
analyzingcomplexplantmatrices.
©2015SociedadeBrasileiradeFarmacognosia.PublishedbyElsevierEditoraLtda.Allrightsreserved.
Introduction
Cecropia glaziovii Snethl., Urticaceae, a plant species
popu-larlyknownas“embaúba”,iswidelydistributedintheBrazilian AtlanticForest, andhasbeenused infolk medicineasan anti-hyperlipidemicandhypotensiveagent(LorenziandMatos,2008; Silvaetal.,2010).Overthepastfewyears,ithasbeenverifiedthat
C.glazioviihasactivityasahypotensive(Ninahuamanetal.,2007), antiasthmatic (Delarcina Jr. et al., 2007), anxiolytic-like (Rocha et al.,2002)and antidepressant-like(Rochaet al.,2007)agent. Duetotheseoutstandingbiologicalactivities,researcheshavebeen carriedouttargetingatthedevelopmentofproductscontaining standardizedextractsofC.glazioviiforpharmaceuticalpurposes (Arendetal.,2011;Beringhsetal.,2013;Santos,2012).This grow-inginterestisassociatedwithanincreasingneed,intheacademic andindustrialareas,foranalyticalmethodstoquantifytheactive compoundspresentinpharmaceuticalsderivedfromC.glaziovii.
∗ Correspondingauthor.
E-mail:[email protected](D.Sonaglio).
Of the compounds which can be extracted from C. glaziovii
leaves,phenolicsconstitutethemajorbiologicallyactive compo-nents. The chlorogenic (3-caffeoylquinic acid; CGA) and caffeic (3,4-dihydroxycinnamicacid;CFA)acidsarepresentinsignificant quantitiesinCecropiagenusextracts(Arendetal.,2011),andare involved in severalbiological activitiesattributedtoC. glaziovii
(Bouayedetal.,2007;Choetal.,2010;Ongetal.,2013;Takeda etal.,2002).Forthisreason,CGAandCFAhavebeenwidelyused aschemicalmarkersforthisspecies.However,duetotheir chemi-calsimilarity,thesephenoliccompoundscommonlyeluteinclose proximity(Arendetal.,2011),whichcreatesdifficultiesin devel-opingchromatographicmethods.Inaddition,severalsubstances extractedconcurrentlymayalsointerfereinthequantificationof CGAandCFA.Forthisreason,specialattentionshouldbegivento productsofplantoriginduetotheirchemicalcomplexity.Arend etal.(2011)describedthedevelopmentofanRP-HPLCmethodfor thequantificationofthesechemicalmarkers.However,werecently noticedthepresenceofaninterferingcompoundundernew extrac-tiveconditions,andthismethodhasprovedtobeunabletoseparate itfromCGA.Asresult,itcouldleadtoanoverestimated quantifica-tionofCGA.Forthisreason,amultivariateapproachtoimproving
http://dx.doi.org/10.1016/j.bjp.2015.05.007
theperformanceofchromatographicmethodswasadoptedinthis study.
TheResponseSurfaceMethodology(RSM)(Antony,2014;Myers etal.,2009)experimentaldesignusingtheIV-Optimalalgorithm wasappliedasachemometrictooltodeterminetheinfluenceof chromatographicconditionsonvariousqualityparameters.RSMis amultivariatetechniquethatusesasetofmathematicaland statis-ticaltoolstodeterminehowdifferentfactorsinfluenceresponses onadataset.Thistechniqueallowsthefittingofapolynomial equa-tiontotheexperimentaldata(Myersetal.,2009).Italsoenablesthe extrapolationofamathematicalmodeltoperformpredictionsand detectwhichfactors,andtheirpossibleinteractions,mayinfluence thedifferentexperimentalresponses.
Materialsandmethods
Materialsandchemicalreagents
The materials were obtained from the following sources: chlorogenic(CGA; 3-caffeoylquinicacid)and caffeicacids (CFA; 3,4-dihydroxycinnamic acid) (Sigma–Aldrich, USA), HPLC-grade methanol and acetonitrile (J.T. Baker, USA), trifluoracetic acid (Vetec,Brazil),andethanol(Labsynth,Brazil).
Rawplantmaterial
DriedleavesofCecropiaglazioviiSnethl.,Urticaceae,were pur-chasedfromthePluridisciplinaryCenterofChemical,Biologicaland AgronomicStudies(CPQBA)attheUniversidadeEstadualde Cam-pinas,Brazil.ThevoucherspecimenwasdepositedattheCPQBA herbarium,undernumber 78.Also, C.glazioviileaveswere ran-domlycollected from six different geographic locations within SouthAmerica,asfollows:S1(Florianópolis–Brazil;27◦42′33.7′′S
48◦33′35.6′′W),S2(Garopaba–Brazil;28◦01′18.3′′S48◦41′55.8′′
W),S3(Itanhaém–Brazil;28◦01′18.3′′S48◦41′55.8′′W),S4(São
Paulo–Brazil;23◦26′30.2′′S46◦39′15.1′′W),S5(RiodeJaneiro–
Brazil;22◦54′54.9′′S43◦20′10.6′′W)andS6(Misiones–Argentina;
26◦16′35.5′′S53◦43′00.5′′W).Theplantmaterialwasgroundina
knifemill(3.0mmmash;Macmont)priortouse.
Chromatographicconditions
ThechromatographicanalysiswasperformedonaPerkinElmer highperformanceliquidchromatographysystemcomprisingthe followingmodules:Series200Autosampler,binarypumpand vac-uumdegasserandSeries600LINKinterface.TheUV–Visdetector (Series200) wasusedas themain detector due toits reduced costwhen comparedwiththephotodiodearraydetector (PDA) (Flexar).Unlessotherwisespecified,thedetectorwavelengthwas setat330nm(highestabsorbancesignalofCGAandCFA concomi-tantly).Thestationary phasewasa LunaC18(2) column(5m, 150.0×4.6mm,100 ˚A;Phenomenex,USA).Theinjectionvolume was20.0landtheflowrateofthemobilephasewas1.0ml/min. Allanalyseswereperformedintriplicate.
Designofexperiments
A Response Surface Methodology (RSM) IV-Optimal design wassetuptominimizetheintegratedpredictionvarianceacross thedesign space(Myersetal.,2009).Atotal of22experiments werecarriedoutandtheresponseswerecollectedbasedonthe chromatogramsobtained.Thefactorsanalyzedweretheacid con-centrationintheaqueousportionofthemobilephase,theorganic to aqueous solvent ratio in the mobile phase, and the elution methods. The binary mobile phases were comprised of differ-entproportionsoftrifluoraceticacid(TFA)aqueoussolution,an
Table1
Experimentaldomaininvestigated(factorsandrespectivelevels).
Levels Numericcontinuousfactors Categoricnominalfactor
A–TFA concentration (%;v/v)
B–ACN: TFA
C–elutionmethod
Low(−1) 0.01 12:88 Isocratic(ISO)
Centerpoint(0) 0.05 14:86 Increasinggradient(IG)
High(+1) 0.10 16:84 Decreasinggradient(DG)
acidifieragent at severaldifferent concentrations, and acetoni-trile(ACN).Theelutionmethodwasevaluatedasisocratic(ISO), increasinggradient(IG)ordecreasinggradient(DG).The experi-mentaldomainisdescribed inTable1.Theelutionmethodwas onlyemployedduringthefirst12minaftersampleinjection.Next,a cleansinggradientwasusedtoelutetheremainingsubstances.The baselineprogramwasan11:89ACN:TFAratioforallexperiments. Regressionanalysisofthedatawascarriedout(Design-Expert®, Version8.0.7.1,StatEaseInc.,USA).Analysisofvariance(ANOVA) wasperformedtoidentifythesignificanceofsinglefactors,binary interactionsandquadratictermsinrelationtotheirinfluenceon theresponsesanalyzed.Eachfactorwasconsideredtobesignificant whenthepvaluewas<0.05.
Chromatographicsystemsuitabilityparameters
Theresponsesanalyzedinthisstudywereretentiontime(RT), numberoftheoreticalplates(NTP),tailingfactor(TF),peakwidth (W)andretentionfactor(k′)forbothCGAandCFA,aswellasthe
resolutionbetweenCGAandtheinterferingpeak(RsCGA-I).Allthese suitabilityparameterswerecalculatedandinterpretedaccordingto theUSFoodandDrugAdministration(FDA)guidelines(FDA,1994; Neue,2005).
Chemometricoptimizationofthechromatographicmethod
Theoptimumconditionsweredeterminedbythedesirability function(Myersetal.,2009),andexperimentswereperformedto confirmtherobustnessofthepredictedmodelunderoptimal con-ditions.Thesimultaneousobjectivefunctionisageometricmean ofalltransformedresponses,andiscalculatedasfollows(Antony, 2014):
D=(d1×d2×...×dn)1/n=
n
i=1di
1
/n(1)
whereDisthedesirabilityfunction,diisthedesirabilityrangesfor eachresponse,andnisthenumberofresponsesinthe measure-ment.
Validationofthechromatographicmethod
A.O.Beringhsetal./RevistaBrasileiradeFarmacognosia25(2015)513–521 515
Table2
Meanresponsesobtainedforchlorogenicandcaffeicacidsfromtheexperimentaldesignforretentiontime(RT),retention(k′)andtailingfactors(TF),peakwidth(W),number oftheoreticalplates(NTP),andresolutionbetweenCGAandinterferingpeak(RsCGA-I).
Run Factors Responses
A–TFA (%;v/v)
B–ACN (%;v/v)
C–elution method
Chlorogenicacid(CGA) Caffeicacid(CFA)
RT(min) k′ TF W NTP Rs
CGA-I RT(min) k′ TF W NTP
#1 0.06 13.0 DG 7.488 2.200 1.051 0.700 1830 1.409 11.451 3.839 1.022 0.646 5027
#2 0.01 12.0 IG 7.363 1.821 0.995 0.677 1892 1.605 11.473 3.395 0.795 0.720 4063
#3 0.02 12.0 DG 7.559 1.852 0.935 1.070 798 1.434 11.459 3.324 0.970 0.683 4504
#4 0.01 14.0 ISO 6.205 1.332 0.831 0.590 1769 1.097 8.994 2.381 1.021 0.580 3847
#5 0.10 16.0 IG 8.603 2.162 1.194 0.867 1575 1.490 11.864 3.361 1.075 0.643 5447
#6 0.06 14.0 IG 8.254 2.161 1.085 0.864 1460 1.629 12.238 3.688 1.067 0.700 4890
#7 0.10 14.0 ISO 6.083 1.244 1.351 0.500 2368 1.045 8.665 2.197 1.037 0.699 2459
#8 0.06 12.0 ISO 8.002 2.031 1.285 0.769 1732 1.542 12.132 3.595 1.072 0.654 5506
#9 0.05 16.0 ISO 6.175 1.356 0.938 0.424 3393 0.946 8.740 2.335 1.128 0.601 3395
#10 0.01 16.0 IG 7.976 1.932 0.954 1.279 622 1.371 12.359 3.543 0.935 0.503 9659
#11 0.10 14.0 ISO 6.223 1.384 1.304 0.420 3512 0.946 8.802 2.372 1.059 0.678 2696
#12 0.06 15.0 DG 6.355 1.407 0.914 0.450 3190 1.276 9.358 2.544 1.098 0.415 8135
#13 0.06 14.0 IG 8.365 2.008 1.130 0.920 1322 1.449 12.435 3.473 1.100 0.726 4694
#14 0.10 12.0 DG 7.052 1.500 1.133 0.655 1854 1.364 10.631 2.769 0.904 0.508 7007
#15 0.01 14.0 ISO 6.223 1.357 0.821 0.580 1841 1.108 8.996 2.407 1.016 0.520 4789
#16 0.10 16.0 DG 5.664 1.420 0.794 0.305 5517 0.910 7.797 2.332 0.896 0.398 6141
#17 0.06 12.0 ISO 7.843 2.051 1.256 0.817 1474 1.440 12.082 3.701 1.021 0.678 5081
#18 0.06 14.0 IG 8.749 2.326 1.144 0.849 1699 1.680 12.670 3.817 1.096 0.673 5670
#19 0.06 12.0 IG 8.012 1.861 1.136 0.659 2365 1.956 12.012 3.290 0.959 0.744 4171
#20 0.01 16.0 ISO 5.299 1.061 0.741 0.497 1818 0.811 7.301 1.840 1.106 0.458 4066
#21 0.01 15.0 DG 6.029 1.318 0.854 0.485 2472 0.870 8.759 2.367 1.051 0.450 6058
#22 0.10 12.0 IG 6.749 1.884 1.239 0.451 3582 1.166 9.386 3.011 0.982 0.546 4728
ofthesameconcentrations(2.5,50and100g/ml)over3days,and
theresultswerealsoexpressedaspercentagesandRSD.The recov-eryandselectivity(FDA,1994,2003)wereascertainedasindicated inthenextsubsection.
PreparationofC.glazioviidryextracts
QuantificationofthephenolicsCGAandCFAwasperformedfor differentC.glazioviidriedproducts.Recoverywasdeterminedby addingmeasuredamountsofCGAandCFAtotheC.glazioviiextracts withknownconcentrationsofeachchemicalmarkeranditwas calculatedasthepercentageoftheextraamountofCGAandCFA foundinthesamples,comparedtotheamountadded.
The extractive solution #1 was prepared by a maceration method (Beringhs et al., 2013). The CPQBA plantmaterial was maceratedatroomtemperatureforthreedays(18gofplant mate-rialper100mlof27◦GLethanol).Thesuspensionwasfilteredto
obtainliquid extractive solution#1.Theextractive solution#2 waspreparedbytheshearextractionmethod,usingahigh per-formancedisperserdevice(Ultra-Turrax®T-25,IKA,USA)coupled toadispersingtool (S20-25NK-19G,IKA,Germany)at6500rpm for10min(statordiameter=19.0mm;rotordiameter=12.7mm; gapbetweenrotorandstator=0.3mm).Inthiscase,CPQBAplant material(5.0g)wassubmergedin100mlofa80◦GLethanol
solu-tionandsubmittedtotheultra-homogenizationprocess,andthe resultingsuspensionwasfilteredunderreducedpressuretoobtain liquidextractivesolution#2.
Resultingextractivesolutions(#1and#2)wereconcentrated undervacuum(MA-120,Marconi,Brazil)andfreeze-driedfor48h (LD1500,Terroni,Brazil)togivethedriedextractsDE#1andDE#2, respectively.ThepreparationoftheextractsamplesforHPLC anal-ysisconsistedofthedissolutionofknownamountsofeachDEina methanolsolutioninwater(1:1ratio;v/v).Inordertodemonstrate theabilityofthismethodtoseparatetheCGAandtheinterfering compound,whencomparedtoanothermethod,bothextractswere alsoquantifiedemployingthemethodpublishedbyArendetal. (2011).
DE#3,4,5,6,7and8werepreparedusingC.glazioviiplant sam-plesfromdifferentgeographicregionswithinSouthAmerica(see
Rawplantmaterialsection)inordertodemonstratetheselectivity
ofthemethod.Theseextractswerepreparedbyshearextraction followedbyfreeze-drying,asdescribedforDE#2.
Results
Chemometricanalysis
Thevalues for allthe responsesobtainedfordifferent chro-matographic conditions are shown in Table 2. The results for thestatisticalanalysis relatedtoCGA and CFAaredescribed in Tables 3 and 4,respectively. For thecategorical nominalfactor (elutionmethod),twocoefficientsareprovidedduetotheneedto usemultiplecoefficientsassociatedwithmulti-levelfactors. Ade-quateprecisionswereconsideredindicativeofanadequatesignal tonoiseratio(Myersetal.,2009).Themaximumabsorptionsignal showednosignificantchange(p>0.05)whenanalyzedunderall theproportionsofmobilephaseandTFAconcentrationsstudied.
Factorsinfluencingtheretentiontimeandfactor
A.O.
Beringhs
et
al.
/
Revista
Brasileira
de
Farmacognosia
25
(2015)
513–521
Table3
Analysisofvariance(regressioncoefficientsandsignificantpvalues)fortheresponsesobtainedforchlorogenicacid.
Polynomialterm Responsesforchlorogenicacid
RT(min)1 k′1 TF2 W1a NTP2a Rs
CGA-I1
Coefficient pvalue Coefficient pvalue Coefficient pvalue Coefficient pvalue Coefficient pvalue Coefficient pvalue
Model – <0.0001 – <0.0001 – <0.0001 – <0.0001 – <0.0001 – <0.0001
Intercept 7.51 – 1.87 – 1.04 – –0.40 – 7.59 – 1.41 –
(A)TFA −0.027 0.5639 0.017 0.7912 0.14 <0.0001 −0.17 <0.0001 0.34 <0.0001 −0.025 0.5756
(B)ACN −0.38 <0.0001 −0.14 0.0325 −0.097 <0.0001 −0.14 0.0002 0.16 0.0227 −0.17 0.0021
(C)Elutionmethod −0.44/0.95 <0.0001 −0.09/0.31 0.0001 −0.11/0.06 <0.0001 −0.13/0.26 <0.0001 0.14/−0.25 0.0018 −0.07/0.23 0.0005
AB 0.22 0.0062 – – −0.031 0.0587 – – – – – –
AC – – – – −0.09/0.02 <0.0001 – – – – – –
BC −0.49/0.97 <0.0001 −0.08/0.28 0.0020 −0.02/0.07 0.0011 −0.30/0.45 <0.0001 0.47/−0.63 <0.0001 – –
A2 −0.75 <0.0001 −0.28 0.0024 – – −0.12 0.0022 – – −0.23 0.0056
B2 – – – – – – – – – – – –
R2 0.9817 0.8687 0.9736 0.9756 0.9272 0.7969
AdjustedR2 0.9704 0.8030 0.9537 0.9634 0.9121 0.7334
PredictedR2 0.9469 0.6554 0.7955 0.9354 0.8554 0.5729
Adeq.precision 28.671 11.534 23.279 36.589 26.691 11.242
Processorder=1Quadraticor2twofactorinteraction(2FI). aNaturallogtransformation(k=0).
Table4
Analysisofvariance(regressioncoefficientsandsignificantpvalues)fortheresponsesobtainedforcaffeicacid.
Polynomialterm Responsesforcaffeicacid
RT(min)1 k′1 TF1 W1 NTP2a
Coefficient pvalue Coefficient pvalue Coefficient pvalue Coefficient pvalue Coefficient pvalue
Model – <0.0001 – <0.0001 – <0.0001 – <0.0001 – 0.0002
Intercept 11.14 – 3.25 – 1.09 – 0.63 – 8.50 –
(A)TFA −0.31 0.0015 −0.080 0.2367 0.013 0.1159 0.008 0.2561 −0.089 0.0207
(B)ACN −0.85 <0.0001 −0.32 0.0017 0.051 <0.0001 −0.062 0.0005 0.038 0.2094
(C)Elutionmethod −0.58/1.42 <0.0001 −0.12/0.46 0.0001 −0.018 0.0028 −0.08/0.05 0.0002 0.22/0.088 <0.0001
AB 0.26 0.0225 – – −0.027 0.0174 0.069 0.0010 −0.18 0.0061
AC 0.19/−0.34 0.0280 – – −0.064/0.069 <0.0001 −0.04/−0.02 0.0134 0.17/−0.016 0.0195
BC −0.78/1.63 <0.0001 −0.14/0.50 0.0003 – – −0.07/0.02 0.0102 0.11/0.21 0.0004
A2 −1.30 <0.0001 −0.49 0.0006 −0.090 <0.0001 −0.056 0.0136 – –
B2 – – – – −0.036 0.0179 – – – –
R2 0.9882 0.9011 0.9379 0.9242 0.8867
AdjustedR2 0.9776 0.8517 0.8913 0.8553 0.8017
PredictedR2 0.9188 0.7451 0.7245 0.5895 0.6404
Adeq.precision 29.015 12.952 19.342 11.901 12.583
A.O.Beringhsetal./RevistaBrasileiradeFarmacognosia25(2015)513–521 517
16.0 5.5
6 6.5
7
6
8.5
5.5
6.5
6
7
7.5
8 9
10
11
12 6
7.5 8
13 9
10
11
12 8
12
11
10 7.5
7.5
15.0
14.0
13.0
12.0
0.01 0.03 0.06 0.08
a
d
b
e
c
f
0.10
16.0 CGA Retention time
CFA Retention time
TFA concentration (%; v/v)
ACN in mobile (%; v/v)
15.0
14.0
13.0
12.0
0.01 0.03 0.06 0.08 0.10 16.0
15.0
14.0
13.0
12.0
0.01 0.03 0.06 0.08 0.10
16.0
15.0
14.0
13.0
12.0
0.01 0.03 0.06 0.08 0.10 16.0
15.0
14.0
13.0
12.0
0.01 0.03 0.06 0.08 0.10 16.0
15.0
14.0
13.0
12.0
0.01 0.03 0.06 0.08 0.10
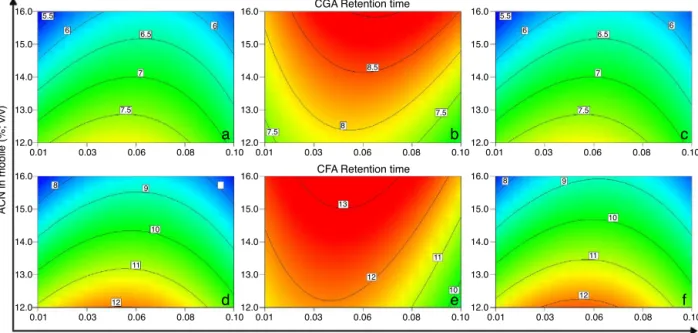
Fig.1.Contourgraphsofretentiontimesforchlorogenicacid(CGA)andcaffeicacid(CFA)withthe(a/d)isocratic,(b/e)increasinggradientand(c/f)decreasinggradient elutionmethods,respectively.
forCFA(Table4;Fig.1,secondline).TheRSMresultsshowedthat theuseofdifferentgradient elutionmethods(DG orIG) ledto differentintensitiesintheresponses.Theretentionfactors(k′)of
bothCGAandCFAshowedthesamebehaviorastheretentiontime (Tables3and4),sincethisfactorprovidesanestimateofthe dis-tancebetweenthemaximumsignalofthepeakandthevoidvolume ofthechromatographicrun.
Factorsinfluencingthetailingfactor
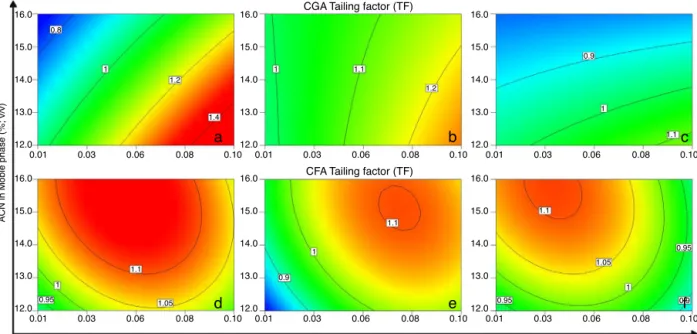
Thetailingfactor(TF)forCGA(Fig.2,firstline)wasclearly influ-encedbytheTFAconcentration(A)inthethreeelutionmethods. PeaksofsymmetricalGaussianshapewerefoundintherangeof 0.9–1.1(idealTF=1.0).RegardingtheCGA,aninteractionbetween theTFAandelutionmethod(interactionAC,p<0.0001;Table3)was observed.TheACNandtheelutionmethodincombination (inter-actionBC,p=0.0011;Table3)alsohadanimportantinfluenceon theTFvalue.Underisocraticconditions(Fig.2a),peaksymmetry wasfoundwhenTFAwasusedintherangeof0.01–0.08%(v/v), increasingproportionallytotheincreaseinACN.Underan increas-inggradient(Fig.2b),lowconcentrationsofTFA(0.01–0.06%,v/v) providedgoodsymmetryforallACNproportions.Thedecreasing gradient(Fig.2c)ledtopeaksymmetryintherangeof0.03–0.08% TFA(v/v)and12–14%ACN(v/v).
WhenanalyzingthetailingfactorforCFA,thequadraticfactor wassignificantforTFA(A2,p<0.0001;Table4),characterizedby aparabolicresponsethatachievingaplateau(Fig.2,secondline). However,theidealTFAconcentrationisdependentontheother twofactors(interactionsAB,p=0.0174andAC,p<0.0001;Table4). Peaksymmetrycouldbeachievedwiththethreeelution meth-ods(Fig.2d–f)bycombiningadequateconcentrationsofTFAwith suitableACNproportions.
Thewidth(W)forbothchemicalmarkersshowedsimilarresults tothatobservedforthetailingfactors(Tables3and4).
Factorsinfluencingthenumberoftheoreticalplates
The NTP for CGA was dependent on TFA concentration (A,
p<0.0001,Table3)andthecombinationbetweenACNandelution
method(BC,<0.0001,Table3).TheNTPincreasedasthe propor-tionofACNincreasedinboth isocraticanddecreasinggradient. Underincreasinggradient,theresponsetotheproportionofACN wasinverted(higherconcentrationsledtolowerNTP)duetoan increaseinthegradientinclination.TheTFAconcentration(A)had apositiveinfluence,promotingaslightincreaseintheNTPofCGA withallelutionmethods,duetothesuppressionofsecondary inter-actionsbetweenthecolumnandtheanalyte.
ForCFA,low concentrationsofTFAand ACN(interaction AB,
p=0.0061; Table 4) improvedthe NTP under isocratic elution. Whenincreasinganddecreasinggradientswereused,high con-centrationsofACNledtohigherNTP(interactionBC,p=0.0004; Table 4). With isocratic and increasing gradient methods, an increase in theTFA concentration(A) reduced theNTP. On the otherhand,underdecreasinggradienttheNTPincreasedasthe TFAconcentrationincreased(interactionAC,p=0.0195;Table4).
Factorsinfluencingtheresolutionbetweenpeaks
16.0
15.0
0.8
1
1.2
1.4
1 1.1
1.2
0.9
1.1
0.95
0.9 1
0.95 0.9
1
1.1
1.1
1.05 0.95
1
1.05 1.1
1
14.0
13.0
12.0
ACN in Moble phase (%; v/v)
0.01 0.03 0.06 0.08 0.10
16.0 CGA Tailing factor (TF)
TFA concentratration (% v/v) CFA Tailing factor (TF)
15.0
14.0
13.0
12.0
0.01 0.03 0.06 0.08 0.10 16.0
15.0
14.0
13.0
12.0
0.01 0.03 0.06 0.08 0.10
16.0
15.0
14.0
13.0
12.0
0.01 0.03
a
b
c
d
e
f
0.06 0.08 0.10 16.0
15.0
14.0
13.0
12.0
0.01 0.03 0.06 0.08 0.10 16.0
15.0
14.0
13.0
12.0
0.01 0.03 0.06 0.08 0.10
Fig.2.Contourgraphsoftailingfactorsofchlorogenicacid(CGA)andcaffeicacid(CFA)withthe(a/d)isocratic,(b/e)increasinggradientand(c/f)decreasinggradientelution methods.
16.0
a
b
c
1 1.1
1 1.2
1.3
1.4
1 0.9
1.4
1.6
1.5 1.3
1.1
1.3
1.4
1.5 1.2
1.1 1.4
1.7
1.8
ACN in mobile phase (%; v/v)
Resolution CGA x Interfering peak
TFA concentration (%; v/v)
15.0
14.0
13.0
12.0
0.01 0.03 0.06 0.08 0.10 16.0
15.0
14.0
13.0
12.0
0.01 0.03 0.06 0.08 0.10 16.0
15.0
14.0
13.0
12.0
0.01 0.03 0.06 0.08 0.10
1
Fig.3.ContourgraphsofresolutionbetweenCGAandinterferingpeak(RsCGA-I)withthe(a)isocratic,(b)increasinggradientand(c)decreasinggradientelutionmethods.
onthisresponseisareflectionofitseffectonpeakwidthand reten-tiontime,withtheresolutionbetweenpeaksincreasingwhenit wasusedinintermediateconcentrations(0.04–0.07%;v/v).
Optimizationofthechromatographicmethod
Theoptimizationcriteriawereestablishedasatargetedvalueof 1.0forthetailingfactors(importance=4),anincreaseinthe num-beroftheoreticalplates forboth CGA and CFA(importance=3) and the maximization of the resolution between the CGA and interferingpeaks(importance=5).Theoptimizedconditionswere mathematicallydeterminedas(A)TFAconcentration0.05%(v/v), (B)proportionofACNinthemobilephase12%(v/v),and(C) increas-inggradientelutionmethod.Theresponsespredictedbythemodel wereTF1.11and0.99andNTP2204and4367forCGAandCFA, respectively,andRsCGA-I1.77.Thecombineddesirabilityfunction was0.598(Fig.4).Theindividualdesirabilityfunctionsforeach responsewere0.677and1.000forTFand0.323and0.265forNTP, forCGAandCFA,respectively,andtheRsCGA-Ivaluewas0.843.
Theconditionsmathematicallyobtainedwereapplied experi-mentallybypreparingconfirmationchromatographicruns(n=3). Theresultsobtainedfor theconfirmationrunswerewithinthe 95%predictionandthe95%confidenceintervals,indicatinggood
predictabilityofthemodelforalltheresponsesanalyzed.The chro-matogram obtainedfor DE#1under theoptimized conditionis showninFig.5a,anditclearlydemonstratesanadequate resolu-tionbetweentheCGA,CFAandinterferingpeaks.TheUVspectrum withintherangeof200to400nmwasverifiedbymeansofaPDA detector,andthespectrumpeakswereinagreementwiththose
0.600 0.500 0.400 0.300 0.200 0.100 0.000
0.10
0.08
0.06
0.03
0.01 16.0 15.0
14.0 13.0
12.0
ACN (%; v/v) TFA (%; v/v)
Desirability
A.O.Beringhsetal./RevistaBrasileiradeFarmacognosia25(2015)513–521 519
0.25
CGA
*
CFA
a
b
Absorbance (AU)
Absorbance (AU) Absorbance (AU)
0.05
0.00
0.15 CGA
C
CFA
0.10
0.05
0.00
200 250
Wavelength (nm)
300 350 400 200 250
Wavelength (nm)
300 350 400 0.3
0.2
0.1
0.0
0 5 10
Time (min)
15 20
Fig.5. (a)TypicalchromatogramsobtainedforCecropiaglazioviiundertheoptimizedchromatographicconditions.*Interferingpeak;(b)and(c)PADUVspectrumobtained forCGAandCFA,respectively.
obtainedfortheprimaryanalyticalstandards(Fig.5bandc), indi-catinggoodspectroscopicpurity.
Validationofthechromatographicmethod
The results for the repeatability and the intermediate pre-cision were considered satisfactory, since all RSD values were less than 0.8%, indicating that no significant variation in the quantification was detected. The analytical curves were plot-tedand a linear relationship(r2>0.999for both CGA and CFA) betweenthesignalandconcentrationwasfoundovertherangeof 1–200g/mlforCGA(y=53,422x−85,614)and2.5–100g/mlfor CFA(y=92,328x−12,240).TheDLandQLvaluesweredetermined as0.006and0.020g/mlforCGAand0.197and0.598g/mlfor CFA,respectively.
QuantificationofC.glazioviiextracts
Arecoveryassaywasperformedbyaddingknownamountsof pureCGAandCFAstandardstoeachsampleinitssolidstate.The sampleswerespikedwith25,50and75%ofaknownconcentration ofeachchemicalmarkerforeachproduct(finalconcentrationsof 125,150and175%,respectively).Theresultsobtainedareshownin Table5anddemonstrateexcellentrecoveryofthechemical mark-ersineachsample,indicatingthatthechromatographicmethodis abletoquantifythesecompoundswithoutanyinterferencefrom thematrices.Themethodhasproventobeselectivewhen analyz-ingdifferentplantsamples(DE#3–8),indicatingthatnosignificant interferenceswereobservedinproductsobtainedfromdifferent geographicregions(FDA,2003).
Also,theDE#1and2werequantifiedemployingapreviously publishedRP-HPLC-UVmethod(Arendetal.,2011)andanincrease ontheCGApeakareasof0.4±0.2and3.4±0.3%,respectivelywas noticed,whencomparedtothatobtainedemployingthemethod developedinthiswork.Suchincreasecanbeduetothe unsatisfac-toryresolutionbetweenCGAandtheinterferingcompoundunder themethoddevelopedbyArendetal.(2011).Themaceratedextract (DE#1)presentednosignificantinterference,butthehighshear extract(DE#2)showedsignificantdifferenceinpeakarea.
Table5
RecoverydataaftercontaminationofeachproductwithknownamountsofCGAand CFAstandards.
Product Chemical
marker
125% 150% 175%
Meanrecovery%(RSD)*
DE#1 CGA 101.47(0.74) 100.67(0.77) 100.67(0.73)
CFA 100.61(0.71) 100.45(0.50) 100.38(0.16)
DE#2 CGA 99.93(1.25) 101.15(0.35) 100.17(0.06)
CFA 100.50(0.61) 100.92(0.18) 100.05(0.06)
DE#3 CGA 100.64(0.57) 99.85(0.70) 101.12(1.13)
CFA 99.77(1.31) 100.68(0.65) 100.46(2.09)
DE#4 CGA 100.31(0.11) 100.37(0.15) 100.27(0.09)
CFA 99.91(2.19) 99.82(1.43) 99.85(0.71)
DE#5 CGA 99.81(0.67) 100.23(0.06) 100.13(1.10)
CFA 100.17(0.15) 100.60(0.59) 101.15(0.84)
DE#6 CGA 100.23(1.09) 99.91(1.28) 100.50(0.43)
CFA 101.39(0.51) 100.86(0.96) 100.69(0.36)
DE#7 CGA 100.27(0.06) 100.19(0.98) 100.78(0.55)
CFA 101.08(0.36) 99.83(0.73) 100.10(1.00)
DE#8 CGA 100.50(0.28) 100.90(0.64) 100.31(0.11)
CFA 100.54(0.42) 101.12(1.13) 99.98(1.63)
Discussion
C.glazioviiwaschosen astheplantspecies forthe
develop-mentoftheanalyticalmethod,duetoitshighcontentofphenolic compoundsofbiomedicalinterest.Amongthesecompounds,the phenolicacidspresentananalyticalchallengeduetotheirrelatively similarchemicalstructures,whichleadstotheelutionofseveral compoundswithinthesamechemicalclassincloseproximity.In thiscase,parameterssuchaspH,polarityandionpairingability ofthemobilephasehaveadirectinfluenceontheretention, res-olutionandsharpnessof thepeaks,and thusstronglyinfluence thechromatographicreliability.InthespecificcaseofC.glaziovii, forexample,unsatisfactorychromatographicconditionscausethe elutionofaninterferingcompoundrightaftertheCGApeak, dimin-ishingitsresolution andhinderingthereliablequantificationof thisphenolicacid,sinceitisdifficultforthechromatography sys-temintegratortodeterminewherethesignalpeakstartsandends. Dependingonthechromatographicconditions,thetwopeaksmay easilymerge,creatingafalseimpressionofapuresignal,whenin realityitisaspectroscopicimpurity.
RP-HPLCisthemethodofchoicefor theanalysisofphenolic compounds,duetothefastmasstransfer,highmechanicalstrength andhighseparationcapability,butsomedisadvantagesshouldbe takenintoconsideration. TheC18(2)column usedinthis study iscomprisedofoctadecylsilaneligandsboundtosilanolgroups onthesilicasurface.Thesebondsarenotcomplete,andthereare residualfreesilanolgroupsthatcangenerateasecondary interac-tionbetweenthestationaryphaseandtheanalyte(Watson,2005). Ingeneral,theseinteractionsonlyoccurtoasmallextent,dueto asterichindrancecausedbytheoctadecylsilane,butthe pres-enceoftheseresidualsilanolgroupsmaystillaffecttheseparation efficiency(Liuetal.,2008).Thesegroupsmightinteractwiththe analytewhenbothareionized,andthisinteractioncanresultin undesirablebroadeningortailingofthepeaks(Liuetal.,2008).For thisreason,thepHofthemobilephasemaybeacidifiedinorder topreventionizationofthesilanolgroups,andthereforesuppress theirinteractionwiththeanalyte.Theadditionofstrongpartially ionizedacids,suchasTFA,hastwobasicfunctionsinthe separa-tionofacidcompounds:tominimizetheinteractionbetweenthe silanolgroupsandthecompoundbyprotonatingthem,and sup-presstheionizationofacidsolutes,alteringtheretentiontimeof themolecules(CaiandLi,1999),thereforejustifyingitsuseinthese analyses.
Inthis study,theIV-OptimalResponseSurface Methodology designhasprovedtobeanexcellentchemometrictool to eval-uate theinfluence of different factors within theexperimental domain.Thisexperimentalmethodology, designed tominimize theintegratedpredictionvarianceusingtheIV-Optimalalgorithm (Jones and Goos, 2012; Samboet al., 2014), wasefficient even whencomparedtoothertypesofRSMdesign(Myersetal.,2009). TheIV-Optimaldesignallowedthedetectionofslightchangesin intensitiesofresponsethatcouldnotbeobservedthroughother experimentalmethodologies. Thisenabledthedetermination of adequatechromatographicconditionstosatisfactorilyanalyzeC.
glazioviiproducts.Thepolynomialequationsobtainedthroughthis
algorithmarespeciallyoptimized,targetingtheuseofthemodel asapredictiontool,anddeliveringtrustworthyresults.
Itwasobserved,throughspectroscopicstudies,thatthe maxi-mumabsorptionofbothCGAandCFAoccurredconcomitantlyat 330nm,andtherewasnosignificantchangeintheultravioletsignal underallexperimentalconditions(p<0.05).TheUV–Visdetector waschosentodevelopthechromatographic methodbecauseit ischeaperandmoreaccessiblewhen comparedtoother detec-torssuchasthePDAdetector,makingthismethodusefulfor a highernumberoflaboratories.Evidently,thePDAdetectorcould leadtohigher sensitivity, sinceit would enablethe analysisof
severalwavelengths,butitisalsomoreexpensive.Therefore,in caseswhereitispossibletoobtainhighabsorptionsignalsfromall compoundsunderonlyonewavelength,theUV–Visdetectorisa moreinterestingchoice.
The optimization of the chromatographic method was per-formedusinganumericaloptimizationmethod,whichfindsapoint thatallowsmaximizationoftheconditionsrelatedtothe desirabil-ityfunction.Thedesirabilityfunctionisamultipleresponsemethod whereanobjectivefunctioniscalculated,rangingfromzero (unde-sirableconditions)toone(targetconditions).Thistoolallowsthe combination of a goodset of conditions,obtainingthe optimal experimentalconditionsthatsatisfyallthegoalstothemaximum degreepossible.Thedesiredcharacteristicsmaybemodulatedby alteringtheweightandimportanceofeachresponse,allowingthe mathematicalmodeltogiveprioritytotheresponsesthatare con-sidered moreimportant than others, but alsotakingthem into considerationintheoptimizationprocess.Asaresult,adesirability indexis calculated, indicating how welltheoptimization crite-riaweresatisfied.Commonly,whentherearea highnumberof responsesinvolvedintheoptimizationprocess,asinthisstudy, thedesirabilityindexmaydrop.Inthiscase,alowdesirabilityindex doesnotmeanthatthecriteriawerenotsatisfied.Ratheritreflects thefactthatwhenseveralresponsesareinvolved,itisdifficultto satisfyalltheoptimizationcriteriawithtotalefficiency.Therefore concessionsmustbemadetoallowthedeterminationofan ade-quateoptimizedconditionthatfulfillsasmanyofthecriteriaas possible(Myersetal.,2009).Theoptimizedconditionswerefound underadesirabilityindexof0.598.Thisindexisconsidered ade-quatewhenanalyzingmultipleresponsesusingIV-OptimalRSM designs.
Thehighrobustnessofthemodelenabledsuccessful determina-tionoftheidealchromatographicconditionsfortheseparationand quantificationofbothCGAandCFAincomplexmatricesderived
fromC.glazioviiinarelativelyshortperiodofelutiontime.The
methodwasoptimizedbased onahighamountof data,which enabledexactpredictionofthebehaviorofthemethodwhenused toquantifyC.glazioviiproducts.Itwasalsoproventobea selec-tivemethodwhenanalyzingextractspreparedwithplantsamples fromdifferentgeographiclocationswithintheAtlanticForest.
This chromatographic method, when compared to the one developedbyArendetal.(2011),hasshowntobeableto sepa-ratetheinterferingcompoundpeakandtheCGApeak,asshown inFig.5a.AnincreaseinCGA’speakareawasnoticedwhenthe othermethodwasemployed,whichindicatesthatthepreviously publishedmethodisunabletosatisfactorilyseparatethesepeaks andleadstoafalseimpressionofspectralpurity.Eventhoughthe increaseintheareaofthepeakissmall(below5%), this differ-enceishighlyrelevantonthequantificationofachemicalmarker whentheproductionofapharmaceuticalproductisdesired.Itis alsoimportanttohighlightthatthedifferenceswerenoticedonly fortheextractpreparedbyhighshearextraction,andnotforthat obtainedbymaceration.Thisresultmaybeduetotheprinciple ofeachextractionmethod,oncetheshearextractionusuallyleads tohighlyconcentratedextractswhencomparedtothemaceration method.
A.O.Beringhsetal./RevistaBrasileiradeFarmacognosia25(2015)513–521 521
moreadequatewhenitcomestothedevelopmentofanalytical methodsforcomplexmatriceswhencomparedtothetypical “one-variable-at-a-time”experimentalapproach.Throughthisstudy,we demonstratedhowtosuccessfullyapplytheRSMIV-Optimal algo-rithmdesigntotheoptimizationofchromatographicmethods.
Thesefindingscanbeusefulforthereproductionofthe opti-mized chromatographic conditions in industrial and academic laboratoriesforthequantificationofchlorogenicandcaffeicacids
inC.glazioviiextractsandpharmaceuticalproducts.Themethod
developedhasshownimprovedselectivitywhencomparedtoa methodpreviously published. Thisstudyalsoprovides prelimi-naryinformationonthedevelopmentofnewanalyticalmethods forthequantificationofthesecompoundsinotherplant matri-ces,suchasthosebasedonotherCecropiaspecies.Furthermore, theapproachtoimprovingtheperformanceofchromatographic methodsdescribedhereinmaybeadoptedbyresearchersinthe developmentofchromatographicmethodsforotherplantspecies.
Authors’contributions
AOB(M.Sc.student)contributedinseveralstepsofthiswork, including the chromatographic analysis, data analysis, experi-mental design and drafted the paper. MD contributed to the chromatographicanalysis.TBCPcollaborated withenriched dis-cussionsandcorrectionofthepaperdraft.DS,coordinatorofthe researchgroup,designedthestudy,supervisedthelaboratorywork andanalyzedalldata.Alltheauthorshavereadthefinalmanuscript andapprovedthesubmission.
Conflictsofinterest
Theauthorsdeclarenoconflictsofinterest.
Acknowledgment
TheauthorsexpresstheirappreciationtoCAPES(Coordination fortheImprovementofHigherEducationPersonnel)fortheir finan-cialsupport(CAPES/DSfellowship).
References
Antony,J.,2014.DesignofExperimentsforEngineersandScientists,2nded.Elsevier. Arend,D.P.,DosSantos,T.C.,Sonaglio,D.,DosSantos,A.L.G.,Reginatto,F.H.,Campos, A.M.,2011.Experimentaldesignasatooltoevaluatechlorogenicandcaffeic acidsextractedfromCecropiaglazioviiSneth.J.Pharmaceut.Biomed.54,58–66. Beringhs,A.O.,Souza,F.M., De Campos,A.M.,Ferraz,H.G., Sonaglio, D.,2013. Technological development of Cecropia glaziovi Snetl. extract pellets by extrusion–spheronization.Rev.Bras.Farmacogn.23,161–168.
Bouayed,J.,Rammal,H.,Dicko,A.,Younos,C.,Soulimani,R.,2007.Chlorogenicacid, apolyphenolfromPrunusdomestica(Mirabelle),withcoupledanxiolyticand antioxidanteffects.J.Neurosci.262,77–84.
Cai,B.,Li,J.,1999.Evaluationoftrifluoraceticacidasanion-pairreagentinthe sep-arationofsmallionizablemoleculesbyreversed-phaseliquidchromatography. Anal.Chim.Acta399,249–258.
Cho, A.-S., Jeon, S.-M., Kim, M.-J., Yeo, J., Seo, K.-I., Choi, M.-S.,Lee, M.-K., 2010. Chlorogenic acid exhibitsanti-obesity property and improves lipid metabolism in high-fatdiet-induced-obese mice.Food Chem.Toxicol. 48, 937–943.
DelarcinaJr.,S.,Lima-Landman,M.T.R.,Souccar,C.,Cysneiros,R.M.,Tanae,M.M., Lapa,A.J.,2007.Inhibitionofhistamine-inducedbronchospasminguinea-pigs treatedwithCecropiaglazioviiSneth.extractsandcorrelationwiththeinvitro
activityintrachealmuscles.Phytomedicine14,328–332.
FDA,1994.ReviewerGuidanceValidationofChromatographicMethods.Centerfor DrugEvaluationandResearchoftheFoodandDrugAdministration(FDA). FDA,2003.GuidanceforIndustry:BioanalyticalMethodValidation.CenterforDrug
EvaluationandResearchoftheFoodandDrugAdministration(FDA). ICH,2005.ValidationofAnalyticalProcedures:TextandMethodology–Q2(R1).
TheInternationalConferenceonHarmonisationofTechnicalRequirementsfor RegistrationofPharmaceuticalsforHumanUse(ICH).
Jones,B.,Goos,P.,2012.I-optimalversusD-optimalsplit-plotresponsesurface designs.J.Qual.Technol.44,85–101.
Liu,H.,Xu,B.,Ray,M.K.,Shahrokh,Z.,2008.Peptidemappingwithliquid chromatog-raphyusingabasicmobilephase.J.Chromatogr.A1210,76–83.
Lorenzi,H.,Matos,F.J.A.,2008.PlantasMedicinaisnoBrasil:NativaseExóticas. InstitutoPlantariumdeEstudosdaFloraLtda,NovaOdessa.
Myers, R.H.,Montgomery, D.C., Anderson-Cook, C.M., 2009. Response Surface Methodology:ProcessandProductOptimizationUsingDesignedExperiments, 3rded.Wiley&SonsInc.
Neue,U.D.,2005.Theoryofpeakcapacityingradientelution.J.Chromatogr.A1079, 153–161.
Ninahuaman,M.F.M.L.,Souccar,C.,Lapa,A.J.,Lima-Landman,M.T.R.,2007.ACE activityduringthehypotensionproducedbystandardizedaqueousextractof
CecropiaglazioviiSneth:acomparativestudytocaptoprileffectsinrats. Phy-tomedicine14,321–327.
Ong,K.W.,Hsu,A.,Tan,B.K.H.,2013.Anti-diabeticandanti-lipidemiceffectsof chlorogenicacidaremediatedbyampkactivation.Biochem.Pharmacol.85, 1341–1351.
Rocha, F.F.,Lapa,A.J.,de Lima,T.C.M., 2002.Evaluation oftheanxiolytic-like effectsofCecropiaglazioviSneth.inmice.Pharmacol.Biochem.Behav. 71, 183–190.
Rocha,F.F.,Lima-Landman,M.T.R.,Souccar,C.,Tanae,M.M.,Lima,T.C.M.,Lapa, A.J.,2007.Antidepressant-likeeffectofCecropiaglaziouiSneth.andits con-stituints–invivoandinvitrocharacterizationoftheunderlyingmechanism. Phytomedicine14,396–402.
Sambo,F.,Borrotti,M.,Mylona,K.,2014.Acoordinate-exchangetwo-phaselocal searchalgorithmfortheD-andI-optimaldesignsofsplit-plotexperiments. Comput.Stat.DataAnal.71,1193–1207.
Santos,T.C.,2012.MicroesferascontendoextratopadronizadodeCecropiaglaziovi paraotratamentodahipertensãoarterial,MasterofScienceinPharmacy. DepartmentofPharmaceuticalSciences.UniversidadeFederaldeSantaCatarina, Florianópolis.
Silva,M.A.,Melo,L.V.L.,Ribeiro,R.V.,Souza,J.P.M.,Lima,J.C.S.,Martins,D.T.O.,Silva, R.M.,2010.Ethnobotanicalsurveyofplantsusedasanti-hyperlipidemicand anorexigenicbythepopulationofNovaXavantina-MT,Brazil.Rev.Bras. Farma-cogn.20,549–562.
Takeda,H.,Tsuji,M.,Inazu,M.,Egashira,T.,Matsumiya,T.,2002.Rosmarinicacid andcaffeicacidproduceantidepressive-likeeffectintheforcedswimmingtest inmice.Eur.J.Pharmacol.449,261–267.