www.atmos-chem-phys.net/15/10965/2015/ doi:10.5194/acp-15-10965-2015
© Author(s) 2015. CC Attribution 3.0 License.
Ozone and NO
x
chemistry in the eastern US: evaluation of
CMAQ/CB05 with satellite (OMI) data
T. P. Canty1, L. Hembeck1, T. P. Vinciguerra1, D. C. Anderson1, D. L. Goldberg1, S. F. Carpenter1, D. J. Allen1, C. P. Loughner2,3, R. J. Salawitch1,2,4, and R. R. Dickerson1
1Department of Atmospheric and Oceanic Science, University of Maryland, College Park, MD, USA 2Earth System Science Interdisciplinary Center, University of Maryland, College Park, MD, USA 3NASA Goddard Space Flight Center, Greenbelt, MD, USA
4Department of Chemistry and Biochemistry, University of Maryland, College Park, MD, USA
Correspondence to:T. P. Canty ([email protected])
Received: 6 December 2014 – Published in Atmos. Chem. Phys. Discuss.: 17 February 2015 Revised: 13 August 2015 – Accepted: 19 August 2015 – Published: 2 October 2015
Abstract. Regulatory air quality models, such as the Com-munity Multiscale Air Quality model (CMAQ), are used by federal and state agencies to guide policy decisions that de-termine how to best achieve adherence with National Ambi-ent Air Quality Standards for surface ozone. We use obser-vations of ozone and its important precursor NO2to test the representation of the photochemistry and emission of ozone precursors within CMAQ. Observations of tropospheric col-umn NO2from the Ozone Monitoring Instrument (OMI), re-trieved by two independent groups, show that the model over-estimates urban NO2 and underestimates rural NO2 under all conditions examined for July and August 2011 in the US Northeast. The overestimate of the urban to rural ratio of tro-pospheric column NO2for this baseline run of CMAQ (CB05 mechanism, mobile NOxemissions from the National
Emis-sions Inventory; isoprene emisEmis-sions from MEGAN v2.04) suggests this model may underestimate the importance of in-terstate transport of NOx. This CMAQ simulation leads to
a considerable overestimate of the 2-month average of 8 h daily maximum surface ozone in the US Northeast, as well as an overestimate of 8 h ozone at AQS sites during days when the state of Maryland experienced NAAQS exceedances. We have implemented three changes within CMAQ moti-vated by OMI NO2as well as aircraft observations obtained in July 2011 during the NASA DISCOVER-AQ campaign: (a) the modeled lifetime of organic nitrates within CB05 has been reduced by a factor of 10, (b) emissions of NOx from
mobile sources has been reduced by a factor of 2, and (c) iso-prene emissions have been reduced by using MEGAN v2.10
rather than v2.04. Compared to the baseline simulation, the CMAQ run using all three of these changes leads to consider-ably better simulation of column NO2in both urban and rural areas, better agreement with the 2-month average of daily 8 h maximum ozone in the US Northeast, fewer number of false positives of an ozone exceedance throughout the domain, as well as an unbiased simulation of surface ozone at ground-based AQS sites in Maryland that experienced an ozone ex-ceedance during July and August 2007. These modifications to CMAQ may provide a framework for use in studies fo-cused on achieving future adherence to specific air quality standards for surface ozone by reducing emission of NOx
from various anthropogenic sectors.
1 Introduction
plants. Phase 1 of the CSAPR emissions budgets is scheduled for implementation in 2015.
The Community Multiscale Air Quality model (CMAQ) is used extensively for regulatory purposes (Byun and Schere, 2006). State Implementation Plans (SIPs) quantify future emission reductions that will bring nonattainment areas into compliance with the National Ambient Air Quality Standard (NAAQS) for surface ozone. The recommendations submit-ted in the SIPs are based on analysis of output from air qual-ity models such as CMAQ that simulate meteorology and the nonlinearities inherent in tropospheric ozone chemistry. Ox-ides of nitrogen play a controlling role in ozone production in the eastern US and comparison of monitor records with CMAQ output suggests that this model overestimates NOx
concentrations in urban areas, but underestimates NOxin
ru-ral areas (Castellanos et al., 2011). The overestimate of NOx
in urban areas, coupled with the underestimate in rural ar-eas, means CMAQ may keep NOx too closely confined to
source regions, thereby underestimating the interstate trans-port of ozone precursors. Such disagreement may stem from the complicated nature of NOxemissions, recycling, and
re-moval though proper representation of dynamics (e.g. verti-cal mixing) may also play a role. Organo-nitrate compounds can act as reservoirs or sinks for NOxand have received
sub-stantial attention for many years (Atlas, 1988; Beaver et al., 2012; Day et al., 2003; Farmer et al., 2006; Lockwood et al., 2010; Neff et al., 2002; Perring et al., 2013, 2010, 2009; Xie et al., 2013). The production and loss mechanisms that gov-ern the concentrations of organo-nitrate species are largely simplified in most air quality models. Ground-based and air-craft measurements of ozone and its precursors provide im-portant constraints on the concentrations of trace gasses and can be used to validate model output. However, these data are geographically limited. In contrast, satellites provide a mea-sure of the spatial variation of these species over a much larger domain. In this study, we investigate the regional rep-resentation of NO2 in CMAQ by comparing model output to satellite observations from the Ozone Monitoring Instru-ment (OMI) (e.g., Boersma et al., 2011; Bucsela et al., 2013) during July and August 2007. Modifications to the chemi-cal mechanism and emissions inventories used by the model
OMI is one of four instruments onboard the NASA Aura satellite, now in its tenth year http://aura.gsfc.nasa.gov/. The satellite is in a sun synchronous orbit, providing OMI with a daytime overpass at ∼13:40 local time (LT). NO2 columns are retrieved using differential optical absorption spectroscopy (DOAS) in the 405–465 nm range. There are two operational retrievals of tropospheric column NO2based on radiances measured by OMI; the Derivation of OMI tro-pospheric NO2(DOMINO) product (Boersma et al., 2007, 2011) provided by the Royal Netherlands Meteorological In-stitute (KNMI) and the NASA Goddard Space Flight Center (GSFC) product (Bucsela et al., 2013).
Retrievals of tropospheric column NO2(hereafter, column NO2) from OMI are available for the width of the atmosphere observed along the viewing track (or swath) of the instru-ment. OMI tropospheric column NO2 is calculated by sub-tracting the stratospheric signal from the observations of total column NO2. The method of determining the stratospheric component varies between the GSFC and DOMINO prod-uct and is explained in Bucsela et al. (2013) and Boersma et al. (2007), respectively. GSFC assumes that total column NO2 over regions with little expected tropospheric influ-ence represents the stratospheric column. This field of strato-spheric column NO2is interpolated over nearby regions of high surface pollution and removed from the total column NO2retrieval to determine tropospheric column NO2. For the DOMINO product, data assimilation of OMI slant columns with the TM4 model (Tracer Model version 4, van Noije et al., 2006) determines the stratospheric subtraction. These level 2 (L2) observations do not occur on a regularly spaced grid. For a more meaningful comparison between satellite retrievals and model output, we generate level 3 (L3) prod-ucts on a 0.25◦×0.25◦(latitude, longitude) grid for both ob-served and calculated column NO2. Column NO2from OMI is weighted based on satellite viewing angle using the for-mulation of Bucsela et al. (2013). These same weights are applied to column NO2from CMAQ to assure a meaningful comparison.
less than 30 %. Observations are only considered valid and used for our analysis if the flag “xtrackqualityflag”, pro-vided in the data files for both retrievals, is equal to zero. This flag indicates which OMI data products can be used in a manner that minimizes the influence of the row anomaly along the observing swath (see http://www.knmi.nl/omi/ research/product/rowanomaly-background.php for more in-formation). Summary quality flags, also provided in the data files, provide quality assurance that at least 50 % of the tro-pospheric column is determined by observed information. In our study, retrievals are only used when this flag also equals zero. Comparison with model output is facilitated through the use of averaging kernels (DOMINO) or scat-tering weights (GSFC). No uncertainties are provided ex-plicitly for the averaging kernels or scattering weights. In-stead, the DOMINO retrieval team provides uncertainties (“VCDTropErrorUsingAVKernel”) that account for errors in both the NO2 column and the averaging kernel. The preci-sion in the GSFC NO2 product is provided in the variable “ColumnAmountNO2TropStd”. We use these uncertainties as the defacto way of comparing the two different retrievals of column NO2to model output of this quantity.
The production of ozone in our region of study is NOx
-limited for nearly all of the domain. An analysis of satellite observations acquired in 2005 to 2007 shows that ozone pro-duction is VOC-limited for only a small part of New York City, with the rest of the domain being NOx-limited
(Dun-can et al., 2010). Hence, the general focus of this manuscript is on model representation of nitrogen oxides. The results of this study may not be applicable to regions where production of ozone is VOC dominant, which occurs primarily in rural regions such as the so-called isoprene volcano of the Ozarks (Carlton and Baker, 2011) or regions of intense hydrocarbon processing such as Houston, Texas (Li et al., 2007).
3 Model description
For this analysis we use the Community Multiscale Air Qual-ity (CMAQ) modeling system version 4.7.1 (https://www. cmascenter.org/cmaq/). This model has been used exten-sively by states that are members of the Ozone Transport Commission (OTC) in preparation for the 2015 ozone SIP call. For this analysis, CMAQ simulations were performed for the Eastern US with a 12 km×12 km horizontal resolution and a 34 layer (σcoordinate) vertical grid from the surface to ∼20 km with hourly output. CMAQ does not include strato-spheric processes so the upper layers of the model atmo-sphere should not be used for research purposes. The analysis presented here is limited to altitudes below the tropopause. Simulated meteorology is driven by output from the Weather Research Forecasting (WRF v3.1.1) model for year 2007 and processed for use in CMAQ by the Meteorological Chemistry Interface Processor (MCIP).
Emissions inventories for year 2007 were developed by the Mid-Atlantic Regional Air Management Association, Inc. (MARAMA) specifically for use in OTC modeling ef-forts. Biogenic emissions were estimated using the Model of Emissions of Gases and Aerosols in Nature (MEGAN v2.04) (Guenther et al., 2006). Emissions from on-road mo-bile sources were developed using the Motor Vehicle Emis-sion Simulator (MOVES) (USEPA, 2010) while off–road emissions were supplied by the National Mobile Inventory Model (NMIM) (USEPA, 2005). Emissions due to aircraft are included in the inventories based on take-off and land-ing data for individual airports. Emission inventories and WRF/MCIP meteorology are merged and gridded using the Sparse Matrix Operator Kernel Emissions (SMOKE v3.1, https://www.cmascenter.org/smoke/) model to generate time-varying, three dimensional CMAQ ready emission fields. CMAQv4.7.1 uses the 2005 Carbon Bond (CB05) chemical mechanism (Yarwood et al., 2005). Though there is a more recent version of the Carbon Bond chemical mechanism (CB6) it is not available for use in publicly available versions of CMAQ as of the submission of this manuscript.
We have added lightning-generated NOx (LNOx), assum-ing an NOx production rate of 500 moles flash−1, to the
merged emissions files following the parameterization de-scribed in Allen et al. (2012). The production ofLNOx is cor-related to lightning flashes observed by the National Light-ning Detection network (NLDN), which records cloud to ground flashes (CG). The amount of intercloud lightning (IC) is calculated based on a climatological IC/CG ratio (Boc-cippio et al., 2001). In general, the amount of NOxsupplied
by lightning is much smaller than anthropogenic sources, es-pecially in urban areas. This may not necessarily be true in the future as further pollution control measures are enacted to reduce the emissions of NOxfrom power plants, vehicles,
etc. NeglectingLNOx may result in modeled NOx being
bi-ased low, especially in rural regions where NOx levels are
already much lower than in urban regions.
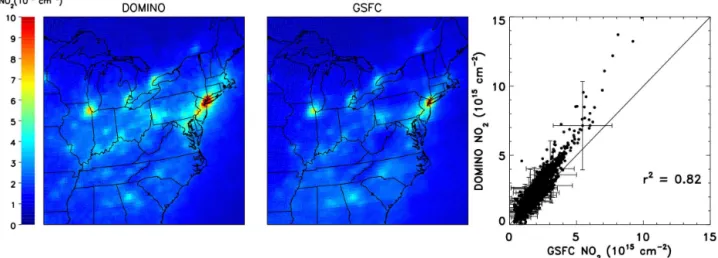
Figure 1.Average OMI tropospheric column NO2observations for July and August 2007 for both the DOMINO (left) and GSFC (middle) retrievals. The level 2 swath data for both retrievals have been screened, weighted based on viewing angle and gridded onto a 0.25◦×0.25◦ lat/lon grid. Only observations where cloud fraction is less than 30 % are used in the gridding process. Both data sets indicate that the highest levels of tropospheric NO2occur over urban regions. A scatter plot of DOMINO vs. GSFC observations (right) indicates that the DOMINO retrieval is roughly 20 % higher, on average, than the GSFC satellite product. Error bars indicate the uncertainty in the satellite retrievals.
Only those model grid points closest to the center of each pixel along the satellite swath are considered. To generate a model L3 gridded product, CMAQ output at each model grid cell is only used if the co-located satellite retrieval sat-isfies the quality flags and cloud fraction limits described above (i.e., we only use those CMAQ points where the clos-est satellite retrieval is also considered “valid”). CMAQ out-put is screened and gridded in an identical fashion as the re-spective OMI retrievals, to generate model L3 products (one for the DOMINO retrieval, the other for the GSFC retrieval) appropriate for comparison to the satellite data.
4 Analysis and results
4.1 Model/satellite comparisons
Gridded, L3 satellite retrievals of tropospheric column NO2 over the Eastern US for the July/August 2007 period of study are shown in Fig. 1. Both the DOMINO and GSFC retrievals exhibit similar patterns of elevated NO2 over urban cen-ters and lower, but substantial and quantifiable NO2 in ru-ral regions. The two retrieval products are well correlated (r2=0.82) and generally fall within the error bars of the observations. Column NO2found by the DOMINO retrieval is ∼20 % higher than column NO2found using the GSFC retrieval. It is beyond the scope of this paper to probe the cause of this disagreement. As such, we will compare both satellite retrievals to model output separately. This difference between data sets may affect attempts to estimate emissions of NOxfrom satellite retrievals. Our focus is on theratioof
column NO2between urban and rural regions; both retrievals yield similar scientific conclusions.
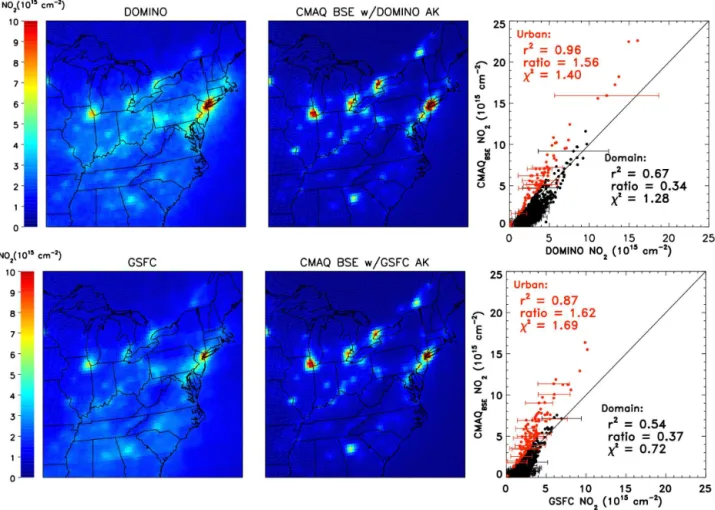
Figure 2 shows comparisons of the baseline CMAQ model (CMAQBSE) value of column NO2to the satellite data prod-uct found by both retrievals. Regions of elevated column NO2 are calculated over urban regions, roughly similar to observation, but the modeled column NO2 is significantly smaller over rural areas than reported by OMI. The corre-lation between model and observed NO2, shown for both retrievals in Fig. 2, is largely driven by the high density of points where column NO2 is below 5×1015cm−2 (Fig. 2, right panels). In this region of the distribution, observed NO2 is larger than the baseline air quality model for both satellite retrievals. The mean ratio of model to observations across the domain, which is predominantly rural, is 0.34 and 0.37 for DOMINO and GSFC, respectively. In the predominantly urban regions (red points, right panels of Fig. 2) the opposite is true; the mean ratio of model to observed NO2rises to 1.56 and 1.62 for the two retrievals.
Figure 2. Comparison of satellite observations of tropospheric column NO2(left panels) to output from a baseline CMAQ model run (CMAQBSE) convolved with the satellite-averaging kernels for the DOMINO retrieval (top middle) and GSFC retrieval (bottom middle). Model output is screened, weighted, and gridded in the same manner as the satellite retrievals. Scatter plots of model and satellite NO2 provide a more quantitative comparison (right panels). Error bars represent the uncertainty in the satellite retrievals. Metrics are provided to test the level of agreement between model and observations. The variance (r2), reduced chi-squared (χ2), and the mean ratio are calculated for all points within the model domain (black points).r2indicates the model can explain∼50–70 % of the satellite observations. The relatively low value of the mean ratio is driven by the large concentration of points below 5×1015cm−2, where the model underpredicts the satellite.χ2is better for the GSFC retrieval (0.72) than for DOMINO (1.28). The same metrics are calculated for grid cells where the simulations are at least 25 % greater than observations (called “Urban”, red points). While the variance is good, the ratio is high andχ2 implies that baseline modeled tropospheric column NO2falls outside the uncertainties of the observations.
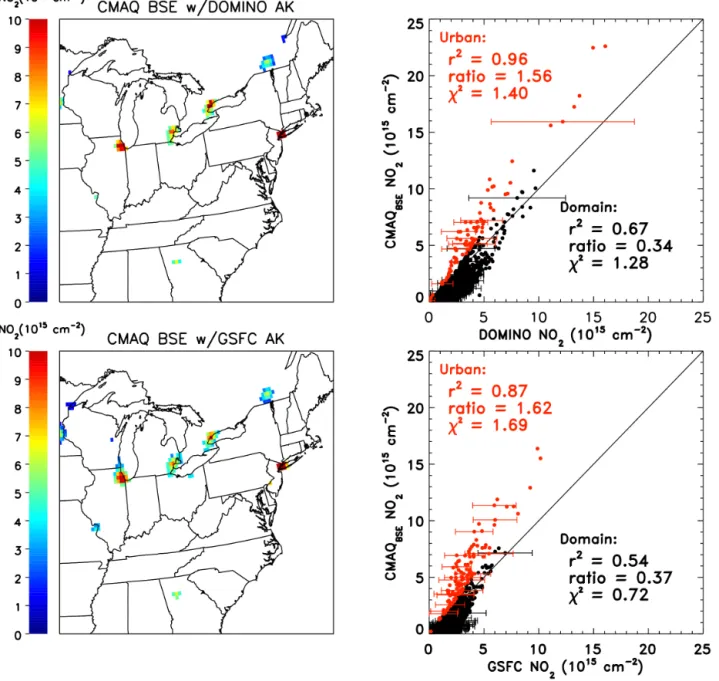
the elevated modeled column NO2can not be reconciled with the observations using the uncertainty estimates in the satel-lite retrievals. These results agree with reported discrepan-cies based on comparison of CMAQ output to observations of column NO2from SCIAMACHY (Napelenok et al., 2008) as well as surface NO2(Castellanos, 2009). Use of the BEHR (Russell et al., 2011) retrieval of column NO2 (not shown) gives similar results. Table 1 summarizes the numerical com-parisons between the DOMINO satellite retrievals and all model simulations presented in this study. Table 2 shows similar comparisons but for the GSFC retrieval. In a recent study, Lamsal et al. (2014) compared OMI NO2 to in situ and surface observations and reported OMI retrievals may be lower than observations in urban regions and higher in rural
regions, on the order of 20 %. This is the opposite of our re-sults, however, the OMI/observation biases are not enough to explain the model/OMI disagreement presented here.
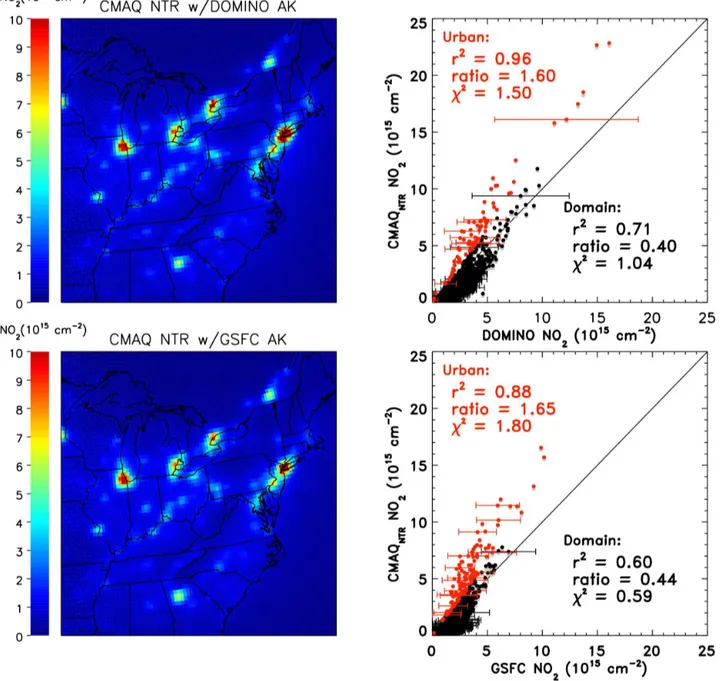
4.2 Long-lived NOxprecursors
or-Figure 3.The same model output as Fig. 2 except results are only shown for regions where the simulations are at least 25 % greater than observations (left panels). This clearly shows that model is biased high over urban regions indicated by the red points in the scatter plots (right panels).
ganic nitrate species and produces NO2and HO2, important precursors to surface O3formation (Yu et al., 2010).
We have diagnosed the lifetime of NTR due to photoly-sis to be∼10 days in CMAQ during summer, in agreement with the lifetime of C2to C4alkyl nitrates in the mixed layer (Luke et al., 1989). The CMAQ lifetime for NTR is based on photolysis frequencies calculated by the photolysis rates pre-processor module (jproc). Within CMAQ, NTR often consti-tutes 20 to 40 % of the total NOybudget. The long lifetime of
NTR results in sequestration of nitrogen compounds far from the emission source, perhaps accounting for the low
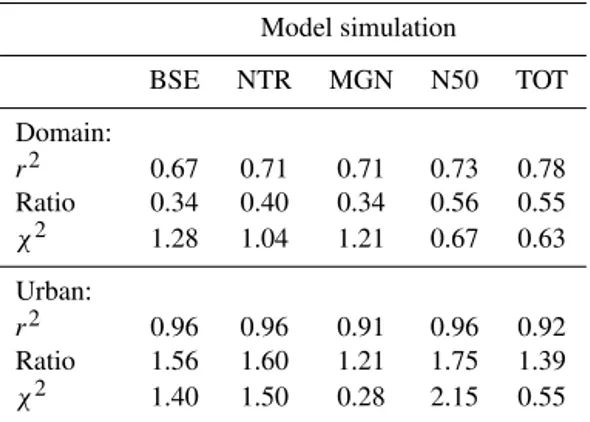
Table 1.Values of the variance (r2), mean ratio, and reduced chi-squared (χ2) calculated for all model simulations compared to the DOMINO retrievals of tropospheric column NO2.
Model simulation
BSE NTR MGN N50 TOT
Domain:
r2 0.67 0.71 0.71 0.73 0.78 Ratio 0.34 0.40 0.34 0.56 0.55 χ2 1.28 1.04 1.21 0.67 0.63
Urban:
r2 0.96 0.96 0.91 0.96 0.92 Ratio 1.56 1.60 1.21 1.75 1.39 χ2 1.40 1.50 0.28 2.15 0.55
Table 2.Values of the variance (r2), mean ratio, and reduced chi-squared (χ2) calculated for all model simulations compared to the GSFC retrievals of tropospheric column NO2.
Model simulation
BSE NTR MGN N50 TOT
Domain:
r2 0.54 0.60 0.59 0.58 0.64 Ratio 0.37 0.44 0.38 0.62 0.60 χ2 0.72 0.59 0.66 0.42 0.37
Urban:
r2 0.87 0.88 0.81 0.90 0.83 Ratio 1.62 1.65 1.24 1.80 1.41 χ2 1.69 1.80 0.39 2.44 0.68
A comparison of NTR from a baseline CMAQ run to mea-surements obtained during the 2011 NASA DISCOVER-AQ field mission shows modeled NTR to be 2–4 times greater than observed (Fig. 4, top). This version of the model uses emissions inventories and meteorological fields appropriate for 2011 (Loughner et al., 2011; Anderson et al., 2014; Gold-berg et al., 2014; Flynn et al., 2014; He et al., 2014). To in-vestigate the source of this discrepancy we have increased the photolysis frequency of NTR by a factor of 10, reducing the lifetime to∼1 day. This model scenario will be referred to as CMAQNTRfor the remainder of this study. Values of NTR found using a shorter lifetime are in much better agreement with observed NTR, indicating a significant improvement in the model representation of alkyl nitrate chemistry (Fig. 4, bottom). We recognize that decreasing the lifetime of NTR with respect to photolysis by a factor of 10 may be too sim-plistic, but this calculation is meant to illustrate how a thor-ough representation of the NTR family of gasses may lead to overall improvements to the model framework. A full revi-sion of alkyl nitrate is being undertaken by the EPA (Leucken and Schwede, 2014).
Figure 4.(Top panel) Comparison of baseline CMAQ simulations of organic nitrates (NTR) (colored contours) to NTR observed dur-ing the DISCOVER–AQ field mission on 29 July 2011 (colored points). (Bottom panel) As in the top panel, except the CB05 chem-ical mechanism in CMAQ has been modified such that the lifetime of NTR is reduced by a factor of 10.
The breakdown of NTR, having a lifetime of∼1 day, in-creases local NO2both by direct production of NO2and by shifting the partitioning of NOxtoward NO2via the HO2+ NO reaction. A comparison of CMAQ tropospheric column NO2 (convolved with the averaging kernels) found for the CMAQNTR simulation and OMI column NO2 is shown in Fig. 5. There is slightly better agreement between modeled and column NO2 and both satellite retrievals for the entire domain compared to the baseline simulation, generally due to increased NO2 in rural areas for CMAQNTR. However, for CMAQNTR, modeled column NO2in urban regions (red points, Fig. 5) lies further from observed NO2than found for the baseline simulations.
In CB05, 100 % of the NOx from photolysis of NTR or
its products is recycled. Loss through OH attack, also fast for isoprene nitrates, yields HNO3, a NOx sink in the
tropo-sphere. The model output presented here can be considered a bounding scenario since this treatment of NOxis an
over-simplification. If NOxrecycling were not 100 % efficient, we
Figure 5.Similar to Fig. 2 except the chemical mechanism in the CMAQ model has been modified such that the lifetime of NTR is reduced by a factor of 10 (CMAQNTR). Gray points on the scatter plots represent the results shown in Fig. 2 (right panels). As in Fig. 3, red points represent urban regions.
scope of this study to assess the sensitivity of NO2and O3to this level of detail of the CB05 mechanism.
Emissions from airplanes en route are not considered in the emissions inventories. However, the overall contribution from aircraft aloft to the tropospheric column is relatively mi-nor (i.e., less than 1 % of tropospheric column) and would not explain the urban/rural discrepancy between satellite obser-vations and model output (Jacobson et al., 2013).
4.3 Emissions of NOxfrom mobile sources
A comparison of NOxfrom emission inventories for 2011 to
observations taken during DISCOVER-AQ (July 2011) has quantified a potential overestimation of mobile NOx
(Ander-son et al., 2014). The ratio of CO/NOy from observations
was roughly a factor of 2 greater than the ratio based on the National Emissions Inventory data used in CMAQ. Model CO is only∼15 % greater than observed for this time period, indicative of a large overestimate of mobile NOx emissions
a study by Yu et al. (2012) who compared CMAQ simula-tions, using the CB4.2 chemical mechanism, to aircraft data acquired during the TexAQS/GoMACCS campaign. National Emissions Inventory (NEI) point and area sources for year 2001 were projected to 2006 and mobile emissions were gen-erated from the EPA MOBILE6 model. Yu et al. (2012) re-port modeled CO∼10 % greater than measured. However, the ratio of observed CO/NOy=26.9 (determined using
values from Table 4, Yu et al., 2012) is roughly a factor of 2 higher than the CMAQ calculated ratio of CO/NOy=13.1.
A separate analysis of 2011 DISCOVER-AQ observations has shown that CMAQ consistently overestimated NOy by
a factor of 2 from the surface to 3000 m altitude (Goldberg et al., 2014).
Airborne observations analogous to those taken during DISCOVER-AQ in summer 2011 do not exist for summer 2007. We have examined observations of CO and NOxfrom
six surface air quality monitoring sites in Maryland, Northern Virginia, and the District of Columbia acquired during sum-mer 2007. The chemiluminescence method of detecting NOx
suffers from known interferences (Castellanos et al., 2011; Dunlea et al., 2007; Fehsenfeld et al., 1987). It is reason-able to assume that the surface sites are actually reporting NO∗x=NOy−HNO3. For the summer of 2007, CO observa-tions also seem to have calibration issues. Nonetheless, we have compared the observed ratio of CO/NO∗x from these
six sites to the CMAQ value of CO/NO∗x, where CMAQ
is sampled at the time and location of each surface obser-vation. The mean and 1σ standard deviation of the observed divided by modeled value of CO/NO∗
xis 1.97±1.5 for
sum-mer 2007; the large SD reflects a great deal of noise in the surface observations. The fact that observed CO/NO∗
x
ex-ceeds the modeled value of this quantity supports the notion that mobile emissions in the 2007 inventory exceed the actual emissions from this source by an amount comparable to that reported by Anderson et al. (2014). Doraiswamy et al. (2009) also report a possible over-prediction in area source emis-sions.
Following Anderson et al. (2014), we assume that there is a similar overestimation of NOxin the 2007 emissions
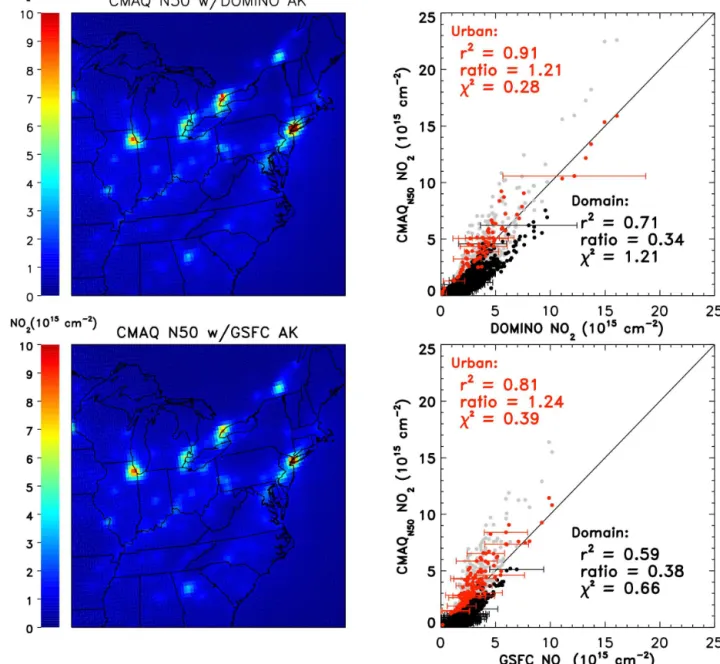
inven-tories used in our analysis and we test for this discrepancy by reducing on-road mobile NOxemissions by a factor of 2.
Re-sults from a CMAQ model run that considers this change as well as the reduction in NTR lifetime in the CB05 chemical mechanism, termed CMAQN50(i.e., a factor of 2 or 50 % re-duction), are shown in Fig. 6. The most noticeable difference between these results and those presented in Figs. 2 and 5 is the reduction in column NO2 over urban regions, which is now in much better agreement with satellite observations (ratios between model and observations of 1.21 and 1.24 for DOMINO and GSFC, respectively). While the modifications to the CB05 chemical mechanism and emissions inventories have somewhat reconciled the differences between modeled and remotely sensed urban tropospheric column NO2, rural NO2 is still underestimated by the model. Mean ratios for
the domain (0.34 and 0.38) are similar to results from the baseline model. Essentially, these modifications to the model have improved the urban disagreement, but overall model performance is unchanged.
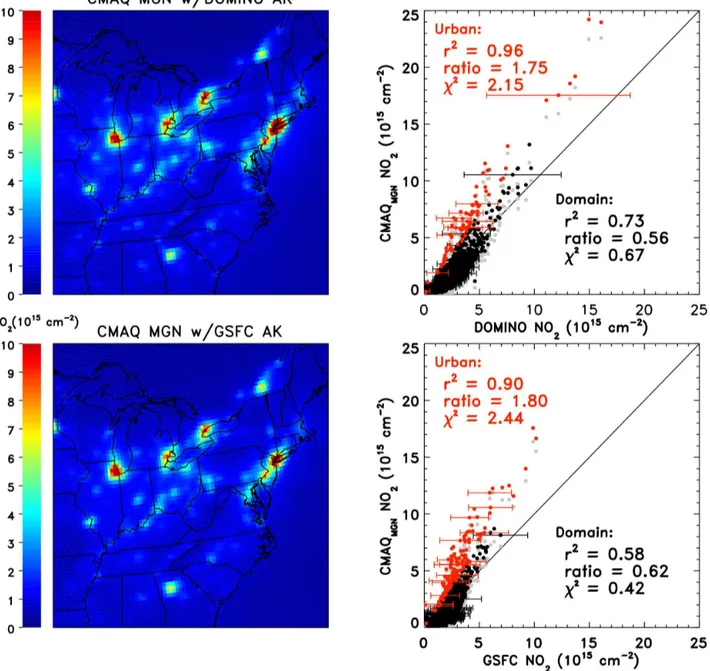
4.4 Biogenic emissions
As stated above, the original emissions inventories generated by MARAMA include biogenic sources from the Model of Emissions of Gases and Aerosols in Nature (MEGAN v2.04) (Guenther et al., 2006). Since the 2007 emissions invento-ries were made available, an updated version of MEGAN was released (v2.10, Guenther et al., 2012). One of the main differences in biogenic emissions between the two versions of MEGAN is that isoprene, the dominant VOC in the mid-Atlantic region, has decreased by about 25 % in the lat-est version. Emissions of biogenic isoprene calculated using MEGAN v2.10 are significantly less sensitive to high levels of photochemically active radiation (PAR) compared to ear-lier versions of MEGAN, resulting in lower isoprene during midday near the time of OMI overpass. An in-depth analysis of the sensitivity of regulatory air quality models to simula-tion of biogenic emissions will be the subject of a forthcom-ing paper.
Fundamentally, isoprene oxidation is initiated by reaction with OH to generate isoprene peroxy radical intermediates, termed RO2. In the presence of NOx, these RO2 intermedi-ates react with NO, producing MVK, MACR, HCHO, and a small amount of organic nitrates (Paulot et al., 2009). Over-all, when output from the latest version of MEGAN is incor-porated into the emissions inventories (CMAQMGN) there is an overall increase in column NO2across the model domain due to the reduction in NOxsinks (Fig. 7).
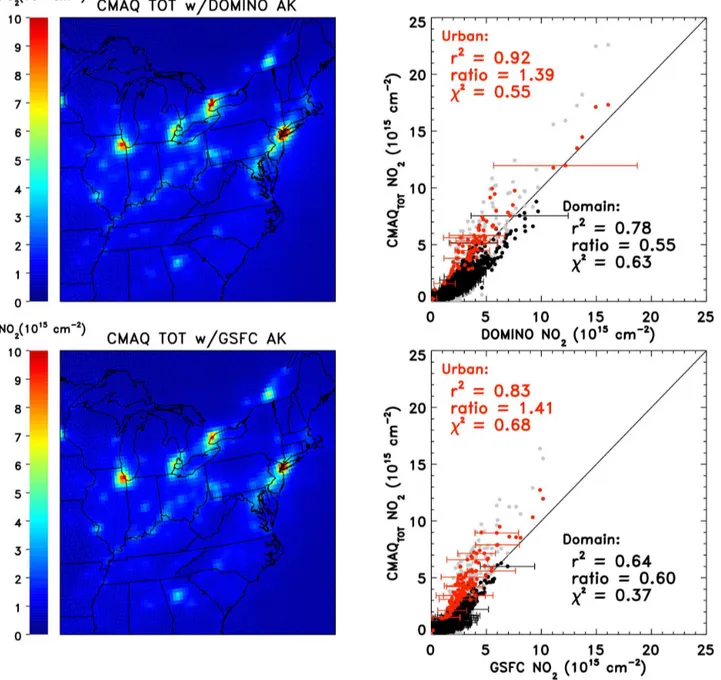
Combining the modifications to the CB05 chemical mech-anism with the changes to mobile and biogenic emissions yields the best overall agreement between model and obser-vations (CMAQTOT, Fig. 8) over the model domain. The cor-relation between measured and modeled NO2 is larger for CMAQTOT (r2=0.78, 0.64 for DOMINO, GSFC) than for any other model scenario. Modeled NO2for urban regions is in even better agreement with the satellite retrievals for all of the calculated metrics. While further work is needed, we have succeeded in decreasing the urban overestimate and rural underestimate of tropospheric column NO2compared to satellite data by: (a) using the latest version of MEGAN, (b) prescribing a factor of 2 reduction in mobile NOx
emis-sions throughout the domain, and (c) reducing the lifetime of NTR within CB05 by a factor of 10.
5 Model uncertainties
Figure 6.Same as Fig. 2 except model results include both changes to NTR chemistry and a 50 % reduction in the emissions of NOxfrom
mobile sources (CMAQN50). Gray points on the scatter plots represent the results shown in Fig. 2 (right panels).
reaction rate of OH+NO2+Mis slower than what has been recommended by prior work (Atksinson et al., 2004; Sander et al., 2006). The uptake of N2O5in aerosols is likely overes-timated in models (Han et al., 2015; Stavrakou et al., 2013; Vinken et al., 2014; Yegorova et al., 2011). We have per-formed two model simulations that consider the slower reac-tion rate of OH+NO2+M(CMAQOH+NO2) and assume the
heterogeneous removal of N2O5is zero (CMAQN2O5). Both
of these scenarios also include all of the changes made to the model framework in CMAQTOT. Results are presented in the Supplement. Overall, both of these changes to the model show very little difference for column NO2compared to that
found in CMAQTOT simulation. This is in agreement with prior studies (Han et al., 2015; Stavrakou et al., 2013; Vinken et al., 2014; Yegorova et al., 2011).
The production of HNO3from the reaction of NO+HO2 (Butkovslaya et al., 2007) would lead to a decrease in NO2. This channel of the NO+HO2 reaction is not included in the CB05 chemical mechanism. Inclusion of this NOx loss
Figure 7.Same as Fig. 2 except model results include updated biogenic emissions from MEGANv2.10 (CMAQMGN). Gray points on the scatter plots represent the results shown in Fig. 2 (right panels).
urban regions described in this study, it would exacerbate the model/measurement discrepancy in rural areas.
Future work will investigate the importance of soil emis-sions of HONO, which are not included in the current ver-sions of MEGAN and the chemical kinetics of other species that are important precursors to surface ozone. Prior studies indicate that soil emissions may account for 7 % of column NO2during the summer ozone season (Choi et al., 2008) and that HONO could be an important morning source of OH in an urban, VOC-rich environment (Ren et al., 2013).
6 Ozone
ob-Figure 8.Same as Fig. 2 except model results include changes to NTR chemistry, a 50 % reduction in the emissions of NOxfrom mobile
sources, and updated biogenic emissions (CMAQTOT). Gray points on the scatter plots represent the results shown in Fig. 2 (right panels).
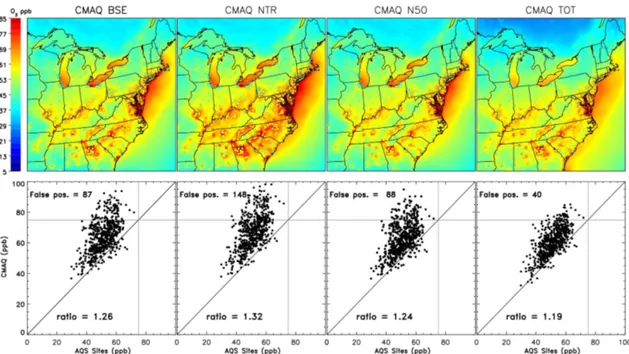
served surface ozone. In Fig. 9, we compare average maxi-mum daily 8 h average ozone from the four modeling scenar-ios considered above (CMAQBSE, CMAQNTR, CMAQN50, and CMAQTOT) to measured surface ozone from ground-based air quality observing sites (AQS). We have chosen to show the average of the daily maximum 8 h ozone for July and August 2007 at each model grid point. While it may seem that there were no violations of the 75 ppb standard, based on the scatter plots of model and observed ozone (Fig. 9, bot-tom), this is certainly not the case. There were exceedances of the 75 ppb ozone standard during this time; however, we have averaged these events with days having lower ozone.
There were no locations where the 62-day average of daily maximum 8 h ozone exceeded 75 ppb for this time period. An additional comparison, shown at the end of this section, will focus on days when the surface ozone standard was ex-ceeded in Maryland.
Figure 9.Average daily maximum 8 h daily ozone for July and August 2007 for four model cases: CMAQBSE(top left), CMAQNTR(top middle left), CMAQN50(top middle right), and CMAQTOT(top right) and ground based observations. Colored contours represent the CMAQ model output. Colored points denote average daily maximum 8 h daily ozone from ground-based AQS sites for the same time period. Scatter plots of each CMAQ model output vs. observations are shown (bottom panels). Gray horizontal and vertical lines indicate the 75 ppb ozone exceedance level. The number of times the model output is greater than 75 ppb while the observations are less than 75 ppb is shown (false positive). The mean ratio between CMAQ surface ozone and observations at air quality sites is indicated for each model simulation.
CB05 for CMAQNTRprovide a much more realistic represen-tation of NOx chemistry (see Fig. 4), comparison of ozone
found using CMAQNTR and the baseline run suggests the presence of compensating errors in the chemistry and/or dy-namics that control ozone. The inclusion of a 50 % reduction of mobile NOx(CMAQN50) (Anderson et al., 2014) leads to a decrease in modeled ozone compared to results from the CMAQNTR run. Simulated ozone is still 24 % greater than measured, although there is slight improvement compared to the baseline run. Improved agreement between model and AQS observations of ozone occurs when updated biogenic emissions are also included, together with the aforemen-tioned changes to mobile NOx and the lifetime of NTR. In
this scenario, CMAQTOT, the model/measurement discrep-ancy for ozone is reduced to 19 % and there are only 40 false positives. The reason for this model behavior is that the reduction in isoprene emission upon use of MEGANv2.10 leads to decreases in HO2and RO2, important ozone precur-sors.
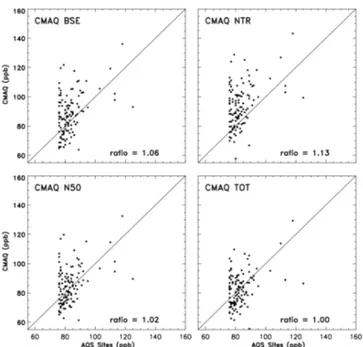
If a ground-based ozone monitor reports 8 h average ozone exceeding the NAAQS standard, currently 75 ppb, it is considered to be in non-attainment. These sites are the subject of intense focus by state agencies to determine the fundamental causes of the ozone exceedance (e.g., local sources of pollution vs. out of state upwind sources). A comparison of ozone on days when observed ozone exceeded 75 ppb in Maryland during July and August 2007
to CMAQ model output is shown in Fig. 10. It should be noted that the ozone standard in 2007 was 80 ppb. However, the state of Maryland provides historic ozone data for the current, 75 ppb standard. These data can be found at https://data.maryland.gov/Energy-and-Environment/ Maryland-Ozone-Exceedance-Days-in-2007/iyzm-8pqd. The model values of daily 8 h average ozone represent the closest points, spatially, to the monitor sites on the day that the exceedance occurred. For all model cases, CMAQ shows greater variability than the ground-based monitors during times of ozone exceedance. The overall analysis of the model runs for these days/times leads to results similar to the analysis in Fig. 9. The decrease in the lifetime of NTR (13 % overestimate) leads to an increase in model ozone compared to baseline (6 % overestimate), while the model that considers both reduced NTR lifetime and a 50 % decrease in mobile NOxemission yields an improved
Figure 10. Comparison of average 8 h surface ozone calculated from baseline CMAQ model output (top left), CMAQNTRmodel output (top right), CMAQN50model output (bottom left panel), and CMAQTOT(bottom right) to observations from ground-based AQS sites for those days and locations in Maryland that experienced ex-ceedances (8 h average ozone greater than 75 ppb) during July and August 2007.
CMAQ air quality model is unbiased during a period of air quality exceedance.
7 Conclusions
We examine the ability of CMAQ to simulate reactive ni-trogen over the eastern US by comparing model output to column content NO2 observed by the OMI instrument on the AURA satellite. For July and August 2007, CMAQ con-sistently overestimates NO2over urban areas and underesti-mates NO2over rural areas relative to OMI observations; this finding is insensitive to the choice of GSFC or DOMINO re-trieval product. Neither inclusion of lightning NOxnor
con-sideration of the averaging kernel/scattering weights for OMI alters this conclusion. While the absolute value of NO2 col-umn content is subject to errors from a variety of sources, the urban/rural ratio provides a rigorous test of CMAQ’s abil-ity to simulate the photochemistry of NO2and the transport of this important criteria air pollutant. Because CMAQ using the CB05 mechanism overestimates the urban to rural ratio of tropospheric column NO2, this model may underestimate the interstate transport of NOxand/or NOxreservoirs.
The CB05 chemical mechanism represents all alkyl ni-trates as isopropyl nitrate – a reasonable simplification given the state of knowledge at the time of creation. However, there is now substantial evidence of a larger variety of alkyl
ni-Use of the latest MEGAN emissions for VOCs, v2.10 (Guen-ther et al., 2012), increases NO2throughout the domain and further improves the CMAQ representation of urban to rural NO2, due to smaller levels of RO2. The reduction in isoprene, which leads to the decrease in RO2, is caused by the dimin-ished sensitivity of isoprene emissions to PAR in the newer version of MEGAN.
We have also examined the effect of these various model runs on the CMAQ representation of surface ozone. Reduc-ing the lifetime of NTR by a factor of 10 increases the aver-age daily 8 h maximum ozone by∼5 %; decreasing mobile source NOx emissions by a factor of 2 decreases ozone by
about 6 %. The use of MEGAN v2.10 causes surface ozone to fall by 2.5 % relative to a simulation that is identical, except for use of MEGAN 2.04. Combining all three of these model changes (i.e., factor of 10 reduction in NTR lifetime, factor of 2 reduction in mobile NOx, MEGAN v2.10) leads to the best
simulation of surface ozone for the mid-Atlantic. This model run leads to agreement with the 2-month average of daily 8 h maximum ozone at the±20 % level, fewest number of false positives of an ozone exceedance throughout the domain, as well as an unbiased simulation of surface ozone at ground-based AQS sites that experienced an ozone exceedance (8 h ozone greater than 75 ppb) within Maryland during July and August 2007. The prescription of an unbiased simulation of ozone, coupled with a fairly accurate simulation of the ur-ban to rural ratio of column NO2, may provide a framework for use in studies focused on achieving future adherence to specific air quality standards for surface ozone by reducing emission of NOxfrom various anthropogenic sectors.
The Supplement related to this article is available online at doi:10.5194/acp-15-10965-2015-supplement.
Jim Crawford, Ken Pickering, Ron Cohen, and Andy Weinheimer to provide support for our use of NASA DISCOVER-AQ measure-ments acquired in the mid-Atlantic during summer 2011.
Edited by: C. H. Song
References
Acarreta, J. R., De Haan, J. F., and Stamnes, P.: Cloud pressure re-trieval using the O2–O2absorption band at 477 nm, J. Geophys. Res., 109, D05204, doi:10.1029/2003JD003915, 2004.
Allen, D. J., Pickering, K. E., Pinder, R. W., Henderson, B. H., Appel, K. W., and Prados, A.: Impact of lightning-NO on east-ern United States photochemistry during the summer of 2006 as determined using the CMAQ model, Atmos. Chem. Phys., 12, 1737–1758, doi:10.5194/acp-12-1737-2012, 2012.
Anderson, D. C., Loughner, C. P., Weinheimer, A., Diskin, D., Canty, T. P., Salawitch, R. J., Worden, H., Freid, A., Mikoviny, T., Wisthaler, A., and Dickerson, R. R.: Measured and modeled CO and NOy in DISCOVER-AQ: an evaluation of emissions
and chemistry over the eastern US, Atmos. Environ., 96, 78–87, 2014.
Atlas, E.: Evidence for greater than or equal to C3alkyl nitrates in rural and remote atmospheres, Nature, 331, 426–428, 1988. Atkinson, R., Baulch, D. L., Cox, R. A., Crowley, J. N.,
Hamp-son, R. F., Hynes, R. G., Jenkin, M. E., Rossi, M. J., and Troe, J.: Evaluated kinetic and photochemical data for atmospheric chem-istry: Volume I – gas phase reactions of Ox, HOx, NOxand SOx
species, Atmos. Chem. Phys., 4, 1461–1738, doi:10.5194/acp-4-1461-2004, 2004.
Beaver, M. R., Clair, J. M. St., Paulot, F., Spencer, K. M., Crounse, J. D., LaFranchi, B. W., Min, K. E., Pusede, S. E., Wooldridge, P. J., Schade, G. W., Park, C., Cohen, R. C., and Wennberg, P. O.: Importance of biogenic precursors to the bud-get of organic nitrates: observations of multifunctional organic nitrates by CIMS and TD-LIF during BEARPEX 2009, Atmos. Chem. Phys., 12, 5773–5785, doi:10.5194/acp-12-5773-2012, 2012.
Boccippio, D., Cummins, K., Christian, H., and Goodman, S.: Com-bined satellite- and surface-based estimation of the intra-cloud-to-ground lightining ratio over the continental United States, Mon. Weather Rev., 129, 108–122, 2001.
Boersma, K. F., Eskes, H. J., Veefkind, J. P., Brinksma, E. J., van der A, R. J., Sneep, M., van den Oord, G. H. J., Levelt, P. F., Stammes, P., Gleason, J. F., and Bucsela, E. J.: Near-real time retrieval of tropospheric NO2from OMI, Atmos. Chem. Phys., 7, 2103–2118, doi:10.5194/acp-7-2103-2007, 2007.
Boersma, K. F., Eskes, H. J., Dirksen, R. J., van der A, R. J., Veefkind, J. P., Stammes, P., Huijnen, V., Kleipool, Q. L., Sneep, M., Claas, J., Leitão, J., Richter, A., Zhou, Y., and Brun-ner, D.: An improved tropospheric NO2column retrieval algo-rithm for the Ozone Monitoring Instrument, Atmos. Meas. Tech., 4, 1905–1928, doi:10.5194/amt-4-1905-2011, 2011.
Brent, L. C., Thorn, W. J., Gupta, M., Leen, B., Stehr, J. W., He, H., Arkinson, H. L., Weinheimer, A., Garland, C., Pusede, S. E., Wooldridge, P. J., Cohen, R. C., and Dickerson, R. R.: Evaluation of the use of a commercially available cavity ringdown absorp-tion spectrometer for measuring NO2in flight, and observations
over the Mid-Atlantic States, during DISCOVER-AQ, J. Atmos. Chem., doi:10.1007/s10874-013-9265-6, 2013.
Bucsela, E. J., Krotkov, N. A., Celarier, E. A., Lamsal, L. N., Swartz, W. H., Bhartia, P. K., Boersma, K. F., Veefkind, J. P., Gleason, J. F., and Pickering, K. E.: A new stratospheric and tropospheric NO2retrieval algorithm for nadir-viewing satellite instruments: applications to OMI, Atmos. Meas. Tech., 6, 2607– 2626, doi:10.5194/amt-6-2607-2013, 2013.
Butkovskaya, N. I., Kukui, A., and Le Bras, G.: HNO3 forming channel of the HO2+NO reaction as a function of pressure and temperature in the ranges of 72–600 Torr and 223–323 K, J. Phys. Chem. A, 111, 9047–9053, 2007.
Butler, T. J., Vermeylen, F. M., Rury, M., Likens, G. E., Lee, B., Bowker, G. E., and McCluney, L.: Response of ozone and nitrate to stationary source NOx emission
reduc-tions in the eastern USA, Atmos. Environ., 45, 1084–1094, doi:10.1016/j.atmosenv.2010.11.040, 2011.
Byun, D. and Schere, K. L.: Review of the governing equations, computational algorithms, and other components of the models-3 Community Multiscale Air Quality (CMAQ) modeling system, Appl. Mech. Rev., 59, 51–77, 2006.
Carlton, A. G. and Baker, K.: Photochemical modeling of the Ozark isoprene volcano: MEGAN, BEIS, and their impacts on air quality predictions, Environ. Sci. Technol., 45, 4438–4445, doi:10.1021/es200050x, 2011.
Cariolle, D., Evans, M., Chipperfield, M., Butkovskaya, N., Kukui, A., and LeBras, G.: Impact of the new HNO3–forming channel of the HO2+OH reaction on tropospheric HNO3, NOx, HOx, and ozone, Atmos. Chem. Phys., 8, 4061–4068,
doi:10.5194/acp-8-4061-2008, 2008.
Castellanos, P.: Analysis of Air Quality with Numerical Simulations (CMAQ), and Observations of Trace Gases, The University of Maryland, College Park, 168 pp., 2009.
Castellanos, P., Marufu, L. T., Doddridge, B. G., Taubman, B. F., Schwab, J. J., Hains, J. C., Ehrman, S. H., and Dickerson, R. R.: Ozone, oxides of nitrogen, and carbon monoxide during pol-lution events over the eastern United States: an evaluation of emissions and vertical mixing, J. Geophys. Res., 116, D16307, doi:10.1029/2010JD014540, 2011.
Choi, Y., Wang, Y., Zeng, T., Cunnold, D., Yang, E.-S., Mar-tin, R., Chance., K., Thouret, V., and Edgerson, E.: Spring-time transitions of NO2, CO, and O3 over North America: model evaluation and analysis, J. Geophys. Res., 113, D20311, doi:10.1029/2007JD009632, 2008.
Day, D. A., Dillon, M. B., Wooldridge, P. J., Thornton, J. A., Rosen, R. S., Wood, E. C., and Cohen, R. C.: On alkyl ni-trates, O3, and the “missing NOy”, J. Geophys. Res., 108, 4501,
doi:10.1029/2003JD003685, 2003.
Doraiswamy, P., Hogrefe, C., Hao, W., Henry, R. F., Civerolo, K., Ku, J.-Y., Sistla, G., Schwab, J. J., and Demerjian, K. L.: A diagnostic comparison of measured and model-predicted spe-ciated VOC concentrations, Atmos. Environ., 43, 5759–5770, doi:10.1016/j.atmosenv.2009.07.056, 2009.
Duncan, B. N., Yoshida, Y., Olson, J. R., Sillman, S., Martin, R. V., Lamsal, L., Hu, Y., Pickering, K. E., Retscher, C., Allen, D. J., and Crawford, J. H.: Application of OMI observations to a space-based indicator of NOxand VOC controls on surface ozone
Fehsenfeld, F. C., Dickerson, R. R., Hubler, G., Luke, W. T., Nun-nermacker, L. J., Williams, E. J., Roberts, J. M., Calvert, J. G., Curran, C. M., Delany, A. C., Eubank, C. S., Fahey, D. W., Fried, A., Gandrud, B. W., Langford, A. O., Murphy, P. C., Nor-ton, R. B., Pickering, K. E., and Ridley, B. A.: A Ground-Based Intercomparison of NO, NOx, and NOy Measurement
Tech-niques, J. Geophys. Res., 92, 14710–14722, 1987.
Fiore, A. M., Jacob, D. J., Logan, J. A., and Yin, J. H.: Long-term trends in ground level ozone over the contiguous United States, 1980–1995, J. Geophys. Res., 103, 1471–1480, 1998.
Flynn, C. M., Pickering, K. E., Crawford, J. H., Lamsal, L. N., Krotkov, N. A., Herman, J., Weinheimer, A., Chen, G., Liu, X., Szykman, J., Tsay, S. C., Laughner, C. P., Hains, J., Lee, P., Dick-erson, R. R., Stehr, J. W., and Brent, L.: The relationship between column-density and surface mixing ratio: statistical analysis of O3and NO2data from the July 2011 Maryland DISCOVER-AQ mission, Atmos. Environ., 92, 429–441, 2014.
Fujita, E. M., Campbell, D. E., Stockwell, W. R., and Lawson, D. R.: Past and future ozone trends in California’s South Coast Air Basin: reconciliation of ambient measurements with past and projected emission inventories, J. Air Waste Manage., 63, 54–69, 2013.
Gego, E., Porter, P. S., Gilliland, A., and Rao, S. T.: Observation-based assessment of the impact of nitrogen oxides emissions re-ductions on ozone air quality over the eastern United States, J. Appl. Meteorol. Clim., 46, 994–1008, 2007.
Gilliland, A. B., Hogrefe, C., Pinder, R. W., Godowitch, J. M., Fo-ley, K. L., and Rao, S. T.: Dynamic evaluation of regional air quality models: assessing changes in O3stemming from changes in emissions and meteorology, Atmos. Environ., 42, 5110–5123, 2008.
Godowitch, J. M., Hogrefe, C., and Rao, S. T.: Diagnostic anal-yses of a regional air quality model: changes in modeled pro-cesses affecting ozone and chemical-transport indicators from NOx point source emission reductions, J. Geophys. Res., 113,
D19303, doi:10.1029/2007JD009537, 2008a.
Godowitch, J. M., Gilliland, A. B., Draxler, R. R., and Rao, S. T.: Modeling assessment of point source NOx emission reductions
on ozone air quality in the eastern United States, Atmos. Envi-ron., 42, 87–100, 2008b.
Goldberg, D. L., Loughner, C. P., Tzortziou, M., Stehr, J. W., Pick-ering, K. E., Marufu, L. T., and Dickerson, R. R.: Higher surface ozone concentrations over the Chesapeake Bay than over the
ad-using a clustering technique, Atmos. Environ., 42, 1727–1741, 2008.
Han, K. M., Lee, S., Chang, L. S., and Song, C. H.: A compar-ison study between CMAQ-simulated and OMI-retrieved NO2 columns over East Asia for evaluation of NOxemission fluxes of
INTEX–B, CAPSS, and REAS inventories, Atmos. Chem. Phys., 15, 1913–1938, doi:10.5194/acp-15-1913-2015, 2015.
He, H., Hembeck, L., Hosley, K. M., Canty, T. P., Salawitch, R. J., and Dickerson, R. R.: High ozone concentrations on hot days: the role of electric power demand and NOxemissions, Geophys.
Res. Lett., 40, 5291–5294, 2013a.
He, H., Stehr, J. W., Hains, J. C., Krask, D. J., Doddridge, B. G., Vinnikov, K. Y., Canty, T. P., Hosley, K. M., Salawitch, R. J., Worden, H. M., and Dickerson, R. R.: Trends in emissions and concentrations of air pollutants in the lower troposphere in the Baltimore/Washington airshed from 1997 to 2011, Atmos. Chem. Phys., 13, 7859–7874, doi:10.5194/acp-13-7859-2013, 2013b.
He, H., Loughner, C. P., Stehr, J. W., Arkinson, H. L. Brent, L. C., Follette-Cook, M. B., Tzortziou, M. A. Pickering, K. E., Thomp-son, A. M., Martins, D. K., Diskin, G. S., AnderThomp-son, B. E., Craw-ford, J. H., Weinheimer, A. J., Lee, P., Hains, J. C., and Dicker-son, R. R.: An elevated reservoir of air pollutants over the Mid-Atlantic States during the 2011 DISCOVER-AQ campaign: air-borne measurements and numerical simulations, Atmos. Envi-ron., 85, 18–30, doi:10.1016/j.atmosenv.2013.11.039, 2014. Hogrefe, C., Isukapalli, S. S., Tang, X. G., Georgopoulos, P. G.,
He, S., Zalewsky, E. E., Hao, W., Ku, J. Y., Key, T., and Sistla, G.: Impact of biogenic emission uncertainties on the simulated re-sponse of ozone and fine particulate matter to anthropogenic emission reductions, J. Air Waste Manage., 61, 92–108, 2011. Horowitz, L. W., Fiore, A. M., Milly, G. P., Cohen, R. C.,
Per-ring, A., Wooldridge, P. J., Hess, P. G., Emmons, L. K., and Lamarque, J.: Observational constraints on the chemistry of iso-prene nitrates over the eastern United States, J. Geophys. Res., 112, D12S08, doi:10.1029/2006JD007747, 2007.
Jacobson, M. Z., Wilkerson, J. T., Naiman, A. D., and Lele, S. K.: The effects of aircraft on climate and pollution. Part II: 20-year impacts of exhaust from all commercial aircraft worldwide treated individually at the subgrid scale, Faraday Discuss., 165, 369–381, 2013.
Philip, S., Irie, H., Cede, A., Herman, J., Weinheimer, A., Szyk-man, J. J., and Knepp, T. N.: Evaluation of OMI operational standard NO2column retrievals using in situ and surface-based NO2 observations, Atmos. Chem. Phys., 14, 11587–11609, doi:10.5194/acp-14-11587-2014, 2014.
Leucken, D. and Schwede, D.: Improving the treatment of oxidized nitrogen in CMAQ influence of gas phase chemical and physical parameterizations, talk presented at: Community Modeling and Analysis System conference, Friday Center, UNC-Chapel Hill, USA, 2014.
Li, G., Zhang, R., Fan, J., and Tie, X.: Impacts of biogenic emis-sions on photochemical ozone production in Houston, Texas, J. Geophys. Res., 112, D10309, doi:10.1029/2006JD007924, 2007. Lockwood, A. L., Shepson, P. B., Fiddler, M. N., and Alagh-mand, M.: Isoprene nitrates: preparation, separation, identifica-tion, yields, and atmospheric chemistry, Atmos. Chem. Phys., 10, 6169–6178, doi:10.5194/acp-10-6169-2010, 2010.
Logan, J. A.: Ozone in rural-areas of the United States, J. Geophys. Res., 94, 8511–8532, 1989.
Loughner, C. P., Allen, D. J., Pickering, K. E., Zhang, D. L., Shou, Y. X., and Dickerson, R. R.: Impact of fair-weather cumu-lus clouds and the Chesapeake Bay breeze on pollutant transport and transformation, Atmos. Environ., 45, 4060–4072, 2011. Luke, W. T., Dickerson, R. R., and Nunnermacker, L. J.: Direct
measurements of the photolysis rate coefficients and Henry Law constants of several alkyl nitrates, J. Geophys. Res., 94, 14905– 14921, 1989.
Marufu, L. T., Taubman, B. F., Bloomer, B., Piety, C. A., Dod-dridge, B. G., Stehr, J. W., and Dickerson, R. R.: The 2003 North American electrical blackout: an accidental experiment in atmospheric chemistry, Geophys. Res. Lett., 31, L13106, doi:10.1029/2004GL019771, 2004.
Mollner, A. K., Valluvadasan, S., Feng, L., Sprague, M. K., Oku-mura, M., Milligan, D. B., Bloss, W. J., Sander, S. P., Mar-tien, P. T., Harley, R. A., McCoy, A. B., and Carter, W. P. L.: Rate of Gas Phase Association of Hydroxyl Radical and Nitrogen Dioxide, Science, 330, 646–649, doi:10.1126/science.1193030, 2010.
Müller, J.-F., Peeters, J., and Stavrakou, T.: Fast photolysis of car-bonyl nitrates from isoprene, Atmos. Chem. Phys., 14, 2497– 2508, doi:10.5194/acp-14-2497-2014, 2014.
Napelenok, S. L., Pinder, R. W., Gilliland, A. B., and Mar-tin, R. V.: A method for evaluating spatially-resolved NOx
emissions using Kalman filter inversion, direct sensitivities, and space-based NO2observations, Atmos. Chem. Phys., 8, 5603– 5614, doi:10.5194/acp-8-5603-2008, 2008.
Neff, J., Holland, E., Dentener, F., McDowell, W., and Russell, K.: The origin, composition and rates of organic nitrogen deposition: a missing piece of the nitrogen cycle?, Biogeochemistry, 57–58, 99–136, 2002.
Paulot, F., Crounse, J. D., Kjaergaard, H. G., Kroll, J. H., Sein-feld, J. H., and Wennberg, P. O.: Isoprene photooxidation: new insights into the production of acids and organic nitrates, At-mos. Chem. Phys., 9, 1479–1501, doi:10.5194/acp-9-1479-2009, 2009.
Perring, A. E., Bertram, T. H., Wooldridge, P. J., Fried, A., Heikes, B. G., Dibb, J., Crounse, J. D., Wennberg, P. O., Blake, N. J., Blake, D. R., Brune, W. H., Singh, H. B., and Cohen, R. C.: Airborne observations of total RONO2: new
constraints on the yield and lifetime of isoprene nitrates, At-mos. Chem. Phys., 9, 1451–1463, doi:10.5194/acp-9-1451-2009, 2009.
Perring, A. E., Bertram, T. H., Farmer, D. K., Wooldridge, P. J., Dibb, J., Blake, N. J., Blake, D. R., Singh, H. B., Fuelberg, H., Diskin, G., Sachse, G., and Cohen, R. C.: The production and persistence of 6RONO2 in the Mexico City plume, Atmos. Chem. Phys., 10, 7215–7229, doi:10.5194/acp-10-7215-2010, 2010.
Perring, A. E., Pusede, S. E., and Cohen, R. C.: An observational perspective on the atmospheric impacts of alkyl and multifunc-tional nitrates on ozone and secondary organic aerosol, Chem. Rev., 113, 5848–5870, doi:10.1021/cr300520x, 2013.
Pollack, I. B., Ryerson, T. B., Trainer, M., Neuman, J. A., Roberts, J. M., and Parrish, D. D.: Trends in ozone, its precursors, and related secondary oxidation products in Los Angeles, Cali-fornia: a synthesis of measurements from 1960 to 2010, J. Geo-phys. Res., 118, 5893–5911, 2013.
Ren, X., Van Duin, D., Cazorla, M., Chen, S., Brune, W. H., Flynn, J. H., Grossberg, N., Lefer, B. L., Rappengluck, B., Wong, K. W., Tsai, C., Stutz, J., Dibb, J. E., Jobson, B. T., Luke, W., and Kelley, P.: Atmospheric oxidation chemistry and ozone production: results from SHARP 2009 in Houston, Texas, J. Geophys. Res., 118, 5770–5780, doi:10.1002/jgrd.50342, 2103.
Russell, A. R., Perring, A. E., Valin, L.‘C., Bucsela, E. J., Browne, E. C., Wooldridge, P. J., and Cohen, R. C.: A high spa-tial resolution retrieval of NO2 column densities from OMI: method and evaluation, Atmos. Chem. Phys., 11, 8543–8554, doi:10.5194/acp-11-8543-2011, 2011.
Ryan, W. F., Doddridge, B. G., Dickerson, R. R., Morales, R. M., Hallock, K. A., Roberts, P. T., Blumenthal, D. L., Ander-son, J. A., and Civerolo, K. L.: Pollutant transport during a re-gional O3episode in the mid-Atlantic states, J. Air Waste Man-age., 48, 786–797, 1998.
Sander, S. P. , Friedl, R. R., Golden, D. M., Kurylo, M. J., Moort-gat, G. K., Keller-Rudek, H., Wine, P. H., Ravishankara, A. R., Kolb, C. E., Molina, M. J., Finlayson-Pitts, B. J., Huie, R. E., and Orkin, V. L.: Chemical Kinetics and Photochemical Data for Use in Atmospheric Studies, JPL Publication 06-2, Evaluation no. 15, 2006.
Stavrakou, T., Müller, J.-F., Boersma, K. F., van der A, R. J., Kurokawa, J., Ohara, T., and Zhang, Q.: Key chemical NOx
sink uncertainties and how they influence top-down emis-sions of nitrogen oxides, Atmos. Chem. Phys., 13, 9057–9082, doi:10.5194/acp-13-9057-2013, 2013.
Taubman, B. F., Marufu, L. T., Piety, C. A., Doddridge, B. G., Stehr, J. W., and Dickerson, R. R.: Airborne characterization of the chemical, optical, and meteorological properties, and origins of a combined ozone/haze episode over the eastern US, J. Atmos. Sci., 61, 1781–1793, 2004.
Taubman, B. F., Hains, J. C., Thompson, A. M., Marufu, L. T., Doddridge, B. G., Stehr, J. W., Piety, C. A., and Dicker-son, R. R.: Aircraft vertical profiles of trace gas and aerosol pollution over the mid-Atlantic United States: statistics and me-teorological cluster analysis, J. Geophys. Res., 111, D10S07, doi:10.1029/2005JD006196, 2006.
2
for the year 2000, Atmos. Chem. Phys., 6, 2943–2979, 2006, doi:10.5194/acp-6-2943-2006, 2006.
Vinken, G. C. M., Boersma, K. F., van Donkelaar, A., and Zhang, L.: Constraints on ship NOx emissions in Europe using GEOS–
Chem and OMI satellite NO2observations, Atmos. Chem. Phys., 14, 1353–1369, doi:10.5194/acp-14-1353-2014, 2014.
Walsh, K. J., Milligan, M., Woodman, M., and Sherwell, J.: Data mining to characterize ozone behavior in Baltimore and Wash-ington, DC, Atmos. Environ., 42, 4280–4292, 2008.
Wilson, R. C., Fleming, Z. L., Monks, P. S., Clain, G., Henne, S., Konovalov, I. B., Szopa, S., and Menut, L.: Have primary emis-sion reduction measures reduced ozone across Europe? An anal-ysis of European rural background ozone trends 1996–2005, At-mos. Chem. Phys., 12, 437–454, doi:10.5194/acp-12-437-2012, 2012.
ing the 2004 ICARTT study, Atmos. Chem. Phys., 10, 3001– 3025, doi:10.5194/acp-10-3001-2010, 2010.
Yu, S. C., Mathur, R. Pleim, J., Pouliot, G., Wong, D., Eder, B., Schere, K., Gilliam, R., and Rao, S. T.: Comparative evaluation of the impact of WRF-NMM and WRF-ARW meteorology on CMAQ simulations for O3and related species during the 2006 TexAQS/GoMACCS campaign, Atmos. Pollut. Res., 3, 149–162, doi:10.5094/APR.2012.015, 2012.
Zhou, W., Cohan, D. S., and Napelenok, S. L.: Reconciling NOx