The Role of Compensatory Mutations
in the Emergence of Drug Resistance
Andreas Handel*, Roland R. Regoes¤, Rustom Antia
Department of Biology, Emory University, Atlanta, Georgia, United States of America
Pathogens that evolve resistance to drugs usually have reduced fitness. However, mutations that largely compensate for this reduction in fitness often arise. We investigate how these compensatory mutations affect population-wide resistance emergence as a function of drug treatment. Using a model of gonorrhea transmission dynamics, we obtain generally applicable, qualitative results that show how compensatory mutations lead to more likely and faster resistance emergence. We further show that resistance emergence depends on the level of drug use in a strongly nonlinear fashion. We also discuss what data need to be obtained to allow future quantitative predictions of resistance emergence.
Citation: Handel A, Regoes RR, Antia R (2006) The role of compensatory mutations in the emergence of drug resistance. PLoS Comput Biol 2(10): e137. DOI: 10.1371/journal. pcbi.0020137
Introduction
Drug-resistant pathogens are found at an alarming rate and few replacement drugs are in sight, suggesting a rapidly increasing public health problem [1–6]. There exists broad consensus that prudent use of antibiotics and antivirals is of critical importance to stop or at least reduce emergence of drug resistance.
Theoretical between-Host Studies of Drug Resistance
A number of theoretical between-host studies have provided some insights into prudent drug use. Both pop-ulation-genetic [7–9] as well as epidemiological [10,11] studies analyzed the relationship between drug use and levels of resistance for the community at large. Further studies focused on specific scenarios, such as hospital settings [12,13], the interaction between hospitals and the community [14], and influences of animal reservoirs [15]. Other studies inves-tigated drug resistance for specific pathogens, such as malaria [16], HIV [17,18], HSV [19,20], multidrug-resistant tuber-culosis [21,22], and influenza [23,24]. Results obtained from these and other studies have led to an improved under-standing of the relation between drug use and resistance emergence. In these studies, it is assumed that in the absence of drugs, the resistant pathogen strain is less fit than the sensitive strain. Drug treatment reduces the fitness of the sensitive strain, which leads to potential resistance emer-gence. What is not considered is the ability of the resistant pathogen to regain some or most of its fitness through compensatory mutations.
Experimental within-Host Studies of Compensatory Mutations
Compensatory mutations have been found to play an important role in the evolution of pathogens [25–27]. In vitro studies of streptomycin-resistantEscherichia colifound that the cost associated with resistance was quickly reduced by compensatory mutations, and these compensatory mutations can occur in both the presence and absence of the drug [28– 30]. Subsequent studies found that compensatory mutations were also important in vivo. Studies passaging drug-resistant Salmonella typhimuriumthrough mice led to the emergence of
strains with increased fitness that retained resistance [31,32]. Further studies suggested that compensatory mutations might play a role for the evolution of resistance in Mycobacterium tuberculosis [33,34], Streptococcus pneumoniae[35], Staphylococcus aureus[36], and the yeast Candida albicans [37]. These and other studies suggest that compensatory mutations play a potentially important role in the evolution of resistance.
Combining Compensatory Mutations and Epidemiological Models
Despite the importance of compensatory mutations for the process of resistance emergence, we are aware of only one population-genetic study investigating the effect of compen-satory mutations on the interplay between drug (pesticide) use and resistance [38]. Epidemiological models that include compensatory mutations currently do not exist. To our knowledge, our study is the first one to include compensatory mutations into a between-host epidemiological model of resistance emergence.
Ideally, we would like to study a system for which we can obtain quantitative predictions. Unfortunately, despite the existing studies on compensatory mutations, no host–patho-gen system currently exists—as far as we are aware—for which such quantitative predictions could be made. There is simply not enough data available to allow estimation of all the parameters that are needed to quantitatively describe the process of population-wide resistance emergence.
Editor: Eddie C. Holmes, The Pennsylvania State University, United States of America
ReceivedNovember 22, 2005;AcceptedAugust 29, 2006;PublishedOctober 13, 2006
DOI:10.1371/journal.pcbi.0020137
Copyright:Ó2006 Handel et al. This is an open-access article distributed under the terms of the Creative Commons Attribution License, which permits unrestricted use, distribution, and reproduction in any medium, provided the original author and source are credited.
Currently missing are estimates for the between-host fitness levels of resistant mutants. In epidemiological models, the between-host fitness of a pathogen can be defined through the basic reproductive number R0, the number of secondary infections caused by one infected host introduced into a fully susceptible population [39,40]. In contrast, within-host studies such as compensatory mutation studies measure fitness through in vitro or in vivo growth rates. While a connection can be made between a pathogen’s within-host dynamics and its ability to transmit and infect hosts [41], it is currently not known how within-host fitness measured by pathogen growth rates translate into between-host fitness measured byR0.
Also unknown are the rates at which hosts infected with one pathogen strain‘‘convert’’to hosts infected with another strain. Each pathogen has a certain probability of undergoing mutations. Provided that a mutation confers a competitive advantage, the mutant can outgrow the other pathogens within an infected host. Once the mutant strain dominates, one can consider the infected host as having‘‘converted.’’(As we will discuss at the end of this article, assuming that a host is completely dominated by only one strain at a time is probably an oversimplification.) The rates of conversion depend on both the mutation rates and the dynamics of the different strains within a given host. A recent study provides estimates for the probability that a host commensally infected withHelicobacter pyloriis taken over by a newly arising mutant [42]. However, the results only apply under very restricted conditions. While estimates of compensatory mutation rates exist, for instance forS. typhimurium[43], no clear connection has been established between these mutation rates and the rates at which a host is converted from being infected with one strain to being infected with another strain.
Last, it is also not known what routes of compensatory mutation a pathogen can undergo in a clinically relevant in vivo setting. One study showed thatS. typhimuriumcan follow different routes of compensatory mutations in vitro and in vivo [32]. In principle, these routes could be a single linear
pathway or there could be multiple routes with multiple possibilities for compensatory mutations to increase fitness.
The current lack of data for these three quantities— between-host fitness levels, rates of conversion, and routes of compensatory mutations—unfortunately limits the predictive power of any model. Nevertheless, one can gain important qualitative insights into how compensatory mutations influ-ence the dynamics of resistance emerginflu-ence. This is the main point of our current study.
In the absence of good estimates for all the necessary parameters, we consider a pathogen for which most param-eters are well-defined, and then we investigate how changes in the unknown parameters influence the results. To that end, we study a between-host model for gonorrhea transmission dynamics. Many of the parameters defining the transmission dynamics of gonorrhea infections are rather well-known [44– 47]. This allows us to study how the unknown parameters related to compensatory mutations affect the emergence of resistance. Additionally, many strains ofNeisseria gonorrhoeae, the pathogen causing gonorrhea, have been found to be resistant to antibiotics such as penicillins, tetracyclines, and quinolones [48,49]. While the pathogen is still mostly susceptible to third-generation cephalosporins, it is likely to be just a matter of time before resistance reaches levels that render this class of drugs ineffective. Therefore, gonorrhea is a pathogen for which resistance studies are needed to help inform public health policy.
Materials and Methods
The dynamics of gonorrhea transmission has been analyzed in detail [44–47]. One of the findings from these studies is the concept of core groups [44]. Core groups are broadly defined as subsets of the population in which the disease can persist, even if it cannot persist in the rest of the population. For gonorrhea, core groups consist of sexually active high-risk individuals. Since core groups are most likely the‘‘breeding ground’’for resistance, we focus on such a group.
The Model
We include four different pathogen strains in our model, namely a drug-sensitive strain, a resistant mutant, and two
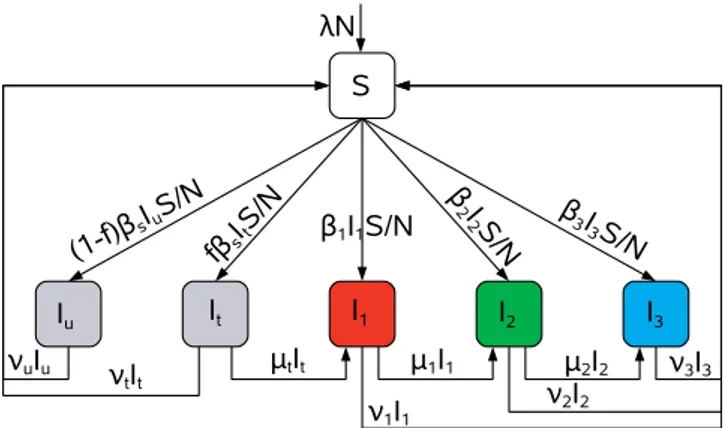
Figure 1. Flow Diagram of the Compartmental Model Describing
Gonorrhea Transmission within a Homogenous Core Group
Not shown are the flows out of each compartment at ratek. Table 1 summarizes the variables and parameters. A detailed explanation of the model is given in the text.
DOI: 10.1371/journal.pcbi.0020137.g001
Synopsis
further resistant mutants that have undergone compensatory mutations and thereby regained some of the fitness that was lost in the resistance mutation. The model is given by Equation 1, a flow diagram of the model is shown in Figure 1, and Table 1 summarizes the variables and parameters of the system.
S_¼kNkSþX 3
i¼1
ðbiþmiÞIi
S
NðbsIuþbsItþmuIuþmtItÞ
I_u¼ ð1fÞ S
NbsðIuþItÞ ðkþmuÞIu
I_t¼f S
NbsðIuþItÞ ðkþmtþltÞIt ð1Þ
I_1¼ltItþ ð S
Nb1km1l1ÞI1
I_2¼l1I1þ ð S
Nb2km2l2ÞI2
I_3¼l2I2þ ð S
Nb3kI3m3ÞI3:
The details of the model are as follows. We consider a homogeneous core group of sexually highly active people 15– 39 years of age. New susceptible individualsSenter the group by turning 15 years old and becoming sexually active, and leave the group by turning 40, which can be seen as a proxy for becoming sexually less active. This gives an entry and exit rate of k ¼ 1
25y
1. Gonorrhea does not cause significant
mortality, and the general death rate is low in persons aged 15–39, therefore we ignore deaths.
Susceptible individuals can become infected through sexual interactions with infected persons at a rate determined by the transmission parameters for the different pathogen strainsbs,b1,b2,b3. We assume that there are no differences in transmission between treated and untreated individuals; treatment only reduces the duration of infection. We specify the transmission parameters through the between-host fitness
as measured by the basic reproductive numberR0(Equation 3). We choose the basic reproductive number for the sensitive strain to beRs
0¼2, corresponding to a 50% prevalence in the
absence of treatment. Such a high prevalence might occur in certain core groups; for instance, among commercial sex workers. Fitness levels for the resistant strains are chosen at intermediate values such that 1,R10,R20,R30,Rs0. As
mentioned earlier, values for the between-host fitness levels are not known. In a recent study of M. tuberculosis isolated from patients, relative within-host fitness levels between 50% and 100% were reported [34]. While keeping in mind the difficulties of comparing within-host fitness measured by pathogen growth rates and between-host fitness measured by R0, we use these within-host values as a guideline and choose the between-host fitness for the different resistant strains to be between 60% and 95% that of the sensitive strain.
Some infecteds, Iu, do not receive treatment and remain infectious for six months [44,45]. A fractionfof infecteds,It, receive treatment and clear the infection after one month. Since N. gonorrhoeae undergoes constant antigenic changes, hosts that clear the infection do not become protected against reinfection and therefore return to the susceptible pool. Instead of recovering, some treated hosts evolve resistance at rateltand convert toI1. Since we assume that treatment has no effect on hosts infected with the resistant strains, the duration of infection is the same as those of the untreated hosts. The first and second resistant strains can evolve further to convert to the second and third resistant strains at ratesl1 andl2, respectively. As mentioned above, clinically relevant routes of compensatory mutation are not known for any pathogen. Here we choose the simple linear pathwayI1!I2!I3, with each mutation leading to a strain with increased between-host fitness. Also not known are the rates at which hosts can convert from being dominated by one strain to being dominated by another strain. While it was found in experiments that compensatory mutations are more frequent than mutations resulting in resistance [30], the fitness advantage of a resistance mutation in the presence of drug is likely larger than that of a compensatory mutation. It is not clear how these two effects (and potentially others) influence the overall rates of conversion. We therefore Table 1.Variables and Parameters of the Model
Symbol Meaning Values
S Susceptible hosts NA
Iu Untreated hosts infected with the sensitive strain NA
It Treated hosts infected with the sensitive strain NA
I1,I2,I3 Hosts infected with resistant mutants NA
N Population size 10,000
f Fraction of infecteds receiving treatment 0–1
k Entry and exit rate into the modeled population 1/25 y1
mu,m1,m2,m3 Recovery rate of untreated and resistant infecteds (infection duration of six
months)
2 y1
mt Recovery rates of treated infecteds (infection duration one month) 12 y1
lt,l1,l2 Rates of conversion between strains 106101
bs,b1,b2,b3 Transmission parameters for sensitive and resistant strains Given by Equation 3
Rs
0 Basic reproductive number of susceptible strain (in the absence of treatment) 2
R1 0;R
2 0;R
3
0 Basic reproductive numbers of resistant strains 1.21.9
NA, not applicable.
assume for most of our study that all conversion rates are equal, i.e.,lt¼l1¼l2. We additionally choose values for the conversion rates between 106and 101. We investigate how changes in the conversion rates affect the results.
Figure 2 summarizes the basic dynamics of resistance emergence for our model. The bars indicate the between-host fitness levels as measured byR0for the sensitive and resistant pathogen strains. All strains are assumed to have a fitness of R0.1. The sensitive strain can mutate to a resistant strain with strongly reduced fitness. Due to competition between the strains, a given resistant strain can only invade if its fitness is larger than that of the sensitive strain. Therefore, for all but the highest levels of treatment, once the resistant strain is created, it is outcompeted and goes extinct. However, while stuttering to extinction, the resistant strain can undergo further compensatory mutations and thereby increase in fitness. Once the level of fitness is above that of
the sensitive strain, the resistant strain can emerge. The level of drug use determines which of the resistant strains can invade.
Analysis of the Model
Gonorrhea is thought to persist in the population in an endemic state [44], which can be well described by the steady state values of the mathematical model. In the absence of resistant strains, the steady state values are found to be
^
S¼Nctcu bsw ;
^
Iu¼
Nð1fÞkctv bswu
; ð2Þ
^
It¼ Nfkcuv
bswu
;
where we introduced the abbreviationscu¼kþmu,ct¼kþmtþ
lt,u¼ctkþcufkþcuflt–ctfk,v¼ctbsctcubsctfþbscuf, and w ¼ ct – ctf þ fcu. The between-host fitness levels of the different strains are given by their basic reproductive numbers
Rs0¼bs 1f
cu
þf ct
; R
i 0¼
bi ci
; ð3Þ
for the sensitive strain and the i¼ 1,2,3 resistant strains, respectively. We definedc1¼kþm1þl1andc2¼kþm2þl2.
The relative fitness of the resistant strains compared with the sensitive strain can be defined as
^
Ri¼ Ri
0 Rs 0
; i¼1;2;3 ð4Þ
The dynamics of the resistant strains can be computed if we assume that during the process of resistance emergence, the endemic steady state does not change. This is a good approximation if the resistant strains are at a low level, which corresponds to the initial phase of resistance emer-gence that we consider here. If we assume that the system is at steady state and that initially no resistant pathogens are present, we find the explicit expressions forI1(t),I2(t), andI3(t) to be
I1ðtÞ ¼Qg1 r1 ;
I2ðtÞ ¼Ql1ðg1r2g2r1Þ
r1r2ðr1r2Þ ; ð5Þ
I3ðtÞ ¼ Ql1l2ðf1þf2þf3Þ r1r2r3ðr1r2Þðr1r3Þðr2r3Þ;
with the abbreviations Q¼lt^It, ri¼ ðRi^ 1Þci, gi¼erit1,
f1¼g1ðr22r3r2r32Þ,f2¼g2ðr1r32r21r3Þ, andf3¼g3ðr21r2r1r22Þ.
Qis the rate at which resistant mutants are introduced. If the fitness of resistant strainiat treatment levelfis below that of the sensitive strain, the values of Ri^ are smaller than one, resulting inri,0 and equilibrium values for the populationsIi, given by
I1¼ Q jr1j; I2¼
Ql1 jr1r2j; I3¼
Ql1l2
jr1r2r3j ð6Þ
These equilibrium values correspond to a dynamic balance between influx of resistant mutantsQand extinction due to being outcompeted by the sensitive strain. If the fitness of a
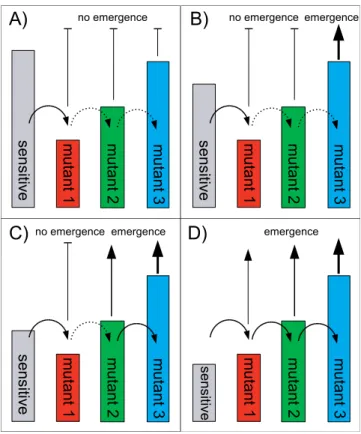
Figure 2.The Process of Resistance Emergence
The bars indicate between-host fitness levels of the different strains. Solid curved arrows show conversion events that occur frequently due to large or expanding source populations.
Dashed arrows show conversion events that occur infrequently due to small source populations.
(A) Without treatment, all resistant strains are less fit than the sensitive strain. Therefore, resistance emergence is not possible.
(B) Treatment of a small fraction of the population reduces fitness of the sensitive strain enough to allow for emergence of the fittest resistant strain. For that to happen, one frequent and two rare conversions need to occur.
(C) Further increase in treatment level allows both the second and third resistant strains to emerge. For the second resistant strain to emerge, one frequent and one rare conversion need to occur. Subsequently, the third resistant strain is rapidly generated and will outcompete all other strains.
given resistant strain at treatment levelfexceeds that of the sensitive strain, the correspondingRi^ is greater than one and exponential growth occurs. In this case, the timeTiat which the populationIihas reached a certain levelLis given by the implicit equation
IiðTiÞ ¼L ð7Þ
One can obtain an explicit expression forT1. For the times T2andT3, the equation needs to be solved numerically once the level of resistanceLhas been specified.
We also study a stochastic version of the model (Equation 1). In the stochastic version of the model, the rate parameters of the deterministic model become probabilities that a given event happens. We can obtain the probability of and time-to-resistance emergence using a branching process formalism [50–53]. In our model, the relative fitnessRi^ associated with each resistant strain represents the mean number of secon-dary infections. SinceRi^ is given in units of generation time, we need to rescale the conversion rates accordingly by definingl9i¼
li
ci. Following the formalism described in detail in [53], we find that for our three-strain model, the probability of emergence for a single resistance introduction is
p¼1þaþcþ
ffiffiffiffiffiffiffiffiffiffiffiffiffiffiffiffiffiffiffiffiffiffiffiffiffiffiffiffiffiffiffiffiffiffiffiffiffiffiffiffiffiffiffiffiffiffiffiffiffiffiffi
ð1þaÞ22ða1Þcþc2 q
2a ð8Þ
witha¼R^1ðl911Þandc¼l91R^1p92, and the probabilityp92 is again given by Equation 8 with a¼R^2ðl921Þ and
c¼l92R^2ð1 1
^
R3
Þ. Combining the result for p with the number of introductions Q leads to the probability of emergence insyears
Ps¼1 ð1pÞQs ð9Þ
Results
The Rate of Resistance Introductions
We consider a scenario where the infection is at an endemic equilibrium, which is believed to be the case for gonorrhea
[44]. In the absence of any resistant strains, we obtain from the deterministic model the steady state values S, Iˆ^ u, and Iˆt (Equation 2). At steady state, hosts infected with the resistant strain are introduced at a rateQ¼utIˆt. Figure 3 shows the number of introductions per year as a function of f. As f increases, the fraction of treated hosts increases. At the same time, treatment reduces the total number of infected hosts. Competition between these two effects determines the shape ofIˆt,and therebyQ,as a function off. In general, the number of introductions is zero atf¼0 and at some levelf*, at which treatment drives the pathogen to extinction. The maximum number of introductions is found for some intermediate value offand depends on the parameters of the system.
Time to Emergence for the Deterministic Model
A first guess might suggest that one should try to minimize the number of introductions Q to maximize the time until resistance emerges. However, the whole process of resistance emergence also depends on the competition of the sensitive and resistant strains. If the relative fitness of a resistant strain is below that of the sensitive strain, the resistant strain will only be present at a low mutation–selection level (Equation 6). While it can convert to a fitter, compensated mutant (corresponding to the dashed arrows in Figure 2), it cannot emerge. Population-wide emergence of a resistant strain can only happen if its between-host fitness (R0) is larger than that of the sensitive strain. If emergence is possible, one can compute approximations for the times at which resistant strainIreaches a specified levelL(Equation 7). In line with epidemiological considerations for gonorrhea [49], we choose Las 5% of the total number of infecteds. One finds that the time to emergence not only depends on the rate of introductions Q, but also on the relative fitness of the sensitive compared with the resistant strain. While Q can either increase or decrease with increasing treatment, the relative fitness of the resistant strains always increases with treatment. Because this latter effect turns out to be the more important one, increases in treatment level directly lead to decreases in the time to emergence, as seen in Figure 4.
Probability of Emergence for the Stochastic Model
The results shown in Figure 4 are obtained using a deterministic model. Deterministic models provide good approximations when the populations as well as the rate parameters are not too small. In the deterministic model, every resistant strain gets seeded att¼0 at a level depending on the conversion rates and then grows or decays in an exponential fashion, depending on its relative fitness com-pared with the sensitive strain (Equation 5). However, since the rates of conversion and levels of resistant strains are small, stochasticity can lead to extinction of newly created resistant mutants, until finally one of them takes hold and grows in an essentially deterministic fashion. It is not clear how well the deterministic model can describe the underlying stochastic process, making comparison with a stochastic model necessary. We again consider the endemic scenario. Using a branching process formalism [50–53], we can compute the probability p that a single introduction of a resistant strain leads to population-wide resistance emer-gence (Equation 8), and from that we can estimate the overall probability of emergence (Equation 9). Figure 5 shows P1, the probability of emergence within one year, as a function of the
Figure 3.Number of IntroductionsQ¼ltIˆtper Year
Parameter choices are described in the text and in Table 1. Note that above a certain level of treatment, indicated byf*, the basic reproductive number for the sensitive strain isRs
0,1, which makes the endemic steady state unsustainable and leads to disease extinction. In this study, we only consider the endemic situation with 0f,f*.
level of treatment f. We also show results obtained from stochastic simulations, utilizing the well-known Gillespie algorithm [54–56].
Time to Emergence for the Stochastic Model
We can use the expression obtained for the probability of emergence to estimate the time until emergence occurs. If the probability that a single introduction leads to emergence isp, then on average 1/p introductions are needed for certain emergence. Because each introduction occurs on average after time 1/Q, the time it takes until a process starts to emerge is of order 1
pQ. To get an estimate for the total time it takes for a resistant strain to reach a levelL,we can add the deterministic timeTiobtained earlier (Equation 7) and find
^
Ti¼ 1
pQþTi. The result shows that ifpQis of order one, the deterministic and stochastic results are expected to give similar results. However, as Figures 3 and 5 show,pQcan be significantly less than one, especially for low treatment levels and small conversion probabilities. Therefore, the stochastic component can contribute significantly to the overall time to emergence. Figure 6 shows Ti^ together with results from stochastic simulations. For comparison, we also show the time to emergence obtained earlier from the deterministic model.
Dependence of Time to Emergence on the Model Parameters
We end our analysis by briefly studying how changes in the number of resistant strains, levels of fitness, and conversion
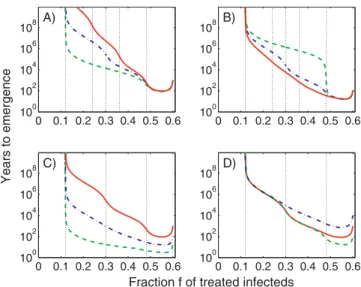
probabilities influence the results. Some examples are shown in Figure 7. Figure 7A confirms the expectation that if more compensatory mutation steps are required to achieve a certain level of fitness, the time to resistance emergence increases. Figure 7B shows how differences in conversion rates and number of compensatory mutation steps influence the time to emergence. It also shows that for small conversion probabilities, small changes in the level of treatment can result in significant changes in the emergence time. Figure 7C shows that for a fixed number of mutation steps, smaller conversion probabilities lead to an increase in time until resistance emerges. Figure 7D shows that even if the number of compensatory steps as well as the product of all conversion probabilities is kept fixed, one obtains varying results for the emergence time, depending on the values of the conversion probabilities.
Discussion
Before we discuss in detail the results, we want to stress that while we chose a model and parameters to describe gonorrhea transmission dynamics, the qualitative results we obtained are not limited to gonorrhea and should hold for other diseases as well.
Implications of Results
While not unexpected, our first and arguably most important finding is that compensatory mutations signifi-cantly influence the process of resistance emergence. With the inclusion of compensatory mutations, it is possible that a nonfit resistant strain undergoes further mutations before it goes extinct, until it has regained enough fitness to be able to compete with the sensitive strain (see Figure 2). As an
Figure 5.Probability That Resistance Emerges within One Year
The black diamonds show the probability that any one of the resistant strains emerges (reaches a level of 5% of total infecteds), obtained from stochastic simulations of the full system (stochastic version of Equation 1). The red dashed, green dash-dotted, and blue solid lines show the analytic result (Equation 9 withs¼1). The vertical black lines indicate the level of treatment at which the fitness of the respective resistant strain is the same as that of the sensitive strain. Parameters are chosen as in Figure 4.
DOI: 10.1371/journal.pcbi.0020137.g005
Figure 4.Years until Resistance Emerges—Deterministic Model
The black diamonds show the earliest time at which any one of the resistant strains emerges (reaches a level of 5% of total infecteds), obtained from simulations of the full deterministic system (Equation 1). The red dashed, green dash-dotted, and blue solid lines show the analytic approximation (Equation 7) for the time to emergence of the first, second, and third resistant strain. The vertical black lines indicate the level of treatment at which the fitness (R0) of the respective resistant strain is the same as that of the sensitive. For the top panels, fitness levels of the resistant strains are 75%, 85%, and 95% of the sensitive strain in the absence of treatment, resulting in values for the basic reproductive numbers as indicated. For the bottom panels, fitness levels of the resistant strains are 60%, 75%, and 90% of the sensitive strain. The left panels show results for conversion rateslt¼l1¼l2¼101, the right panels show results forlt¼l1¼l2¼103. Other parameter choices are given in Table 1.
example of this effect, consider the results shown in Figure 5. The red dashed lines show the probability of resistance emergence if no compensatory mutations would occur. For a resistant strain that has 75% fitness compared with the sensitive strain, any treatment level below’30% would lead to a zero probability of emergence (top panels). If the fitness were reduced to 60%, treatment of almost 50% of the infecteds would not allow resistance to emerge (bottom panels). However, inclusion of compensatory mutations leads to a more pessimistic outlook. For instance, if the fitness of the most evolved resistant strain is 95%, a treatment level of ’6% still leads to a nonzero, albeit potentially small, probability of emergence (top panels).
A second important finding is the nonlinear dependence of the probability of and time to emergence on the treatment level. In general, small changes in treatment levels at lowf lead to much larger changes in the results when compared with changes infat high treatment levels (Figures 5 and 6). The regions of high and low sensitivity to treatment changes depend on the exact nature of the underlying system. For high conversion rates, the curves are relatively smooth, while low conversion rates can result in sharp step-like changes. For instance, if it were known that the dynamics of a specific host–pathogen system is described by the dashed green curve in Figure 7B, one could increase treatment level from’20% to’45% without significantly reducing the time to resistance emergence. However, even small further increases would lead to a significant drop in the time to emergence. This likely generic feature, which changes in treatment level do not necessarily lead to proportional changes in time to resistance emergence, could have important implications for treatment
strategies as well as for the interpretation of epidemiological data.
An additional interesting result is that for treatment levels close to the extinction threshold, it can be beneficial to increase treatment further. Not only might it lead to eradication of the pathogen, but even if eradication does not happen, the low prevalence of infecteds will lead to very few introductions of resistance (Figure 3). If the number of resistance introductions becomes small enough, this effect dominates over the increase in relative fitness of the resistant strains with treatment increase, leading to an overall increase in the average time to emergence (Figure 6). Therefore, while for most treatment levels increased treatment leads to faster resistance emergence, under certain circumstance increasing the treatment level can decrease the probability of resistance emergence.
Our final result concerns the choice of modeling frame-work. Since the process of compensatory mutations has low numbers and low rates, stochastic effects become important. As Figure 6B and Figure 6D show, results obtained from the deterministic model can differ significantly from the stochas-tic results. As mentioned earlier, this discrepancy exists because in the stochastic model, introductions of resistance can be followed by extinction, until a resistant pathogen is able to emerge. If the introduction occurs at low frequency, the time until a resistant strain finally starts the emergence process can be potentially large. In contrast to that, the
Figure 6.Years until Resistance Emerges—Stochastic Model
Boxplots show distribution of times to emergence (resistance at a level of 5% of total infecteds) for 5,000 simulations of the stochastic model. The red dashed, green dash-dotted, and blue solid lines show the analytic approximationsT^i for the time to emergence of the first, second, and third resistant strain. The vertical black lines indicate the level of treatment at which the fitness of the respective resistant strain is the same as that of the sensitive. For comparison, the black dashed line shows the deterministic result (Equation 7). Parameters are chosen as in Figure 4.
DOI: 10.1371/journal.pcbi.0020137.g006
Figure 7.Years until Emergence Occurs as a Function of Treatment
(A) All conversion probabilities are li¼103. The green dashed line shows a situation with two resistant strains with fitness 60% and 90% that of the sensitive strain. The blue dash-dotted line shows three resistant strains with fitness 60%, 75%, and 90%, and the red solid line shows four resistant strains with fitness 60%, 70%, 80%, and 90%. (B) Same number of strains and fitness levels as (A) but the product of all conversion probabilities is kept the same. We chooselt¼102for all three cases andl1¼106for the two-strain scenario (dashed green line), l1¼l2¼103for the three-strain scenario (dash-dotted blue line), andl1 ¼l2¼l3¼102for the four-strain scenario (solid red line).
(C) Three resistant strains with fitness of 60%, 75%, and 90%. Conversion rates areli¼101(dashed green line),li¼102(dash-dotted blue line), andli¼103(solid red line).
(D) Same as (C) but with conversion rates lt¼102, l1¼l2¼103 (dashed green line),lt¼104,l1¼l2¼102(dash-dotted blue line), and lt¼l2¼103,l1¼102(solid red line).
deterministic model seeds all resistant strains immediately, and the emergence process starts without delay. Since compensatory mutations likely play a role in the resistance emergence of most pathogens, we suggest that stochastic models are more appropriate to investigate the resistance emergence process.
Toward Quantitative Predictions of Resistance Emergence
To quantitatively predict resistance emergence, as well as to design optimal drug-use strategies, one needs detailed knowledge of the parameters and dynamics of the underlying system.
As discussed in the introduction, current lack of data unfortunately limits the quantitative and predictive power of our model. Several steps need to be taken to move toward quantitative results. First and foremost, it is important to obtain good estimates for the parameters involved in resistance emergence. The most straightforward way of doing so would be through epidemiological studies. One would need to identify individuals infected with resistant mutants and determine the clinically relevant routes of compensatory mutation a particular resistant pathogen can follow. Further, one would need to determine the rate at which hosts infected with each mutant arise, and measure the number of secondary infections a host infected with a specific mutant causes. These measurements would directly give parameter estimates forR0, the conversion ratesli,and the compensa-tory mutation pathways that are important in the process of emergence. Unfortunately, this approach is as impossible to implement as it is straightforward. It is already difficult to estimate R0 for pathogens that infect many hosts. Since potentially few hosts are being infected with the different resistant strains, it is pretty much impossible to detect those infections and obtain useful parameter estimates. There might be a better chance to obtain results in controlled transmission experiments in animals. It would likely be possible to investigate the compensatory mutation paths involved in the emergence of resistance. However, measure-ments forR0and the conversion rates would still be difficult to obtain. We think that a more promising approach is to try and obtain the needed parameter estimates by utilizing within-host data and appropriate theoretical models. Meas-urements of in vivo mutation rates, fitness levels, and pathogen dynamics, combined with appropriate models, might allow estimation of the relative between-host fitness levels for the resistant mutants. Some preliminary work in this direction has been done [41,57], and we are currently in the process of extending some of these results.
Once better and more complete parameter estimates are available, another step toward quantitative predictions can be made by creating more complex epidemiological models. For gonorrhea transmission dynamics, a more realistic model would accurately describe the population and disease life-history by including factors such as gender, sexual activity, sexual orientation, ethnicity, social status, and others [44,45]. Another step toward quantitative predictions will involve more detailed models of the process of resistance emergence. For instance, in our model we assume that treatment does not influence the resistant pathogen. However, in vitro studies of E. coli have shown that the presence of drugs can lead to
different compensatory mutations compared with their absence [58]. It is not clear if this is important for in vivo evolution. However, since it is usually not known if a host is infected with a resistant strain or not, potentially resulting in a resistant host receiving treatment, this finding needs to be kept in mind. Further, in our model we assume that a host is always dominated by a single strain. In reality, a host might be infected with a mix of different strains which upon trans-mission might infect a new host either with one of the transmitted strains or a mixed inoculum, calling for a more detailed model that can incorporate mixed-inoculum effects. We also assumed that conversions happen with a constant probability during the infection and that upon conversion, a host enters a new class, basically starting the infection over. Our model also excludes density-dependent effects, which might become important if the resistant strains become frequent.
As always with biological systems, including every detail would lead to a model that is very complicated and difficult to analyze. Often, simplified models are able to capture the dynamics of complex systems, even on a quantitative level. Without additional studies, it is difficult to predict which biological details will need to be included if one wants to obtain quantitative predictions. However, currently the most serious limitation concerning quantitative results is not the lack of model complexity but the almost complete lack of data for the parameters that govern resistance emergence.
In summary, we obtained important qualitative insights into the effects that compensatory mutations have on the population-wide emergence of drug resistance. Our model used parameters applicable for gonorrhea; however, the results we obtained are rather general. Our finding that the inclusion of compensatory mutations significantly influences the dynamics of resistance emergence has important impli-cations for the design of detailed, predictive models. Especially the fact that changes in the level of treatment can lead to disproportionate changes in the probability of and time to resistance emergence has important public health implications. In future work, it will be necessary to obtain estimates for the currently unknown parameters. This knowledge, combined with more complex and detailed epidemiological models, can ultimately lead to quantitative predictions of how the level of treatment influences emergence of resistance. Such knowledge will be extremely valuable for the rational implementation of treatment strategies.
Acknowledgments
We thank A. Yates for helpful discussions on the topic of branching processes, E. Margolis for feedback on an earlier version of the manuscript, and two anonymous referees for excellent criticism that helped to significantly improve the paper.
Author contributions.AH, RRR, and RA conceived and designed the study. AH performed the analysis and simulations and analyzed the data. RRR contributed analysis tools. AH, RRR, and RA wrote the paper.
Funding. We acknowledge funding by the National Institute of General Medical Sciences of the (US) National Institutes of Health.
References
1. Lipsitch M (2001) The rise and fall of antimicrobial resistance. Trends Microbiol 9: 438–444.
2. Levin BR (2001) Minimizing potential resistance: A population dynamics view. Clin Infect Dis 33: S161–S169.
3. Lipsitch M, Samore MH (2002) Antimicrobial use and antimicrobial resistance: A population perspective. Emerg Infect Dis 8: 347–354. 4. Levy SB, Marshall B (2004) Antibacterial resistance worldwide: Causes,
challenges and responses. Nat Med 10: S122–S129.
5. Dancer SJ (2004) How antibiotics can make us sick: The less obvious adverse effects of antimicrobial chemotherapy. Lancet Infect Dis 4: 611–619. 6. Livermore DM (2005) Minimising antibiotic resistance. Lancet Infect Dis 5:
450–459. DOI: 10.1016/S1473–3099(05)70166–3.
7. Levin B, Lipsitch M, Perrot V, Schrag S, Antia R, et al. (1997) The population genetics of antibiotic resistance. Clin Infect Dis 24 (Supplement 1): S9–S16.
8. Stewart F, Antia R, Levin B, Lipsitch M, Mittler J (1998) The population genetics of antibiotic resistance. II: Analytic theory for sustained populations of bacteria in a community of hosts. Theor Popul Biol 53: 152–165.
9. Austin DJ, Kristinsson KG, Anderson RM (1999) The relationship between the volume of antimicrobial consumption in human communities and the frequency of resistance. Proc Natl Acad Sci U S A 96: 1152–1156. 10. Massad E, Lundberg S, Yang H (1993) Modeling and simulating the
evolution of resistance against antibiotics. Int J Biomed Comput 33: 65–81. 11. Bonhoeffer S, Lipsitch M, Levin BR (1997) Evaluating treatment protocols to prevent antibiotic resistance. Proc Natl Acad Sci U S A 94: 12106–12111. 12. Lipsitch M, Bergstrom CT, Levin BR (2000) The epidemiology of antibiotic resistance in hospitals: Paradoxes and prescriptions. Proc Natl Acad Sci U S A 97: 1938–1943.
13. Bergstrom CT, Lo M, Lipsitch M (2004) Ecological theory suggests that antimicrobial cycling will not reduce antimicrobial resistance in hospitals. Proc Natl Acad Sci 101: 13285–13290.
14. Smith D, Dushoff J, Perencevich E, Harris A, Levin S (2004) Persistent colonization and the spread of antibiotic resistance in nosocomial pathogens: Resistance is a regional problem. Proc Natl Acad Sci U S A 101: 3709–3714.
15. Smith DL, Harris AD, Johnson JA, Silbergeld EK, Glenn Morris JG Jr (2002) Animal antibiotic use has an early but important impact on the emergence of antibiotic resistance in human commensal bacteria. Proc Natl Acad Sci 99: 6434–6439.
16. Koella J, Antia R (2003) Epidemiological models for the spread of anti-malarial resistance. Malar J 2: 3.
17. Baggaley RF, Ferguson NM, Garnett GP (2005) The epidemiological impact of antiretroviral use predicted by mathematical models: A review. Emerg Themes Epidemiol 2: 9. DOI:10.1186/1742-7622-2–9. Available: http://dx. doi.org/10.1186/1742-7622-2–9. Accessed 12 September 2006.
18. Baggaley RF, Garnett GP, Ferguson NM (2006) Modelling the impact of antiretroviral use in resource-poor settings. PLoS Med 3(4): e124. DOI: 10. 1371/journal.pmed.0030124.. Available: http://dx.doi.org/10.1371/journal. pmed.0030124. Accessed 12 September 2006.
19. Blower SM, Porco TC, Darby G (1998) Predicting and preventing the emergence of antiviral drug resistance in hsv-2. Nat Med 4: 673–678. 20. Lipsitch M, Bacon T, Leary J, Antia R, Levin B (2000) Effects of antiviral
usage on transmission dynamics of herpes simplex virus type 1 and on antiviral resistance: Predictions of mathematical models. Antimicrob Agents Chemother 44: 2824–2835.
21. Blower SM, Chou T (2004) Modeling the emergence of the‘‘hot zones’’: Tuberculosis and the amplification dynamics of drug resistance. Nat Med 10: 1111–1116.
22. Cohen T, Murray M (2004) Modeling epidemics of multidrug-resistant m-tuberculosis of heterogeneous fitness. Nat Med 10: 1117–1121.
23. Stilianakis NI, Perelson AS, Hayden FG (1998) Emergence of drug resistance during an influenza epidemic: Insights from a mathematical model. J Infect Dis 177: 863–873.
24. Ferguson NM, Mallett S, Jackson H, Roberts N, Ward P (2003) A population-dynamic model for evaluating the potential spread of drug-resistant influenza virus infections during community-based use of antivirals. J Antimicrob Chemother 51: 977–990. DOI:10.1093/jac/dkg136. Available: http://dx.doi.org/10.1093/jac/dkg136. Accessed 12 September 2006.
25. Andersson DI, Levin BR (1999) The biological cost of antibiotic resistance. Curr Opin Microbiol 2: 489–493.
26. Andersson DI (2003) Persistence of antibiotic resistant bacteria. Curr Opin Microbiol 6: 452–456.
27. Maisnier-Patin S, Andersson DI (2004) Adaptation to the deleterious effects of antimicrobial drug resistance mutations by compensatory evolution. Res Microbiol 155: 360–369. DOI:10.1016/j.resmic.2004.01.019
28. Schrag SJ, Perrot V (1996) Reducing antibiotic resistance. Nature 381: 120– 121.
29. Schrag SJ, Perrot V, Levin BR (1997) Adaptation to the fitness costs of antibiotic resistance inEscherichia coli. Proc R Soc Lond B 264: 1287–1291. 30. Levin B, Perrot V, Walker N (2000) Compensatory mutations, antibiotic
resistance and the population genetics of adaptive evolution in bacteria. Genetics 154: 985–997.
31. Bjo¨rkman J, Hughes D, Andersson DI (1998) Virulence of antibiotic-resistantSalmonella typhimurium. Proc Natl Acad Sci 95: 3949–3953. 32. Bjo¨rkman J, Nagaev I, Berg OG, Hughes D, Andersson DI (2000) Effects of
environment on compensatory mutations to ameliorate costs of antibiotic resistance. Science 287: 1479.
33. Sherman DR, Mdluli K, Hickey MJ, Arain TM, Morris SL, B J, et al. (1996) Compensatory ahpC gene expression in isoniazid-resistantMycobacterium tuberculosis. Science 272: 1641–1643.
34. Sherman DR, Gillespie GMA, Kaul R, Dong T, Yang HB, Rostron T, et al. (2002) Cross-reactive cytotoxic T ymphocytes against a HIV-1 p24 epitope in slow progressors with B*57. AIDS 16: 961–972.
35. Maskell JP, Sefton AM, Hall LM (2001) Multiple mutations modulate the function of dihydrofolate reductase in trimethoprim-resistantStreptococcus pneumoniae. Antimicrob Agents Chemother 45: 1104–1108. DOI: 10.1128/ AAC.45.4.1104–1108.2001. Available: http://dx.doi.org/10.1128/AAC.45.4. 1104–1108.2001. Accessed 12 September 2006.
36. Nagaev I, Bjo¨rkman J, Andersson DI, Hughes D (2001) Biological cost and compensatory evolution in fusidic acid-resistantStaphylococcus aureus. Mol Microbiol 40: 433–439.
37. Cowen LE, Kohn LM, Anderson JB (2001) Divergence in fitness and evolution of drug resistance in experimental populations of Candida albicans. J Bacteriol 183: 2971–2978. DOI: 10.1128/JB.183.10.2971–2978.2001. Available: http://dx.doi.org/10.1128/JB.183.10.2971–2978.2001. Accessed 12 September 2006.
38. Wijngaarden PJ, van den Bosch F, Jeger MJ, Hoekstra RF (2005) Adaptation to the cost of resistance: A model of compensation, recombination, and selection in a haploid organism. Proc Biol Sci 272: 85–89.
39. Anderson RM, May RM (1991) Infectious diseases of humans—Dynamics and control. Oxford: Oxford Science Publications.
40. Hethcote HW (2000) The mathematics of infectious diseases. SIAM Review 42: 599–653.
41. Antia R, Levin BR, May RM (1994) Within-host population dynamics and the evolution and maintenance of microparasite virulence. Am Nat 144: 457–472.
42. Bjo¨rkholm B, Sjo¨lund M, Falk PG, Berg OG, Engstrand L (2001) Mutation frequency and biological cost of antibiotic resistance inHelicobacter pylori.
Proc Natl Acad Sci U S A 98: 14607–14612. DOI:10.1073/pnas.241517298 Available: http://dx.doi.org/10.1073/pnas.241517298. Accessed 12 September 2006.
43. Maisnier-Patin S, Berg OG, Liljas L, Andersson DI (2002) Compensatory adaptation to the deleterious effect of antibiotic resistance inSalmonella typhimurium. Mol Microbiol 46: 355–366.
44. Hethcote HW, Yorke JA (1984) Gonorrhea transmission dynamics and control. In: Lecture notes in biomathematics. Volume 56. Berlin: Springer. pp. 1–105.
45. Garnett GP, Mertz KJ, Finelli L, Levine WC, Louis MES (1999) The transmission dynamics of gonorrhoea: Modelling the reported behaviour of infected patients from Newark, New Jersey. Philos Trans R Soc Lond B Biol Sci 354: 787–797.
46. Garnett GP, Swinton J, Brunham RC, Anderson RM (1992) Gonococcal infection, infertility, and population growth: II. The influence of hetero-geneity in sexual behaviour. IMA J Math Appl Med Biol 9: 127–144. 47. Turner KME, Garnett GP, Ghani AC, Sterne JAC, Low N (2004)
Investigating ethnic inequalities in the incidence of sexually transmitted infections: Mathematical modelling study. Sex Transm Infect 80: 379–385. DOI: 10.1136/sti.2003.007575.
48. Tapsall JW (2001) Antimicrobial resistance inNeisseria gonorrhoeae. World Health Organization. Available: http://whqlibdoc.who.int/hq/2001/ WHO_CDS_CSR_DRS_2001.3.pdf. Accessed 14 September 2006. 49. Tapsall JW (2005) Antibiotic resistance inNeisseria gonorrhoeae. Clin Infect
Dis 41 (Supplement 4): S263–S268. DOI: 10.1086/430787. Available: http:// dx.doi.org/10.1086/430787. Accessed 12 September 2006.
50. Athreya KB, Ney PE (1972) Branching processes. New York: Springer. 287 p. 51. Allen LJS (2003) An introduction to stochastic processes with applications in biology. Upper Saddle River (New Jersey): Pearson Education. 385 p. 52. Antia R, Regoes R, Koella J, Bergstrom C (2003) The role of evolution in the
emergence of infectious diseases. Nature 426: 658–661.
53. Iwasa Y, Michor F, Nowak MA (2004) Evolutionary dynamics of invasion and escape. J Theor Biol 226: 205–214.
54. Gillespie DT (1977) Exact stochastic simulation of coupled chemical reactions. J Phys Chem 81: 2340–2361.
55. Turner TE, Schnell S, Burrage K (2004) Stochastic approaches for modelling in vivo reactions. Comput Biol Chem 28: 165–178.
56. Cao Y, Li H, Petzold L (2004) Efficient formulation of the stochastic simulation algorithm for chemically reacting systems. J Chem Phys 121: 4059–4067.
57. Ganusov VV, Bergstrom CT, Antia R (2002) Within-host population dynamics and the evolution of microparasites in a heterogeneous host population. Evolution 56: 213–223.
58. Reynolds MG (2000) Compensatory evolution in rifampin-resistant