IMPLEMENTATION OF KRIGING METHODS IN MOBILE GIS
TO ESTIMATE DAMAGE TO BUILDINGS IN CRISIS SCENARIOS
S. Launa*, N. Röscha, M. Breuniga, M. Al Doorib
a
Geodetic Institute, Karlsruhe Institute of Technology, Germany - (simon.laun, norbert.roesch, martin.breunig)@kit.edu b
Department of Electrical and Computer Engineering, American University in Dubai, United Arab Emirates - [email protected]
Commission II, WG II/3
KEY WORDS: Kriging methods, Mobile GIS, natural hazard, estimation of damage, crisis scenario.
ABSTRACT:
In the paper an example for the application of kriging methods to estimate damage to buildings in crisis scenarios is introduced. Furthermore, the Java implementations for Ordinary and Universal Kriging on mobile GIS are presented. As variogram models an exponential, a Gaussian and a spherical variogram are tested in detail. Different test constellations are introduced with various information densities. As test data set, public data from the analysis of the 2010 Haiti earthquake by satellite images are p re-processed and visualized in a Geographic Information System. As buildings, topography and other external influences cannot be seen as being constant for the whole area under investigation, semi variograms are calculated by consulting neighboured classified buildings using the so called moving window method. The evaluation of the methods shows that the underlying variogram model is the determining factor for the quality of the interpolation rather than the choice of the kriging method or increasing the in formation density of a random sample. The implementation is completely realized with the programming language Java. Thereafter, the implemented software component is integrated into GeoTech Mobile, a mobile GIS Android application based on the processing of standardized spatial data representations defined by the Open Geospatial Consortium (OGC). As a result the implemented methods can be used on mobile devices, i.e. they may be transferred to other application fields. That is why we finally point out further research with new applications in the Dubai region.
1. INTRODUCTION
In the event of crisis scenarios – we think especially of natural hazards – it is crucial to organize the rescue measures swiftly. Therefore, at least in city areas, detailed information about the damages of the building stock and the condition of the infrastructure is needed. Both are correlated closely because the damage of the buildings will indicate also the condition of the streets in their vicinity. If the buildings are destroyed completely, then the streets would be devastated by debris and the bridges and tunnels would also be affected.
Due to the fact that our world gets more and more linked, the damages after a natural hazard are recorded almost instantaneous be it by Volunteered Geographic Information (VGI) (Goodchild, 2007; Goodchild and Glennon, 2010), the direct analysis of satellite images or social networks. The earth quake of Haiti in 2010 provides a convincing example for this statement, because only a few days after the catastrophe the damages were registered in the Open Street Map (OSM) data base. This event delivered the initial idea to develop a tool to provide information about the condition of the building stock for rescue teams. Thus the in-situ teams get valuable hints.
Two main questions arose during the planning phase of the subsequent scientific research. The first was about the appropriate approach and the second dealt with the density of the support points which are necessary to compute a reliable estimation of damages to be expected. As a study case we took the above mentioned data of Haiti. The damages of the buildings captured during this event were subdivided into five classes whereas class 1 means no visible damages and class 5 completely damaged. We took this classification as a reference.
Very soon we decided to refer to the Kriging method (Krige, 1951) as an interpolation procedure to get a continuous – if
necessary – representation of the damages. Continuous in this context means that an estimation of the damages for a building at any arbitrary point can be obtained. Furthermore the computations should be performed on a mobile device, so that the latest results are provided to the rescue teams at any time. As a consequence the computation kernel was developed and implemented on a tablet PC.
As there are various Kriging methods in use, we decided to realize two of them:
Ordinary Kriging
Universal Kriging
The two approaches deliver a best unbiased prediction of the intermediate values. However, the latter considers an additional trend model and therefore is more sophisticated.
Both methods were implemented and compared with each other to get an idea which one may fit the needs best. Hence, the implementation still comprises both approaches.
2. DESIGN OF THE VARIOGRAM FUNCTION
However, the qualitative advantages achieved by this extension of the algorithm prevails the extra costs.
As the analysis of the data captured by the support points delivers only an empirical variogram – which is in fact no function, but a set of points serving as support points – thus a theoretical approximation to get a continuous function has to be found. Here we referred to three different approaches. These are the
spherical and
the Gaussian as well as
the exponential variogram function.
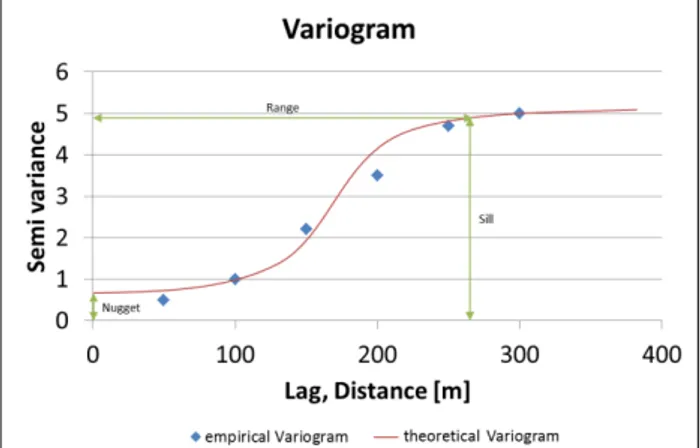
The above mentioned functions encompass three parameters which are denoted as nugget, sill and range. The visual interpretation of these parameters is given in fig. 3. Nugget thus simply denotes the intercept of the y-axis and the sill stands for the asymptote. In practice 95% of the support points are beneath the sill. The range marks the distance where the asymptote and the theoretical variogram function meet or differ not substantially to be more precise.
These parameters have to be estimated based on the support points. Therefore we implemented the Levenberg-Marquardt algorithm (Levenberg, 1944) to fit the function to the support points according to the least squares method. As there are multiple iterations possible, the maximum number of these iterations is fixed. It has to be pointed out that the calculation of the sill, range, and nugget is repeated for each new point estimate, this step has to be passed fast. In the following section this is discussed in detail.
3. DETERMINATION OF THE SUPPORT POINTS, DESIGN OF INFORMATIN ANALYSIS,
AND IMPLEMENTATION
Another design problem is how to determine the number of support points needed to get a reliable estimation for the status of a building at a certain point. The use case in Haiti delivered an excellent base for this analysis, because the status of almost all buildings were known and thus the results of the trials could be cross validated by the real data. Due to the large study site we were able to conduct tests with different variogram functions and various numbers of support points. The outcome of these test runs is also discussed in the following sections.
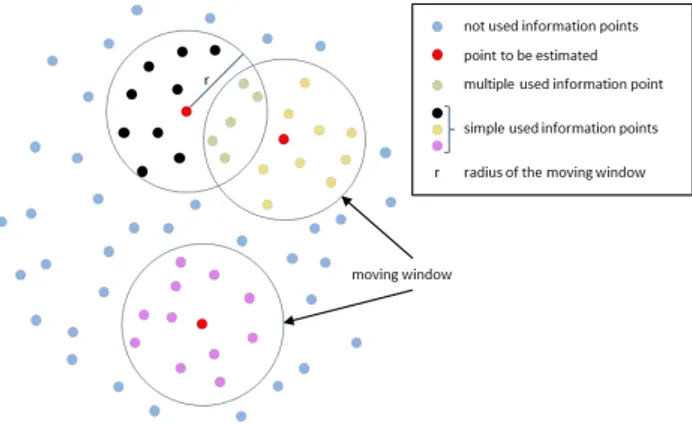
The initial situation is depicted in fig. 1. In this figure each point (except the red ones) denotes a building which serves as a potential support point. A building can serve as support point as soon as its classification is known. This classification is the result of a ground truth process. As a consequence, already estimated points cannot serve as support points.
Figure 1. Initial situation before subsequent Kriging analysis (fig. from Laun, 2015)
We assume in our use case that we already received information about the damages of at least a certain percentage of the buildings by different sources (satellite images, volunteered geographic information etc.). We further assume that the data base – which consists of the classified buildings – will be enlarged over time so that the density of the classified support points is growing steadily and the estimation can be performed multiply to get a “better” - which means more reliable - output after each update.
The sequence diagram of the information analysis is depicted in fig. 2. At the beginning the data can contain the initial data or additional data. Data denotes in this context a new set of information about the damages of the building stock. This information is the base for the subsequent analysis and is typically loaded into a fast-access data structure such as an array at the beginning of the information analysis.
Figure 2. Design of information analysis
The moving window method reduces the search space determining the (max. N) nearest classified buildings around a given building. In our implementation the distances are then ordered using Bubble Sort (Donald, 1997). These (max. N) nearest classified buildings provide the input to determine the experimental variogram. I.e. after a set of support points is captured, the empirical variogram is derived. This experimental variogram returns the degree of damage dependent on the distances of the buildings to be estimated (e.g. lag1: 0-5 m, lag2: 50-100 m., etc.). Hereafter, based on the Levenberg-Marquardt algorithm, a theoretical variogram function with the three unknown parameter values of nugget (measure of noise), sill (threshold value), and range (distance between the first value x=0 and the point at which the y-values hit the sill value) is calculated. Furthermore, the average of the semi variance per lag is determined. Now all prerequisites for the Kriging process are fulfilled and the estimation can be performed.
It should be kept in mind that after this process only one single point is estimated. If we expect the system to be executed in real time – which is intended – different optimizations are necessary. In fact these optimizations have already been considered in our implementation: First, a so called moving window is introduced, which has two advantages:
Spatial limitation of the search area
Adaptation of the variogram function to the neighborhood (e.g. topography).
Secondly, the iterations of the Levenberg-Marquardt algorithm have to be limited. Thus the maximum number of iterations is one of the parameters the user fixes in advance. This restriction was crucial, because due to some effects - which have not yet been completely analyzed - in some cases, the algorithm did not converge fast enough. As a consequence the runtime extended which was against the intention.
Another optimization is the limitation of the support points introduced for the estimation process. Based on the results of different trials we found out that only a certain percentage of support points are needed to get a reliable estimation for an arbitrary point. The details are outlined in the next section.
In the next paragraph the Levenberg-Marquardt algorithm itself is discussed. As already explained, this algorithm is designed to solve nonlinear adjustment problems. This encompasses the determination of approximate values for the three parameters nugget, sill and range (see fig. 3).
Figure 3. Approximate values for nugget, sill, and range in the variogram function (fig. from Laun, 2015)
The approximate values for the three parameters are calculated based on a regression analysis. The regression delivers the axis intercept of the y-axis which is the approximation for the nugget and the range as well as the sill are obtained directly from the list of the support points and can be derived by estimating the difference in slope between two different adjacent points (see also fig. 3).
4. TEST CASES
the Kriging method assumes a subordinate role for the interpolation. These results have been shown in detail in an earlier publication (Laun, 2015).
In this publication detailed results are described for a test case with a spherical variogram in combination with the Ordinary Kriging as well as the Universal Kriging. The test constellations are accomplished with several densities of known classified buildings. For example, 10 percent of the data stock is considered as known classified buildings and form the basis of the interpolation.
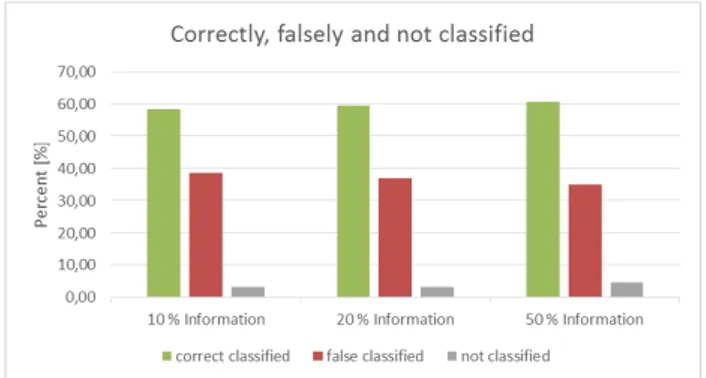
Figure 4. Classification of buildings for Ordinary Kriging
Figure 5. Classification of buildings for Universal Kriging
Fig. 4 (Ordinary Kriging) and fig. 5 (Universal Kriging) confirm the thesis of the first tests that the Kriging method assumes a subordinate role for the interpolation. The results are in the same scale as the results from the tests with an exponential variogram. Only the number of the not classified buildings decreases about 50 percent. This phenomenon is caused by the more simple function of the spherical variogram, which therefore can be adapted more easily to the observation points during the calculation of the unknown variables of the Kriging-Function.
Because of the high amount of false classifications, there is obviously one question to answer: How is the deviation of the false classified buildings to their correct classification? A part of the answer is given by fig. 6 and fig. 7. The figures show the number of falsely classified buildings and their number, which only differs in one class. The buildings with a low deviation are approximately 50 percent of the false classified buildings. This is an interesting fact, because these 50 percent of the falsely classified buildings are also equivalent withthe real situation. This situation is not surprising being caused by the smoothing effect of the interpolation.
Figure 6. Analysis of misclassified buildings for Ordinary Kriging
Figure 7. Analysis of misclassified buildings for Universal Kriging
If the number of falsely classified buildings with a low deviation will be added to the number of correctly classified buildings, the result increases to approximately 80 percent of information, which approximates the correct situation in the affected area. This information is sufficient to get a reliable impression where the destroyed areas are. Overall the benefit of this analysis is that Kriging methods can be used to get a fast overview - based on less information - of damages to buildings in an affected area e.g. after a natural hazard.
5. MOBILE SOLUTION
Besides efficient geo-database management (Breunig et al., 2016) and the evaluation of the methods, the realization of methods implemented for mobile devices was on our focus (Breunig et al., 2015). To provide also a standalone solution is important, because the operability of the system has also to be guaranteed, if the telecommunication infrastructure is destroyed by a natural hazard. So each calculation should be able to be carried out on the mobile device. To share new recorded information there must be a connection with a central server. Otherwise there could only be worked with the pre-installed information.
system is given, which can transport the complex context of the situation of buildings after a natural hazard.
Figure 8. Visualized interpolation of the mobile solution (fig. from Laun, 2015)
Fig. 8 shows the visualized interpolation result as a captured image from the mobile application. Every colored point represents a building in the affected area. The color scheme reaches from green, which displays buildings with no visible damage, up to red, which displays heavily damaged buildings. The second important – though not obvious – information in the figure is the differentiation between the interpolated damage and the given damage from the support points. Buildings with an interpolated damage are light colored as the buildings with a given damage. Based on this information it is easy to interpret the situation in the region. Thus stronger affected neighborhoods can be extracted and a targeted procedure is provided.
The basis of the implemented mobile application GeoTech Mobile (Breunig et al., 2015) has been chosen, which is implemented for Android operating system. GeoTech Mobile provides a number of tools such as a viewer to display geodata. Functions to record new geodata as well as a connection to a server such as GeoServer (GeoServer, 2016). The Kriging methods are implemented as a plugin for GeoTech Mobile. The software architecture may be easily extended driven by new requirements from data analysis.
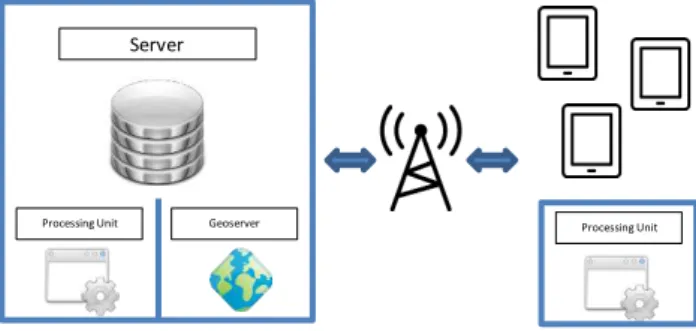
Figure 9. System architecture of mobile solution
Fig. 9 shows the system architecture of the mobile solution. There is the central server, a geodata server, and optional a processing unit for the Kriging interpolation. Obviously the server can calculate the interpolation much faster than a mobile device. If there is the possibility to exchange data between the central server and the mobile devices during the data analysis, it is more efficient to run the calculation on the server. Besides the efficiency advantage there is another one: The calculation on the server can consider the latest recorded data. For example, new data can be recorded from volunteers via areal images or from operating persons via the mobile device, which are registered on the central server. This allows each operating
person access to the best approximation of the situation in the affected area. For the connection between the server and the mobile devices a wireless network is absolutely necessary. This can be a local network or e.g. the Long-Term Evolution (4G LTE) - the standard for wireless communication of high-speed data for mobile phones and data terminals.
The most obvious application field of the introduced methods except natural hazards is mining, for which the Kriging method originally has been developed (Krige, 1951). In this use case the application can be used to record samples, calculate an interpolation and plan new locations for samples based on the interpolation result. So many tasks can be carried out on site and the speed of the workflow can be increased.
6. CONCLUSIONS AND OUTLOOK
In this paper we presented approaches for Ordinary and Universal Kriging to determine the damage of buildings after natural hazards. As test data set, public data from the 2010 Haiti earthquake have been used. Variograms have been calculated consulting neighboured classified buildings using the moving window method. The evaluation of the methods showed that the underlying variogram model is the determining factor for the quality of the interpolation rather than the choice of the kriging method or the information density of a random sample. Furthermore a spherical Variogram provided the best results. The implemented software component has been integrated into the operational mobile GIS “GeoTech Mobile,” which enables the processing of standardized spatial data representations defined by the OGC.
In the future we intend to disseminate our research to other examination areas such as the United Arab Emirates (UAE). Especially Dubai is a young and ever expanding city. Its urban infrastructure has been one of the fastest growing globally in the past ten years. As business increased the need for planning and future scalability especially for 3D modeling became of paramount importance and the availability of 3D models for any facility based on existing drawings and presented in the form or perspective drawings for display or reference purposes. GIS solutions create a logical conclusion by comparing several sources of data against each another and highlighting a revealing insight or conclusion. This is often created through a combination of client data and independent research.
As well known the Kriging technique is one of a set of geostatistical interpolation strategies which depend on statistical models that incorporate autocorrelation. On account of this, not just geostatistical strategies have the ability of delivering an expectation surface, yet they can likewise give some measure of the sureness or precision of the forecasts. This technique assumes that the separation between spatial correlation mirrors a spatial correlation that can be utilized to clarify varieties in the surface. As a multistep process, Kriging incorporates exploratory factual examination of the information, variogram demonstrating, making the surface, and (alternatively) investigating a difference surface. It fits a numerical capacity to a predetermined number of focuses, or all focuses inside of a predefined range, the output value for each location.
As we have seen in this contribution, Kriging is useful when you know there is a spatially corresponded separation or directional predisposition in the data. That is why it is also frequently utilized as a part of soil science and Geology in particular analysis of geologic strata. This makes it interesting Server
for sub-surface applications in the UAE and particular in Dubai. Geologic Indicator Kriging (GIK) facilitates the building of extremely complex models with relative ease. E.g. it may be used to check hierarchical layer models of oil sites or others.
With the rapid growth in GIS modelling needs in Dubai, a group of scientists from Karlsruhe Institute of Technology, 3D Geoinformation group at Delft University of Technology, and the American University in Dubai formed a Geoinformatics team offering local undergraduate and graduate training, doctoral supervision in GIS studies, and GIS courses for public authorities such as Dubai Municipality. Within the ongoing project, the group is responsible for local supervision of development of local projects and coordination of activities with international members of the team.
REFERENCES
Akin, H., Siemes, H., 1988. Praktische Geostatistik. Springer-Verlag, 1988
Bailey, T. C., Gatrell, A. C., 1995. Interactive Spatial Data Analysis. Routledge, pp. 179-180
Bill, R., 2010. Grundlagen der Geo-Informationssysteme, Wichmann
Breunig, M., Butwilowski, E., Kuper, P., Hoch, T., Wiedemann, S., Wild, P., Klauser, B., 2015. Standardized geodata workflow for mobile GIS, in German, Allgemeine Vermessungsnachrichten (avn), 3/2015, pp. 90-94).
Breunig, M., Kuper, P.V., Butwilowski, E., Thomsen, A., Jahn, M., Dittrich, A., Al-Doori, M., Golovko, D., Menninghaus, M., 2016. The story of DB4GeO – a service-based
geodatabase architecture to support multi-dimensional data analysis and visualization. ISPRS Journal,
http://dx.doi.org/10.1016/j.isprsjprs.2015.12.006, 19p.,in print.
Donald E. K., 1997. The Art of Computer Programming: Volume 3 Sorting and Searching. Addison-Wesley, pp. 106-110.
GeoServer, 2016. http://geoserver.org
Goodchild, M.F., 2007. Citizens as sensors: the world of volunteered geography. GeoJournal, 69(4), pp. 211–221.
Goodchild, M.F., Glennon, J.A., 2010. Crowdsourcing Geographic Information for Disaster Response: A Research Frontier. International Journal of Digital Earth - Special Issue: Early warning and disaster management: the importance of geographic information, 3(3), 2010, pp. 231-241.
Haas, T. C., 1989. Kriging and automated Variogram modeling within a moving Window, Atmospheric Environment, Vol. 24A, pp. 1759-1769.
Krige, D. G., 1951. A statistical approach to some basic mine valuation problems on the Witwatersrand. In: Journal of the Chem, Metal. and Mining Society of South Africa, pp. 119–139.
Laun, S., 2015. Realization of Kriging methods in mobile GIS and evaluation of the applicability to estimate the damage of buildings in crisis scenarios, in German, Master Thesis, Geodetic Institute, Chair of Geoinformatics, Karlsruhe Institute of Technology, 66p.
Levenberg, K., 1944. A Method for the Solution of Certain Problems in Least Squares. In: The Quarterly of Applied Mathematics, 2, pp. 164-168.