Temperature dependence of structural and electronic properties of the spin-liquid candidate
κ
-(BEDT-TTF)
2Cu
2(CN)
3Harald O. Jeschke,1Mariano de Souza,2,*Roser Valent´ı,1Rudra Sekhar Manna,2Michael Lang,2and John A. Schlueter3 1Institut f¨ur Theoretische Physik, Goethe-Universit¨at Frankfurt am Main, D-60438 Frankfurt am Main, Germany
2Physikalisches Institut, Goethe-Universit¨at Frankfurt am Main, D-60438 Frankfurt am Main, Germany
3Materials Science Division, Argonne National Laboratory, Argonne, Illinois 60439, USA
(Received 21 November 2011; revised manuscript received 10 January 2012; published 27 January 2012)
We investigate the effect that the temperature dependence of the crystal structure of a two-dimensional organic charge-transfer salt has on the low-energy Hamiltonian representation of the electronic structure. For that, we determine the crystal structure ofκ-(BEDT-TTF)2Cu2(CN)3 for a series of temperatures betweenT =5 and
300 K by single crystal X-ray diffraction and analyze the evolution of the electronic structure with temperature by using density functional theory and tight binding methods. We find a considerable temperature dependence of the corresponding triangular lattice Hubbard Hamiltonian parameters. We conclude that even in the absence of a change of symmetry, the temperature dependence of quantities like frustration and interaction strength can be significant and should be taken into account.
DOI:10.1103/PhysRevB.85.035125 PACS number(s): 61.05.cp, 61.66.Hq, 75.10.Jm, 71.15.Mb
I. INTRODUCTION
The two-dimensional organic charge-transfer salts based on bis(ethylenedithio)tetrathiafulvalene (BEDT-TTF or even shorter ET) molecules in aκ-type lattice arrangement have been intensively studied over the past 30 years due to their complex interplay between electron correlation and the effects of low dimensionality and spin frustration.1 In particular, the discovery of spin-liquid behavior inκ -(BEDT-TTF)2Cu2(CN)3(Ref.2) has fascinated experimentalists and
theorists alike. Issues of current interest concern the nature of the low-temperature spin-liquid realized in this material3–5 and the various anomalies observed upon approaching the spin-liquid state from high temperatures. These anomalies include drastic changes in the 1H-NMR relaxation rate
around 200 to 150 K (Ref. 6), the thermopower at 150 K (Ref. 7), relaxor-type ferroelectricity around 60 K (Ref. 8), and a mysterious phase-transition anomaly at 6 K (Ref. 9). The latter feature, which manifests itself in anomalies in thermodynamic2,3 and transport4 quantities, is accompanied by pronounced lattice effects.9 Various scenarios have been suggested for the 6 K anomaly including a crossover from a thermally to a quantum disordered state,3 an instabil-ity of the quantum spin-liquid,3,10–16 or a distinct type of charge ordering.17 Theoretically, the spin-liquid properties have been investigated on the basis of the anisotropic triangular-lattice Hubbard Hamiltonian.12,18–21 The parame-terst, t′, and U of this Hamiltonian have been determined
with semiempirical7 as well as first principles methods22,23 based on the experimental structure at room temperature. Missing in such investigations is, however, the consider-ation of a possible temperature dependence of the model parameters.
In this work, we find by a combination of single crystal X-ray diffraction at various temperatures and density func-tional theory calculations that even in the absence of structural phase transitions, the temperature dependence of the structural parameters is significant enough to influence the electronic behavior and the determination of the Hamiltonian model parameters inκ-(BEDT-TTF)2Cu2(CN)3. We suggest that this
has subtle effects on the degree of frustration and interaction strength.
In 1991, the crystal structure ofκ-(BEDT-TTF)2Cu2(CN)3
was reported,24 and the unit cell parameters confirmed,25 on twinned crystals at room temperature. The crystal structure was redetermined in 1993, also on a twinned crystal at room temperature.26 The crystal structure of the very similar κ′
-(BEDT-TTF)2Cu2(CN)3structure, which is reported to be an
ambient pressure superconductor, was described in 1992.27,28 The crystal structure of theκphase was subsequently redeter-mined in 1997,29and the unit cell redetermined in 2001, both at room temperature.30Already in 1991, the unit cell parameters were reported at 300 and 30 K, with a(30K)/a(300K) =
0.9964, b(30K)/b(300K) =0.9932, c(30K)/c(300K)=0.9900,
andβ(30K)/β(300K)=1.0146 (Ref.31). Our comparable
con-traction values between 300 and 20 K area(20K)/a(300K) =
0.9988, b(20K)/b(300K) =0.9958, c(20K)/c(300K)=0.9905,
andβ(20K)/β(300K)=1.0148 and agree well with the previous
results. In addition, we find evidence for an ordering of the ethylene groups in a staggered conformation between 200 and 150 K. Despite the current interest in this material as a spin-liquid candidate, no low-temperature structural determinations have yet been reported. Herein, we present a detailed characterization of the crystal structure as function of temperature determined on a single crystal with very high agreement factors.
II. SINGLE CRYSTAL X-ray DIFFRACTION A black, platelike crystal of κ-(BEDT-TTF)2Cu2(CN)3
with dimensions 0.4×0.4×0.4 mm3 was placed onto the
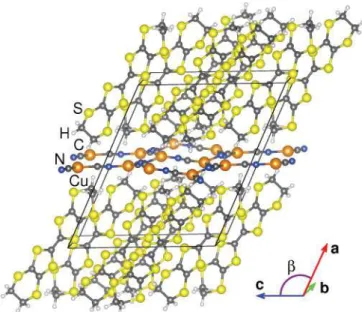
FIG. 1. (Color online) Structure ofκ-(BEDT-TTF)2Cu2(CN)3at
T =5 K. Note that the disordered CN−group in the inversion center is only shown in one conformation.
stabilizing the temperature immediately prior to data collec-tion. In order to reduce adverse thermal effects, the thermome-ter wires (twisted manganin wires, 0.5-mm diamethermome-ter, supplied by Lakeshore) were anchored on the surfaces of the cryostat exposed to the 4He stream. The data were collected using
MoKαradiation (λ=0.71073 ˚A) with a detector distance of 50 mm. Unit cell parameters were determined upon cooling in 10 K increments between 100 and 290 K, with a frame exposure time of 10 s. Full data sets for structural analysis were collected at temperatures of 5, 20, 100, 150, 200, 250,
and 300 K. The uncertainties in the temperature determination are typically ±0.2 K down to 100 K, while for the 20 and 5 K data points, an error bar of ±1 K has to be accepted. These data collections nominally covered over a hemisphere of reciprocal space by a combination of three sets of exposures. Data to a resolution of 0.68 ˚A were considered in the reduction. The raw intensity data were corrected for absorption [SADABS
(Ref.32)]. The structure was solved and refined usingSHELXTL
(Ref.33). A direct-method solution was calculated, which pro-vided most of atomic positions from the electron-density map. Full-matrix–least-squares/difference-Fourier-cycles were per-formed, which located the remaining atoms. All nonhydrogen atoms were refined with anisotropic displacement parameters. The hydrogen atoms were placed in ideal positions and refined as riding atoms with relative isotropic displacement parameters.
As a representative example, in Fig.1we show the structure ofκ-(BEDT-TTF)2Cu2(CN)3at a temperature ofT =5 K. In
the bc plane, the BEDT-TTF molecules form their typical κ-type arrangement. One of the cyanide (CN−) groups resides
on an inversion center, thus requiring it to be disordered with a 50% carbon and 50% nitrogen distribution on these two atomic positions.24 Analysis of the low-temperature structural data (see TableI) indicates that overall,a,b, andcaxes decrease with temperature, while theβ angle increases monotonically upon cooling. We find that the orthogonal projection of the a axis, a⊥=asinβ, has the greatest relative contraction
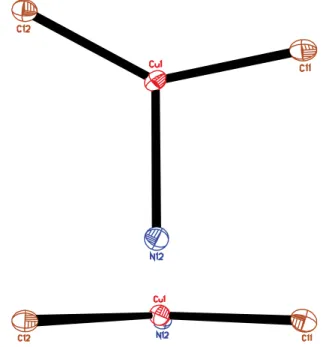
with temperature. One ethylene group is disordered at room temperature with a staggered conformation 77% of the time. As the temperature is lowered, the ethylene group remains partially disordered down to a temperature of 200 K and is fully ordered in a staggered conformation at 150 K. The anion layer becomes slightly more buckled at low temperature: at room temperature, the Cu1 atom lies 0.050 ˚A out of the
TABLE I. Crystal data and structure refinement ofκ-(BEDT-TTF)2Cu2(CN)3. Formula=C23H16Cu2N3S16, formula weightMW=974.43, monoclinic, wavelengthλ=0.71073 ˚A, effective number of electrons in the crystal unit cell contributing to F(000)=978, space groupP21/c,
Z=2. Residual factor for the reflectionsR1=||Fo| − |Fc||/|Fo|, weighted residual factorswR2=[w(Fo2−F
2
c)
2/
w(F2
o)
2]12,
I >2σ(I), least-squares goodness-of-fit parameter GoF=[
w(F2
o −F
2
c)
2/(N
d−Np)] 1
2. Staggered (%) is the percentage of ethylene groups that are in the staggered conformation. Note that in eclipsed and staggered conformations, the two ethylene end groups have the same or opposite twist angle with respect to the plane of the molecule, respectively.dCu−NNC( ˚A) is the distance that the Cu(I) ion is out of the plane defined by the
coordinated N, N, and C atoms. The ET tilt angleϑis measured against thebcplane.dintradimeris the orthogonal distance between BEDT-TTF
dimers.
300 K 250 K 200 K 150 K 100 K 20 K 5 K
a( ˚A) 16.0919(3) 16.0848(3) 16.0781(3) 16.0703(3) 16.0746(6) 16.072(4) 16.062(3)
b( ˚A) 8.5722(2) 8.5749(1) 8.5737(1) 8.5664(2) 8.5593(3) 8.536(2) 8.544(2)
c( ˚A) 13.3889(2) 13.3373(2) 13.2964(2) 13.2698(3) 13.2678(5) 13.262(3) 13.271(2)
β(◦) 113.406(1) 113.853(1) 114.273(1) 114.609(1) 114.852(1) 115.088(3) 115.093(2)
V ( ˚A3) 1694.93(6) 1682.43(4) 1670.86(4) 1660.72(6) 1656.51(1) 1647.8(6) 1649.3(5)
ρ(g/cm−3) 1.909 1.923 1.937 1.949 1.954 1.964 1.962
μ(mm−1) 2.266 2.283 2.299 2.313 2.319 2.331 2.329
GoF 1.057 1.053 1.091 1.157 1.293 1.261 1.109
R 0.0311 0.0269 0.0238 0.0225 0.0220 0.0182 0.0204
Rw 0.0838 0.0735 0.0654 0.0627 0.0629 0.0503 0.0515
staggered (%) 77 86 93 100 100 100 100
dCu−NNC( ˚A) 0.050 0.056 0.064 0.069 0.073 0.072 0.072
ET tilt angleϑ 66.55 66.25 66.00 65.79 65.64 65.53 65.52
C11-C12-N12 plane, increasing to 0.072 ˚A at low temperature. For the purpose of performing density functional theory calculations, the original symmetry ofP 21/chas been lowered
toP21 by choosing one of two possible orientations of the
CN−group in the inversion center.
III. TEMPERATURE-DEPENDENT STRUCTURAL PARAMETERS
In Fig.2, we show the evolution of the lattice parameters with temperature. Over the large investigated temperature range from T =300 down to T =5 K, the volume is monotonously decreasing with temperature [see Fig. 2(a)]. The monoclinic angleβ betweenaandclattice vectors [see Fig. 2(b)] first rapidly increases upon cooling down to a temperature of T =200 K, below which it increases more gradually. In Fig. 2(c), the lattice parameters are displayed as symbols, normalized by their values at T =20 K (see TableI). We also include the relativebandclattice constants along the two principal axes as obtained by thermal expansion
1660 1680 1700
V (Å3)
(a)
113.5 114 114.5 115
β (°)
(b)
1 1.01
0 100 200 T (K) 300
relative lattice parameters
X−ray
| |
a
−/a− 20K b/b20K c/c20K
1 1.01
0 100 200 T (K) 300
relative lattice parameters (c)
Δx/x
| |
FIG. 2. (Color online) Structural parameters of κ -(BEDT-TTF)2Cu2(CN)3 betweenT =5 andT =300 K. (a) and (b) show
the volume and monoclinic angle, respectively. In (c) relative lattice parameters are given with theT =20 K structure as the reference.
a⊥=asinβ. Symbols refer to the new data from X-ray diffraction (this work), while lines are measured thermal expansion data from Ref.9. The experimental error bar is comparable to the size of the symbols.
measurements in Refs.9and34. The out-of-plane expansivity data shown there were taken in a direction perpendicular to the bc plane. They are shown together with the corre-sponding quantity from the X-ray diffraction measurement, a⊥=asinβ.
IV. TEMPERATURE-DEPENDENT ELECTRONIC STRUCTURE
In the following, we determine the electronic properties for the resolved crystal structures at different temperatures by em-ploying the all-electron full-potential local orbitals (FPLO)35 basis. We perform all calculations on a (6×6×6) k mesh with a generalized gradient approximation functional.36 In Fig.3we present the electronic band structures for the various crystal structures. In the calculation, we used the staggered (majority) conformation of the BEDT-TTF molecules at all temperatures. The changes as function of temperature for the two bands at the Fermi level, corresponding to the antibonding combinations of the BEDT-TTF highest occupied molecular orbital (HOMO) levels, are relatively small. On the other hand, the occupied bands down to−0.7 eV below the Fermi level show a significant dependence on temperature. These bands derive from the bonding combination of BEDT-TTF HOMO levels and from the [Cu2(CN)3]−anion layer. Overall,
these bands show a bandwidth that decreases with increasing temperature. This can be explained by the volume increase as function of temperature [see Fig.2(a)].
Further analysis of the electronic structure requires a reliable identification of the bands deriving from the BEDT-TTF molecules. For that purpose, band weights have been calculated for all structures and added up for all atoms corresponding to the BEDT-TTF cation layers and to the [Cu2(CN)3]−anion layers, respectively. In Fig.4, blue circles
and orange triangles stand for a predominance of the BEDT-TTF weight and [Cu2(CN)3]− weight, respectively. This
identification allows us to fit the BEDT-TTF derived bands to a tight binding (TB) Hamiltonian
HTB=
ij,σ
ti−j(c†iσcj σ +H.c.), (1)
whereciσ† (ciσ) create (annihilate) an electron with spinσ at sitei; the sites correspond to the positions of the BEDT-TTF molecules, shown as balls in Fig. 5. While a good overall fit of the band structure can be achieved by including six neighbor BEDT-TTF molecule distances up tod =9.4 ˚A, a very good fit describing also the small dispersion along the B–Ŵdirection, as shown by lines in Fig.4, requires fourteen neighbor distances up tod =14.5 ˚A.
−0.6
−0.4
−0.2
0
0.2
C
Y
Γ
Z
C
Γ
energy (eV)
5 K
20 K
100 K
150 K
200 K
250 K
300 K
FIG. 3. (Color online) Band structures ofκ-(BEDT-TTF)2Cu2(CN)3fromT =5 toT =300 K.
the Hubbard Hamiltonian for the anisotropic triangular lattice
H =
ij,σ
t(c†iσcj σ +H.c.)+
[ij],σ
t′(c†iσcj σ +H.c.)
+U i
ni↑−
1
2 ni↓− 1 2
, (2)
whereijand [ij] indicate summations over nearest and next-nearest neighbors, respectively.tandt′can be obtained from
the molecular overlap integrals t2 to t4 by considering the
geometrical formulas
t ≈ t2+t4
2 , t
′≈t3
2. (3)
−0.6 −0.4 −0.2 0 0.2
C Y Γ Z C Γ A B Γ D E Γ
energy (eV)
FIG. 4. (Color online) Band structure of κ -(BEDT-TTF)2Cu2(CN)3 at T =20 K. Blue circles and orange triangles
indicate bands with a majority of BEDT-TTF and [Cu2(CN)3]−
character, respectively. The TB fit is shown with lines.
For the definition of the overlap integrals tn=ti−j, see Ref.22. Note that inclusion of longer-range hopping into these formulas (for example, includingt5 intot′) has no influence
on the results reported in the following.
V. DISCUSSION
Figure6 summarizes our findings from the tight binding analysis. The nearest-neighbor hopping parameterst, forming a square lattice, increase upon cooling down to a temperature of T =200 K, then decrease again [see Fig. 6(a)]. The frustrating hopping parameterst′show the opposite behavior
FIG. 5. (Color online) Network formed by the BEDT-TTF molecules in thebcplane ofκ-(BEDT-TTF)2Cu2(CN)3. Each gray
49.5 50 50.5
40 41 42
t (meV) t’ (meV)
(a)
0.8 0.82 0.84 0.86 t’/t
(b)
frustration
340 350 360
U (meV) 2t1≈U
(c)
6.8 7 7.2
0 100 200 T (K) 300
U/t
(d)
interaction
FIG. 6. (Color online) Temperature dependence of Hamiltonian parameters ofκ-(BEDT-TTF)2Cu2(CN)3.
as a function of temperature, decreasing upon cooling down to a temperature ofT =150 K, then increasing. Interestingly, these two effects enhance each other when we consider their ratio t′/t as shown in Fig. 6(b). t′/t, which quantifies the
degree of frustration in the system, decreases fromt′/t=0.82 at T =300 K tot′/t =0.80 at T =150 K, then increases
to a maximum value of t′/t =0.86 at T =5 K. A rough
estimate for the Coulomb interaction strengthU can also be extracted from the dimer approximationU≈2t1, wheret1is
the BEDT-TTF intradimer hopping integral [see Fig.6(c)]. We find that the measure of the interaction strengthU/testimated in this way monotonously falls by 7% as the temperature is increased fromT =5 toT =300 K.
In order to rationalize the observed temperature dependence of the Hamiltonian parameters in (2), we analyze the crystal structure in more detail. For that purpose, we determined the orientation of the BEDT-TTF molecules in space by finding the plane of the TTF part of the molecule and measuring its angle with respect to the bc plane, cf. inset of Fig.7. This yields the inclination of the BEDT-TTF molecules against the anion layer shown as squares in Fig. 7 and the intradimer distance shown as circles (see also TableI). Both quantities show a nearly monotonous increase over the studied temper-ature range. The decreasing intradimer distance explains the increase of the intradimer hopping integralt1with decreasing
temperature. Apparently, the nonmonotonous evolution of the overlap integralst,t′, especially the distinct extrema in both quantities around 150 to 200 K, has to be of a different origin.
FIG. 7. (Color online) (a) Orientation ϑ and dimerization d
of BEDT-TTF molecules as a function of temperature. The inset illustrates howϑanddare measured. (b) Ratioc/bbetweencandb
lattice vectors as a function of temperature.
The overall trend can be understood by considering the temperature dependence of the lattice parameters; from Fig.5
it is clear that changes in theblattice parameter should have an impact ont′, while changes incshould affectt. In Fig.7(b),
we see that the c/b lattice parameter ratio decreases with temperature down toT =150 K, then increases with falling
0.97 0.98 0.99 1 1.01
100 150 200 250 300
relative lattice parameter
x/x
(290 K)
T (K) a
b
c
β
V
a b c
β
V
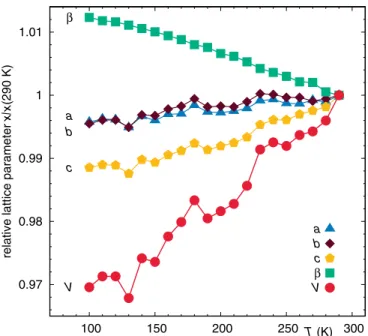
FIG. 9. (Color online) Plot of the unit cell parameters as a function of temperature between 100 and 290 K.
temperature untilT =20 K. This has an immediate impact on the degree of frustration t′/t as it should be approximately proportional to the c/b ratio. Indeed, a comparison of Figs.6(b)and7(b)confirms this expectation, and thus explains the nonmonotonous temperature dependence of the frustation. An increasing frustration upon cooling, reachingt′/tvalues
at low temperatures in excess of those at room temperature, is an interesting finding which may help us to better understand the intriguing low-temperature magnetic and dielectric prop-erties of this material. Here we mention the distinct types of charge ordering, accompanied by dielectric anomalies, proposed in Ref. 17 for the present material as a result of an increasing degree of frustration.
The nonmonotonous evolution of the in-plane distortion c/b, which adopts a minimum around 150 K, might be related to the ordering of the ethylene groups, uncovered in the present study.37 According to our structural analysis, the fraction of ethylene groups, ordered in the staggered conformation, gradually grows from 77% at room temperature to over 86% at 250 to 93% at 200 K. For temperatures below 150 K, the ordering is complete within the accuracy of our analysis/refinement. The large step size of 50 K employed in this study does not allow us to determine the ordering temperature more precisely. Likewise, we cannot say whether or not the ordering occurs continuously or sets in abruptly. An argument in favour of the latter possibility might be derived from a small steplike feature revealed in thermal expansion measurements around 150 K, see the out-of plane data shown in Fig.1 of Ref.9. We stress that a fully ordered staggered ethylene conformation below 150 K and a progressively disordered state above 200 K is fully consistent with the anomalous behavior revealed by1H-NMR measurements be-tween 150 and 200 K (Ref.6). The strong increase in (T1T)−1
above 200 K was attributed to thermally activated vibrations of ethylene groups.6 We suggest that the nonmonotonous temperature dependence in t′/t might also be related to the
drastic change in the thermopower around 150 K (Ref. 7). The thermopower is related to the energy derivative of the density of states at the Fermi level.38However, for a strongly correlated system like κ-(BEDT-TTF)2Cu2(CN)3, density
functional theory is not sufficient for the calculation of this quantity and more elaborate many-body calculations—which are beyond the scope of the present study—have to be done.
In summary, we performed an analysis of the temperature dependence of the structural and electronic properties of κ-(BEDT-TTF)2Cu2(CN)3 by considering a combination of
X-ray diffraction at various temperatures and density func-tional calculations. Our study shows that the temperature de-pendence of the structural parameters has significant influence on the electronic properties and results in a nonmonotonous behavior of the degree of frustration. Of special relevance is the increase of frustration at low temperatures in comparison to the behavior at room temperature.
ACKNOWLEDGMENTS
This work was supported by UChicago Argonne, LLC, Op-erator of Argonne National Laboratory (“Argonne”). Argonne, a U.S. Department of Energy Office of Science laboratory, is operated under Contract No. DE-AC02-06CH11357. We also acknowledge support by the Deutsche Forschungsgemein-schaft (SFB/TR 49) and by the Helmholtz Association through HA216/EMMI.
APPENDIX: ADDITIONAL CRYSTALLOGRAPHIC MATERIAL
Crystallographic data for the κ-(BEDT-TTF)2Cu2(CN)3
structure at 5, 10, 100, 150, 200, 250, and 300 K has been deposited with the Cambridge Crystallographic Data Centre as supplementary publication Nos. CCDC 850022 to
TABLE II. Unit cell parameters as a function of temperature in the temperature range from 290 down to 100 K.
T (K) a( ˚A) b( ˚A) c( ˚A) β(◦) V ( ˚A3)
850028. Copies of the data can be obtained free of charge on application to CCDC, 12 Union Road, Cambridge CB2 1EZ, United Kingdom [fax: (44) 1223 336-033; e-mail: data [email protected]].
Figure 8 illustrates geometry of the anion layer and the slight deviation from planarity. Figure9and TableIIcontain lattice parameters determined at 10 K intervals between 290 and 100 K.
*Present address: Departamento de F´ısica, IGCE, Unesp -
Univer-sidade Estadual Paulista, Caixa Postal 178, CEP 13500-970 Rio Claro-SP, Brazil.
1K. Kanoda and R. Kato,Annu. Rev. Condens. Matter Phys.2, 167
(2011).
2Y. Shimizu, K. Miyagawa, K. Kanoda, M. Maesato, and G. Saito,
Phys. Rev. Lett.91, 107001 (2003).
3S. Yamashita, Y. Nakazawa, M. Oguni, Y. Oshima, H. Nojiri,
Y. Shimizu, K. Miyagawa, and K. Kanoda,Nat. Phys.4, 459 (2008).
4M. Yamashita, N. Nakata, Y. Kasahara, T. Sasaki, N. Yoneyama,
N. Kobayashi, S. Fujimoto, T. Shibauchi, and Y. Matsuda,Nat. Phys.5, 44 (2009).
5F. L. Pratt, P. J. Baker, S. J. Blundell, T. Lancaster,
S. Ohira-Kawamura, C. Baines, Y. Shimizu, K. Kanoda, I. Watanabe, and G. Saito,Nature (London)471, 612 (2011).
6Y. Kurosaki, Y. Shimizu, K. Miyagawa, K. Kanoda, and G. Saito,
Phys. Rev. Lett.95, 177001 (2005).
7T. Komatsu, N. Matsukawa, T. Inoue, and G. Saito,J. Phys. Soc.
Jpn.65, 1340 (1996).
8M. Abdel-Jawad, I. Terasaki, T. Sasaki, N. Yoneyama,
N. Kobayashi, Y. Uesu, and C. Hotta,Phys. Rev. B82, 125119 (2010).
9R. S. Manna, M. de Souza, A. Br¨uhl, J. A. Schlueter, and M. Lang,
Phys. Rev. Lett.104, 016403 (2010).
10G. Baskaran,Phys. Rev. Lett.63, 2524 (1989).
11J. Liu, J. Schmalian, and N. Trivedi,Phys. Rev. Lett.94, 127003
(2005).
12B. Kyung and A.-M. S. Tremblay,Phys. Rev. Lett. 97, 046402
(2006).
13T. Grover, N. Trivedi, T. Senthil, and P. A. Lee,Phys. Rev. B81,
245121 (2010).
14S.-S. Lee, P. A. Lee, and T. Senthil,Phys. Rev. Lett.98, 067006
(2007).
15V. Galitski and Y. B. Kim,Phys. Rev. Lett.99, 266403 (2007). 16H. Kawamura and S. Miyashita,J. Phys. Soc. Jpn.53, 4138 (1984). 17H. Li, R. T. Clay, and S. Mazumdar,J. Phys. Condens. Matter22,
272201 (2010).
18T. Mizusaki and M. Imada,Phys. Rev. B74, 014421 (2006). 19L. F. Tocchio, A. Parola, C. Gros, and F. Becca,Phys. Rev. B80,
064419 (2009).
20H.-Y. Yang, A. M. L¨auchli, F. Mila, and K. P. Schmidt,Phys. Rev.
Lett.105, 267204 (2010).
21L. Balents,Nature (London)464, 199 (2010).
22H. C. Kandpal, I. Opahle, Y.-Z. Zhang, H. O. Jeschke, and
R. Valent´ı,Phys. Rev. Lett.103, 067004 (2009).
23K. Nakamura, Y. Yoshimoto, T. Kosugi, R. Arita, and M. Imada,
J. Phys. Soc. Jpn.78, 083710 (2009).
24U. Geiser, H. H. Wang, K. D. Carlson, J. M. Williams, H. A.
Charlier, J. E. Heindl, G. A. Yaconi, B. J. Love, M. W. Lathrop, J. E. Schirber, D. L. Overmyer, J. Ren, and M.-H. Whangbo,Inorg. Chem.30, 2586 (1991).
25T. Komatsu, T. Nakamura, N. Matsukawa, H. Yamochi, G. Saito,
H. Ito, T. Ishiguro, M. Kusunoki, and K.-I. Sakaguchi,Solid State Commun.80, 843 (1991).
26G. C. Papavassiliou, D. J. Lagouvardos, A. Terzis, J. Amiell,
C. Garrigou-Lagrange, P. Delha`es, B. Hilti, and J. Pfeiffer,Synth. Met.61, 267 (1993).
27H. Yamochi, T. Nakamura, T. Komatsu, N. Matsukawa, T. Inoue,
G. Saito, T. Mori, M. Kusunoki, and K.-I. Sakaguchi,Solid State Commun.82, 101 (1992).
28H. Yamochi, T. Komatsu, N. Matsukawa, G. Saito, T. Mori,
M. Kusunoki, and K. Sakaguchi,J. Am. Chem. Soc.115, 11319 (1993).
29X. H. Bu and P. Coppens, Z. Kristallogr., New Cryst. Struct.212, 103
(1997).
30O. Drozdova, G. Saito, H. Yamochi, K. Ookubo, K. Yakushi,
M. Uruichi, and L. Ouahab,Inorg. Chem.40, 3265 (2001).
31X. Bu, A. Frost-Jensen, R. Allendoerfer, P. Coppens, B. Lederle,
and M. J. Naughton,Solid State Commun.79, 1053 (1991).
32G. M. Sheldrick, computer code
SADABS (Bruker AXS, Inc., Madison, WI, 2001), Version 2.03a.
33G. M. Sheldrick, computer code
SHELXTL (Bruker AXS Inc., Madison, WI, 2001), Version 6.12.
34M. de Souza, Ph.D. thesis, Frankfurt University, 2008
[http://publikationen.ub.uni-frankfurt.de/volltexte/2009/6240/].
35K. Koepernik and H. Eschrig, Phys. Rev. B 59, 1743
(1999).
36J. P. Perdew, K. Burke, and M. Ernzerhof,Phys. Rev. Lett.77, 3865
(1996).
37Note that even though all our (density functional theory)
calcula-tions were performed considering ordered ethylene groups, they capture the effects of the ethylene ordering through the changes caused on the structural parameters.