*e-mail: [email protected]
Synthesis and Characterization of CeO
2Nanocrystals by Solvothermal Route
E. Kumara*,P. Selvarajanb,D. Muthurajc
aDepartment of Physics, Infant Jesus College of Engineering and Technology,
Keelavallanadu, Tuticorin-628 851, Tamilnadu, India
bDepartment of Physics, Aditanar College of Arts and Science, Tiruchendur-628 216, Tamilnadu, India cDepartment of Physics, The M.D.T Hindu College, Tirunelveli-627 010, Tamilnadu, India
Received: March 30, 2012; Revised: September 3, 2012
Cerium dioxide nanoparticles were prepared by solvothermal technique. The structural analysis was carried out using X-ray diffraction. It showed that the cerium dioxide nanoparticles exhibited cubic structure. Grain sizes were estimated from High Resolution Transmission Electron Microscopy images. The size of the nanoparticles is around 20 nm. The surface morphological studies from Scanning Electron Microscope (SEM) and HRTEM depicted spherical particles with formation of clusters. Thermal and electrical Insulating behaviors were determined.
Keywords: nanoparticles, microwave, optical property
1. Introduction
Cerium dioxide or ceria (CeO2) is an important rare-earth
oxide, which has multiple applications such as electrolyte
materials of solid oxide fuel cells1, ultraviolet blocking
materials2, catalysts3, Chemical Mechanical Polishing
(CMP)4 and oxygen gas sensors5. It has a fluorite-like cubic
structure in which each cerium site is surrounded by eight oxygen sites in face-centered cubic (FCC) arrangement and each oxygen site has a tetrahedron cerium site. Recently, a variety of methods based on wet chemical routes have been
extensively employed to synthesize of CeO2 nanoparticles
like precipitation6-9, hydrothermal10,11, sol-gel method12,
and microemulsion method13. Among these preparation
methods, microwave-assisted solution method is a simple and inexpensive method to prepare nanomaterials. Microwave is electromagnetic radiation with frequency range of 0.3-300 GHz and corresponding wavelength from 1 mm to 1000 mm. In the microwave irradiation region, the frequency of the applied irradiation is low enough so that the dipoles have time to respond to the alternating electric field and therefore respond to rotation. This method has been successfully applied for the preparation of a variety of nano-sized inorganic materials. The microwave synthesis, which is generally quite fast, simple, and energy efficient, has been developed, and widely used for
TiO2 nanoparticles14, metal (Cu, Hg, Zn, Bi, Pb) sulfide
nanoparticles15, uniform and stable polymer-stabilized
colloidal clusters of Pt, Ir, Rh, Pd, Au and Ru16, CuO17 etc.
Compared with conventional heating, microwave heating has an advantage of high efficiency and rapid formation of nanoparticles with a nano-size distribution and less agglomeration. The fundamental mechanism of microwave heating involves agitation of polar molecules or ions that oscillate under the effect of an oscillating electric field. In
the presence of an oscillating field, particles try to orient themselves. This constant re-orientation creates friction
and collisions between molecules, thus producing heat18.
In the present study, we employed the microwave method to prepare the nanometer-sized cerium oxide ultrafine particles using ethylene glycol as a capping agent. The structural features, electrical, thermal and optical properties of the ceria nanoparticles were determined in depth with X-ray powder diffraction (XRD), high resolution transmission electron microscope (HRTEM), scanning electron microscope (SEM), FTIR spectroscopy, UV–vis absorption spectroscopy, thermo gravimetric and differential thermal analysis (TG/DTA) and impedance analysis studies.
2. Experimental
2.1.
Materials
The ammonium Ce (IV) nitrate, [(NH4)2Ce (NO3)6]
(AR grade MERCK), Sodium hydroxide [NaOH] (AR grade MERCK), ethylene glycol (AR grade MERCK) and ammonia solution 30% of GR (AR grade MERCK) were used to synthesize the nanoparticles of this work. Water used in this investigation was de-ionized.
2.2.
Synthesis
In a typical synthesis of ceria (CeO2) nanoparticles
oven (900 W, 2450 MHz, Onida, India) at a temperature of 50 °C for about 30 minutes. When ammonium ceric nitrate is treated with sodium hydroxide, the hydrolysis process took place and the products like sodium nitrate, ammonium hydroxide, and cerium hydroxide were formed. During the
reaction, one proton (H+) is removed from cerium hydroxide
due to polar nature of water and this lead to the formation
of hydrated CeO2. Synthesized pale-yellow precipitate was
filtered and washed with de-ionized water twice. Annealing of the synthesized powder at 800 °C in air for 6 hours will
result in the formation of CeO2 nanoparticles.
2.3.
Instrumentation
Powder X-ray diffraction pattern of the nanoparticles was obtained using a powder X-ray Diffractometer (PAN
analytical Model, Nickel filtered Cu Kα radiations with
λ = 1.54056 Å at 35 kV, 10 mA). The sample was scanned
over the required range for 2Ө values (10-80°). The particle
size analysis for the sample was carried out using the particle size analyzer (Nanophox, model: 0102 P). The FTIR spectrum of the sample was recorded using a Shimadzu 8400S spectrometer by the KBr pellet technique in the
range 400-4500 cm–1. The optical spectra of sample have
been recorded in the region 190-1100 nm using a UV-1800 series spectrophotometer in the absorption mode. The SEM image of the synthesized cerium dioxide nanoparticles was recorded using a Hitachi Scanning Electron Microscope. The size and shape of nanoparticles was obtained by high resolution transmission electron microscopy (HRTEM) and HRTEM measurements were carried out on a JOEL JEM 2100. TG/DTA of the nanoparticles of the present work were carried out simultaneously using Seiko thermal analyzer in air atmosphere at a heating rate of 20 °C per minute for a temperature range of 20-1000 °C. Alumina was taken as the reference material and the alumina crucible was used. Electrical measurements were performed using an impedance bridge (Zahner IM6) for the frequency range
10 µHz to 8 MHz.
3. Results and Discussion
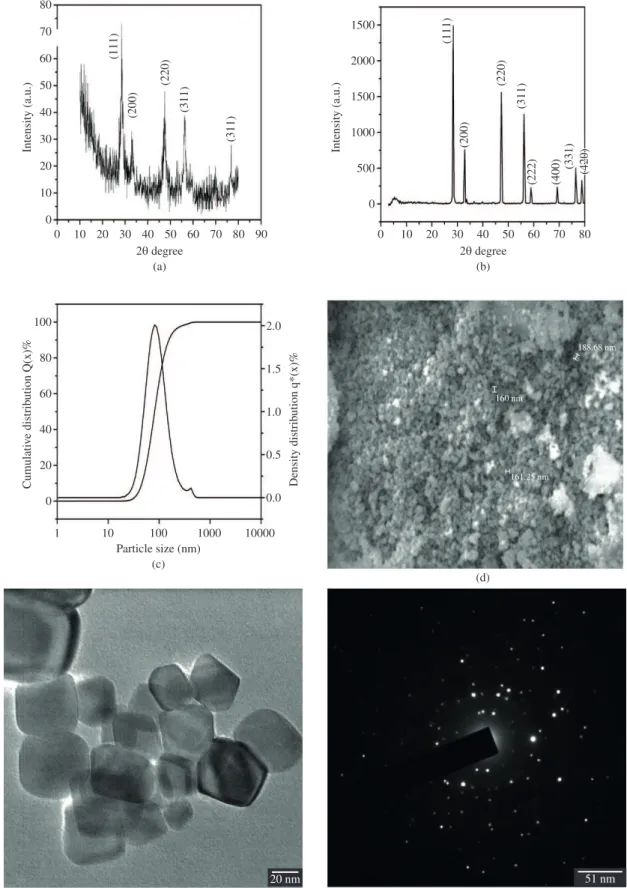
Figure 1a, b shows the XRD patterns of as prepared and annealed at 800 °C/6 h. Comparing the result with XRD
pattern of the bulk CeO2 crystallizing in the cubic fluorite
structure, it has been observed that the positions of peaks of the nanocrystal samples are in agreement with those of
the bulk CeO2, demonstrating the formation of nanocrystals
with cubic fluorite structure with lattice parameters matching the bulk. No additional peaks were observed that would correspond to any secondary phase in the sample annealed at 800 °C/6h. It is observed that the reflection peaks become sharper and narrower while increasing the annealing
temperature indicating improvement of crystallinity19. The
reflection peaks of the two XRD patterns were indexed using the software ‘INDEXING’. The ‘hkl’ values are compared
with the standard JCPDS file (PCPDF 34-0394)20. The
exhibited XRD peaks correspond to the (1 1 1), (2 0 0), (2 2 0), (3 1 1), (2 2 2), (4 0 0), (3 3 1) and (4 2 0) of a cubic
fluorite structure of CeO2 is identified using the standard
data21,22. The unit cell parameters of this sample were found
using the software ‘UNITCELL’ and the observed values
are a = b = c = 5.407 Å and α = β = γ = 90°. The grain sizes
estimated using full width at half-maximum (FWHM) of the peaks, using the Debye-Scherer’s equation
0.9 cos
D= λ
β θ (1)
where D is the crystallite size in nm, λ is the wavelength of
the X-rays (1.5406 Å), β is the full width at half maximum
and θ is the diffraction peak angle. The grains are observed
to be nearly same and all are in nearly spherical in shape, as observed in the SEM image. It is observed that the size of maximum number of particles is around 20 nm. The obtained values in this work are in good agreement with the
values reported by other research group23-28. The particle size
distribution is presented in the Figure 1c and it is observed that the size of particles is varies from 10 and 75 nm. It is in good agreement with the particle size observed on the HRTEM image.
From SEM and HRTEM images of CeO2 nanoparticles,
the morphology of nanoparticles is observed to be nearly spherical with slight agglomeration. Figure 1d indicates that the nanoparticles were nearly spherical and slightly elongated and it confirms the possibility of different crystallographic planes of different atomic density. Figure 1e demonstrate that the nanoparticles range from 10-20 nm, which are approximately the sizes reported by
Chen and Chang29. These images also provide evidence
for the formation of larger aggregates (supra-aggregates) as observed in the HRTEM image. These supraaggregates are likely to be the stable form of these nanoparticle suspensions. We could also observe some smaller particles of 5-6 nm in size, which are combined together to grow to the irregular particle with the size about 20 nm like a single
particle observed by HRTEM30. Figure 1f shows the SAED
pattern of Ceria nanoparticles. Since the CeO2 particles
tend to lower the surface energy, we could observe the agglomeration of nanoparticles like spherical shape with the size between 20 and 60 nm in the SEM image.
The FT-IR spectrum of the nanoparticles of CeO2
annealed at 800 °C is shown in Figure 2a. The broad
absorption band located around 3448 cm–1 corresponds to
the O-H stretching vibration of residual water and hydroxyl
groups, while the absorption band at 1647 cm–1 is due to the
scissor bending mode of associated water. The existence of
CH2 vibrations at 2453.3 and 2939.3cm−1 indicates that the
surfactant is not present in the as-synthesized sample. The
bands at 3382.9 and 1647.1 cm−1 can be attributed to the
O-H vibration in absorbed water on the sample surface31. In
addition to the bands in the 850-1600 and 2800-3000 cm−1,
the band due to the stretching frequency of Ce-O can be seen
below 700 cm−1. The FT-IR peaks at about 1515, 1265, 1130,
1064, 952 and 862 cm−1 are similar to those of commercial
CeO2 powders32 and CeO
2 nanoparticles33. The band at
862 cm–1 and 819 cm–1 corresponds to (Ce-O) metal-oxygen
bond and the corresponding functional groups are given in tables 3.5. The assignments for the peaks/bands of the FT-IR spectra of the samples have been given in accordance with
Figure 1. (a) XRD pattern of as prepared ceria nanoparticles. (b) XRD pattern of annealed (800 °C) ceria nanoparticles. (c) Particle
UV-visible absorption spectral study may be assisted in understanding electronic structure of the optical band gap of the material. Absorption in the near ultraviolet region arises from electronic transitions associated within the sample. The size-dependent quantum size effect and the optical quality of the ceria nanoparticles, optical absorption studies are carried out by ultrasonically dispersing the samples in spectroscopic grade toluene. The Figure 2c shows a well-defined absorption peak located at 321 nm. The sharp and strong absorption spectrum with clear excitonic feature is in good accordance with the narrow size distribution of ceria nanocrystal. In comparison with UV-visible absorption
spectrum of CeO2 nanoparticles reported in the literature35,
the peaks at 321 nm and band/peak in the spectrum located at around 500-700 nm are observed to be shifted towards lower wavelength side, which clearly shows the blue shift. It indicates the absorption positions depend on the
morphologies and sizes of CeO2. The UV absorption ability
of CeO2 is related with band gap energy. The UV-absorption
edge provides a reliable estimate of the band gap of any
system. From the plots of hν against (αhν)2, band gap energy
can be found accurately. Here α is the absorption coefficient
and h and ν have the usual meanings. The absorption
coefficient (α) was determined by using the relation
α = 2.303 log (abs)/t where‘t’ is the size of the particle in
nm and ‘abs’ is the absorbance. The relation between the
absorption coefficient (α) and the incident photon energy
hν can be written as α h ν = A (h ν – Eg)1/2[36], where A is
a constant and Eg is the band gap energy of the material.
When the allowed direct transition is pre-assumed, as
usually done by other researchers37,38, band gap energy may
be obtained from extrapolation of the straight line portion
of the hν vs (αhν)2 plot to α = 0. The band gap energy was
calculated by plotting the optical energy hν against (αhν)2
and is shown in Figure 2d. The absorption of CeO2 in the
UV range originates from the charge-transfer between
the O 2p and Ce 4f states in O2– and Ce4+, which is much
stronger than the 4f1-5d1 transition from the Ce3+ species
in the mixed valence ceria system. From the intersection
of the extrapolated linear portion, the Eg value of the CeO2
Figure 2. (a) FTIR spectrum of Ceria nanoparticles. (b) TG/DTA Curves of ceria nanoparticles. (c) UV-Vis spectrum and (d) Plots of
(˛αhv)2 agaist hv for CeO
samples was determined as 3.22 eV. It is found that the band
gap of the CeO2 nanoparticles in the present study is 3.22 eV
and this value is found to be greater than that of bulk CeO2
nanoparticles. The bulk band gap of CeO2 is 3.19 eV[39]. It
implies that the band gap energy of nanocrystalline CeO2
increases by 0.03 eV when compared to that of bulk CeO2
and this increase in the band gap energy is due to qunantum
confinement of charge carriers in the CeO2 nanosystem. As
a result, the absorption band is shifted to the range of higher energy and blue shift is observed.
The thermo gravimetric and differential thermal analyses (TG/DTA) are important to check the thermal stability and to identify various transitions (exothermic and endothermic) of a substance. Figure 2b shows the
thermograms (TG/DTA curves) of as-prepared CeO2
nanoparticles. The weight loss indicates the decomposition
of hydrated oxide, i.e. CeO2·H2O to CeO2. The endothermic
peak at 95 °C corresponds to the removal of adsorbed water and the amount of weight loss in TG curve noticed here is
low (0.42 mg). The exothermic peak (band) observed in between next stage happened in between 120-600 °C, which could be ascribed to removal of chemisorbed water and the release of organic residues that are trapped inside the pores. The next stage was observed in between 600-800 °C, which was likely due to the desorptions of the hydrated oxide on
the CeO2 nanoparticles. Thus, the decrease in the weight
occurs in a rather wide range of temperature40. The final
stage is ascribed to the combustion decomposition of the organic matters of the samples.
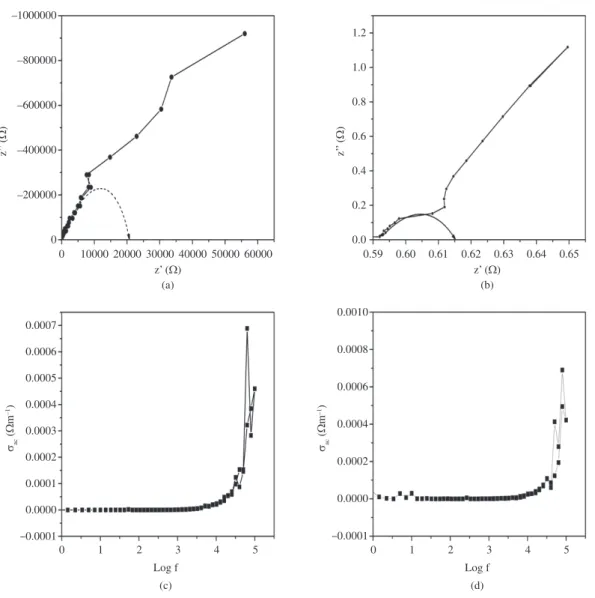
Impedance spectroscopy has been a useful tool for probing the electrical/dielectric properties and operation mechanisms
of organic and inorganic semiconductors/devices41-44.
Complex impedance plane plots of Z’ verses Z”, where Z’ and Z” are the real and imaginary parts of the complex impedance respectively. They are useful for determining the
dominant resistance of the sample45-49. Figure 3a, b shows
the complex impedance plots of the CeO2 nanoparticles
at 303 K and 373 K respectively. It shows that the data
with the help of XRD pattern and HRTEM images is 20 nm with cubic fluorite structure. Agglomeration of particles for the sample prepared by solvothermal method is inferred from SEM measurements. The Ceria nanoparticle showed good thermal stability and a strong UV–vis absorption below 400 nm with a well-defined absorption peak at 310 nm, the direct band gap was found to be 3.22 eV. The shift of the band gap absorption in the UV–vis spectrum agrees closely. The Cole-Cole plots of the above materials reveal the insulating (dielectric) nature of the materials. From the data
of AC conductivity of CeO2 sample, the insulating nature of
the sample is confirmed and also it is noticed that there is a slight increase of AC conductivity when the temperature of the sample increases.
Acknowledgements
The supports extended in the research by SAIF-STIC (Cochin), M.K. University (Madurai) and SAIF-NEHU (Shillong) is gratefully acknowledged. Also we thank authorities of Management of Infant Jesus College of Engineering and Technology, Tuticorin, Aditanar College of Arts and Science, Tiruchendur, and The MDT Hindu College, Tirunelveli for the encouragement given to us to carry out the research work.
points lie on the single semicircle where center lies on axis off the real axis and increase like a straight line. It is
observed that the CeO2 nanoparticles are insulators in lower
temperature and at higher temperatures its conductivity increases. The Figures 3c, d show initially the samples having semiconducting nature at lower frequencies and dielectric nature at higher frequencies. From the data of
AC conductivity of CeO2 sample, the insulating nature of
the sample is confirmed. The exponential increase of the AC conductivity value with frequency at 303 K and 373 K is similar. It is observed that in the temperature range 303-373 K, there is no remarkable change of conductivity
since the sample is a metal-oxide (CeO2) and also it is
noticed that there is a slight increase of AC conductivity when the temperature of the sample increases up to 373 K
from 303 K50.
4. Conclusion
Microwave-assisted solvothermal method has been successfully established for the preparation of
nanocrystalline CeO2 particles. The method is found to
be convenient, rapid, and efficient also for the possibility to control the morphological and structural properties. Single phase Ceria nanocrystals were obtained after proper annealing. The average particle size of samples calculated
References
1. Murray EP, Tsai T and Barnett SA. A direct-methane fuel cell with a ceria-based anode. Nature. 1999; 400:649-651. http:// dx.doi.org/10.1038%2F23220
2. Li RX, Yabe S, Yamashita M, Momose S, Yoshida S, Yin S et al. Synthesis and UV-shielding properties of ZnO- and CaO-doped CeO2 via soft solution chemical process. Solid StateIonics. 2002; 151:235-241. http://dx.doi.org/10.1016%2 FS0167-2738%2802%2900715-4
3. Sanchez MG and Gazquez JL. Oxygen vacancy model in strong metal-support interaction. Journal of Catalysis. 1987; 104:120-135. http://dx.doi.org/10.1016% 2F0021-9517%2887%2990342-3
4. Jiang M, Wood NO and Komanduri R. On chemo-mechanical polishing (CMP) of silicon nitride (Si3N4) workmaterial with various abrasives. Wear. 1989; 220:59-71. http://dx.doi.org/1 0.1016%2FS0043-1648%2898%2900245-2
5. Izu N, Shin W, Murayarna N and Kanzaki S. Resistive oxygen gas sensors based on CeO2 fine powder prepared using mist pyrolysis. Sensors and Actuators B: Chemical . 2002: 87:95-98. http://dx.doi.org/10.1016%2FS0925-4005%2802%2900224-1 6. Yabe S and Sato T. Cerium oxide for sunscreen cosmetics.
Journal Solid state Chemistry. 2003; 171:7-11. http://dx.doi. org/10.1016%2FS0022-4596%2802%2900139-1
7. Chen PL and Chen IW. Reactive Cerium(IV) Oxide Powders by the Homogeneous Precipitation Method. Journal of American Ceramic Society.1993; 76:1577-1583. http://dx.doi. org/10.1111%2Fj.1151-2916.1993.tb03942.x
8. Djuricic B and Pickering S. Nanostructured cerium oxide: preparation and properties of weakly-agglomerated powders.
Journal of the European Ceramic Society. 1999; 19:1925-1934. http://dx.doi.org/10.1016%2FS0955-2219%2899%2900006-0 9. Zhou XD, Huebner W and Anderson HU. Room-temperature homogeneous nucleation synthesis and thermal stability of nanometer single crystal CeO2. Applied Physics Letters. 2002; 80:3814-3816. http://dx.doi. org/10.1063%2F1.1481244
10. Wu NC, Shi EW, Zheng YQ and Li WJ. Effect of pH of Medium on Hydrothermal Synthesis of Nanocrystalline Cerium(IV) Oxide Powders. Journal of American Ceramic Society. 2002; 85:2462-2468. http://dx.doi. org/10.1111%2Fj.1151-2916.2002.tb00481.x
11. Hirano M and Kato E. The hydrothermal synthesis of ultrafine cerium(iv) oxide powders. Journal of Materials Science Letters. 1996; 15:1249-1250. http://dx.doi. org/10.1007%2FBF00274391
12. Li LP, Lin XM and Li GS, Inomata H. Solid solubility and transport properties of Ce1−xNdxO2−δnanocrystalline solid solutions by a sol-gel route. Journal of Material Research. 2001; 16:3207-3213. http://dx.doi.org/10.1557%2FJMR.2001.0442 13. Masui T, Fujiwara K, Machida KI, Adachi GY, Sakata
T and Mori H. Characterization of Cerium(IV) Oxide Ultrafine Particles Prepared Using Reversed Micelles. Chemistry of Materials. 1997; 9:2197-2204. http://dx.doi. org/10.1021%2Fcm970359v
14. Komarneni S and Rajha R. Microwave-hydrothermal processing of titanium dioxide. Materials Chemistry and Physics. 1999; 61:50-54. http://dx.doi.org/10.1016%2 FS0254-0584%2899%2900113-3
32. Zhang DS, Fu HX, Shi LY, Pan CS, Li Q, Chu YL et al. Synthesis of CeO2 Nanorods via Ultrasonication Assisted by Polyethylene Glycol. Inorganic Chemistry. 2007; 46:2446-2451. http://dx.doi.org/10.1021%2Fic061697d
33. Phoka S, Laokul P, Swatsitang E, Promarak V, Seraphin S and Maensiri S. Synthesis, structural and optical properties of CeO2 nanoparticles synthesized by a simple polyvinyl pyrrolidone (PVP) solution route. Materials Chemistry and Physics. 2009; 115:423-428. http://dx.doi.org/10.1016%2Fj. matchemphys.2008.12.031
34. Nakagawa K, Murata Y, Kishida M, Adachi M, Hiro M and Susa K. Formation and reaction activity of CeO2 nanoparticles of cubic structure and various shaped CeO2–TiO2 composite nanostructures. Materials Chemistry and Physics. 2007; 104:30-39. http://dx.doi.org/10.1016%2Fj. matchemphys.2007.02.047
35. Tao Y, Wang H, Xia Y, Zhang G, Wu H and Tao G. Preparation of shape-controlled CeO2 nanocrystals via microwave-assisted method. Materials Chemistry and Physics. 2010;124:541-546. http://dx.doi.org/10.1016%2Fj.matchemphys.2010.07.007 36. Tauc J. Amorphous and liquid semiconductors. New York: J. Tauc
Ed; 1974. http://dx.doi.org/10.1007%2F978-1-4615-8705-7_4 37. Ni XM, Zhao QB, Zhou F, Zheng HG, Cheng J and Li BB.
Synthesis and characterization of NiO strips from a single source. Journal of Crystal Growth. 2006; 289:299-302. http:// dx.doi.org/10.1016%2Fj.jcrysgro.2005.10.017
38. Hogarth CA and Al-Dhhan ZT. Optical Absorption in Thin Films of Cerium Dioxide and Cerium Dioxide Containing Silicon Monoxide. Physica Status Solidi B. 1986; 137(2):k157-k160. http://dx.doi.org/10.1002%2Fpssb.2221370245
39. Liao XH, Zhu JM, Zhu JJ, Xu JZ and Chen HY. Preparation of monodispersed nanocrystallineCeO2 powders by microwave irradiation. Chemical Communication. 2001; 10:937-938. http://dx.doi.org/10.1039%2Fb101004m
40. Yoshio N, Mitsuo K and Junichi N. Factors Governing the Initial Process of TiO2 Photocatalysis Studied by Means of in-Situ Electron Spin Resonance Measurements. Journal of Physical Chemistry B. 1998; 102:10279-10283. http://dx.doi. org/10.1021%2Fjp982886n
41. Meier M, Karg S and Riess W. Light-emitting diodes based on poly-p-phenylene-vinylene: II. Impedance spectroscopy. Journal of Applied Physics. 1997; 82:1961-1966. http://dx.doi. org/10.1063%2F1.366004
42. Berleb S and Brütting W. Dispersive Electron Transport in tris(8-Hydroxyquinoline) Aluminum (Alq3) Probed by Impedance Spectroscopy. Physics Review Letters. 2002; 89:286601-286604. http://dx.doi.org/10.1103%2FPhysRevLett.89.286601 43. Bisquert J, Garcia-Belmonte G, Pitarch A and Bolink
HJ. Negative capacitance caused by electron injection through interfacial states in organic light-emitting diodes. Chemical Physical Letters. 2006; 422:184-191. http://dx.doi. org/10.1016%2Fj.cplett.2006.02.060
44. Nguyen ND, Schmeits M and Loebl HP. Determination of charge-carrier transport in organic devices by admittance spectroscopy: Application to hole mobility in α-NPD. Physics Review B. 2007; 75(7):075307. http://dx.doi.org/10.1103%2F PhysRevB.75.075307
45. Barsoukov E and MacDonald JR. Impedance Spectroscopy, Theory, Experiment and Application. 2nd ed. Wiley-Interscience; 2005.
46. Nan CW, Tschope A, Holten S, Kliem H and Birringer R. Grain size-dependent electrical properties of nanocrystalline ZnO. Journal of applied physics. 1999; 85:7735-7741. http:// dx.doi.org/10.1063%2F1.370578
Material Science and Engineering B. 2001; 85:85-89. http:// dx.doi.org/10.1016%2FS0921-5107%2801%2900647-X 16. Tu WX and Liu HF. Rapid synthesis of nanoscale colloidal
metalclusters by microwave irradiation. Journal of Material Chemistry. 2000; 10:2207-2211. http://dx.doi. org/10.1039%2Fb002232m
17. Wang H, Xu JZ, Zhu JJ and Chen HY. Preparation of CuO nanoparticles by microwave irradiation. Journal of Crystal Growth. 2002; 244:88-94. http://dx.doi.org/10.1016%2 FS0022-0248%2802%2901571-3
18. Gabriel C, Gabriel S, Grant EH, Halstead BSJ and Mingos DMP. Dielectric parameters relevant to microwave dielectric heating. Chemical Society Review. 1998; 27: 213-216. http:// dx.doi.org/10.1039%2Fa827213z
19. Zhang D-E, Ni X-M, Zheng H-G, Zhang X-J and Song J-M. Fabrication of rod-like CeO2: Characterization, optical and electrochemical properties. Solid State Sciences. 2006; 8:1290-1293. http://dx.doi.org/10.1016%2Fj. solidstatesciences.2006.08.003
20. He Y. Synthesis of polyaniline/nano-CeO2 composite microspheres via a solid-stabilized emulsion route. Materials Chemistry and Physics. 2005; 92:134-137. http://dx.doi. org/10.1016%2Fj.matchemphys.2005.01.033
21. Yang H, Huang C, Tang A, Zhang X and Yang W. Microwave-assisted synthesis of ceria nanoparticles. Materials Research Bulletin. 2005; 40:1690-1695.
22. Yu K-L, Ruan G-L, Ben Y-H and Zou J-J. Convenient synthesis of CeO2 nanotubes. Materials Science and Engineering B. 2007; 139:197-200. http://dx.doi.org/10.1016%2Fj. mseb.2007.02.011
23. Meron T and Markovich G. Ferromagnetism in Colloidal Mn2+-Doped ZnO Nanocrystals. Journal of Physical
Chemistry B. 2005; 109:20232-20236. http://dx.doi. org/10.1021%2Fjp0539775
24. Cullity BD. Elements of X-ray diffraction. Addison-Wesley Publishing Co, Inc.; 1967.
25. Vijai Anand K, Karl Chinnu M, Mohan Kumar R, Mohan R and Jayavel R. Formation of zinc sulfide nanoparticles in HMTA matrix. Applied Surface Science. 2009; 255:8879-8882. http:// dx.doi.org/10.1016%2Fj.apsusc.2009.06.070
26. Chang H-Y and Chen H-I. Morphological evolution for CeO2 nanoparticles synthesized by precipitation technique. Journal of Crystal Growth. 2005; 283:457-468. http://dx.doi. org/10.1016%2Fj.jcrysgro.2005.06.002
27. Xu J, Li G and Li L. CeO2 nanocrystals: Seed-mediated synthesis and size control. Materials Research Bulletin. 2008; 43:990-995. http://dx.doi.org/10.1016%2Fj.materresbull.2007.04.019 28. Jin H, Wang N, Xu L and Hou S. Synthesis and conductivity of
cerium oxide nanoparticles. Materials Letters. 2010; 64:1254-1256. http://dx.doi.org/10.1016%2Fj.matlet.2010.02.062 29. Chen HI and Chang HY. Homogeneous precipitation of
cerium dioxide nanoparticles in alcohol/water mixed solvents. Colloids and Surface: A. 2004; 242:61-69. http://dx.doi. org/10.1016%2Fj.colsurfa.2004.04.056
30. Hu CG, Zhang ZW, Liu H, Gao PX and Wang ZL. Direct synthesis and structure characterization of ultrafine CeO2 nanoparticles. Nanotechnology. 2006; 7(24):5983-5897. http:// dx.doi.org/10.1088%2F0957-4484%2F17%2F24%2F013 31. Xu JX, Li GS and Li LP. CeO2 nanocrystals:
49. Kai Y, Qiang Z and Xiwen S. Study on rare earth/ alkaline earth oxide-doped CeO2 solid electrolyte. Rare metals. 2007; 26:311-316. http://dx.doi.org/10.1016%2 FS1001-0521%2807%2960221-6
50. Selvarajan P, Siva dhas A, Freeda TH and Mahadevan CK. Growth, XRD and dielectric properties of triglycine sulpho-phosphate (TGSP) crystals added with magnesium sulfate. Physica B. 2008; 403:4205-4208. http://dx.doi. org/10.1016%2Fj.physb.2008.09.006
47. Bauerle JE. Study of solid electrolyte polarization by a complex admittance method. Journal of Physics and Chemistry of Solids. 1969; 30:2657-2670. http://dx.doi.org/10.1016% 2F0022-3697%2869%2990039-0