UDK 553.689:57.017.22:666.651
Structure Study of Donor Doped Barium Titanate Prepared
From Citrate Solutions
B.D.Stojanovi
ć
1,3,V.R.Mastelaro
2, C.O. Paiva Santos
1, J.A.Varela
11
Instituto de Química - UNESP, Araraquara, SP, Brazil
2
Instituto de Física de São Carlos - IFSC-USP, São Carlos, SP Brazil
3
Center for Multidisciplinary Studies University of Belgrade, Serbia and Montenegro
Abstract:
Barium titanates doped with Nb5+, and Y3+, were prepared. The starting powders were synthesized from citrate solutions by the Pechini process and partial Pechini process in two steps. Sintering was performed in the range from 13100 up to 13800C for 2 hours in air atmosphere. The structural study concerning the incorporation of Nb and Y ions in the barium titanate crystal lattice was performed by XRD, XANES and EXAFS techniques. The dielectric properties were analyzed and the relationship between properties and structure of doped barium titanate was established.
Keywords: Barium titanate; Polymeric precursors; Structure; XRD; XANES; EXAFS; Dielectric properties
1. Introduction
To date, barium titanate is the most extensively investigated ferroelectric material, because it is extremely interesting from the point of view of practical applications [1, 2]. First, because it is chemically and mechanically very stable, secondly, because it exhibits ferroelectric properties at and above room temperature, and finally, because it can be easily prepared and used in the form of ceramic polycrystalline samples.
It is known that pure barium titanate is an insulator with a large energy gap (~3.05 eV at room temperature) and becomes semiconducting when slightly doped with aliovalent ions as donors. Semiconducting barium titanate can be produced by replacing Ba-ion sites by a trivalent ion (e.g. La3+,Sb3+, Y3+), or by a pentavalent ion (e.g. Nb5+, Sb5+, Ta5+) on Ti-ion sites
[5]. This substitution is charge compensated by a valence shift, providing a shallow donor level from which electrons can be excited into the conduction 3d band [6]. As the doping concentration exceeds a certain limit, it changes into an insulator again because of the formation of ionic defects which compensate for the extra charge from donors [5]. However, there are controversial arguments, concerning the defect models of compensation for donors starting from barium vacancies near grain boundaries of barium titanate, as proposed Heywang, Dancel, and Chan or from titanium vacancies proposed by Jonker and Havinga, and Shaikh and Vest [7-12]. Although the two defect models seem to conflict, it is noticed that the main difference is in amount of donor dopants. A minor amount of donor dopants supported the first model, and on the other hand, the second model was supported for highly donor-doped BT.
_____________________________
Niobium and yttrium are donor dopants. Since niobium and yttrium ions have different valences than that of the barium or titanium ion, substitution by Nb– or Y-ions produces a charge imbalance and charge compensation requires that electron, electron holes, or vacancies be produced. Par example, it was determined that niobium addition at a low concentration could produce a charge compensation mechanism by electron mobility, according to:
2BaO + Nb2O5→ 2 BaBa + 2 NbTi· + 6 Oo + ½ O2 (g) + 2e’ (1)
As a consequence, a reduction in the titanium valence (Ti+4 to Ti+3) is produced, and structures like Ba+2(Ti1-2x+4Nbx+5Tix+3)O3 could appear [13]. On the other hand, when the
niobium concentration increases, a charge compensation mechanism by ionic defects is produced, according to:
BaO + Nb2O5→ BaBa + VBa” + 2 NbTi· + 6 Oo (2)
6 BaO + 3 Nb2O5→ 6 BaBa + VBa” + 6 NbTi· + VTi”” + 21 Oo (3)
Besides the above equilibrium mechanisms, segregation of the titanium-rich phase with incorporated niobium could be also expected in BaTiO3 based ceramics.
The powder processing and sintering conditions have a strong influence on the mechanism of doping, creation of defects, as well as on the type of crystalline structure obtained and finally, according to that, on the properties of barium titanate ceramics. In view of the above, our paper reports on work carried out on barium titanate doped with niobium and yttrium. The objective of this work is to make clear the influence of the named dopants on the crystal structure of doped barium titanate prepared from citrate solutions through the polymeric precursor method. Structural studies related to incorporation of Nb and Y in the barium titanate crystal lattice were performed by X-ray diffraction (XRD) and X-Ray Absorption Near-Edge Structure (XANES) and Extended X-Ray Absorption Fine Structure (EXAFS).
2. Experimental work
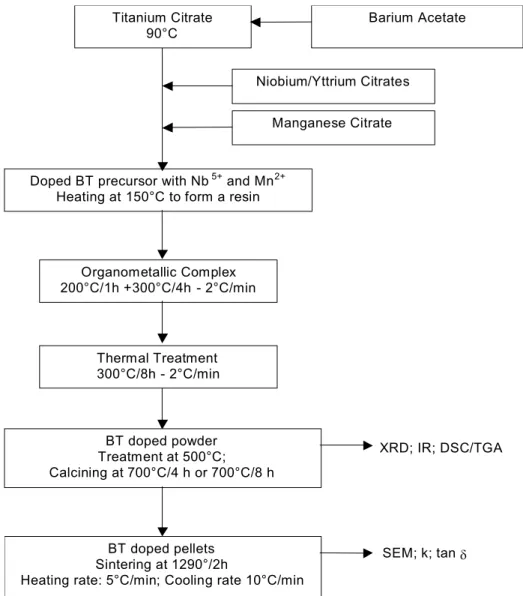
Barium titanate (BT) powders were prepared from polymeric precursors using a method based on the Pechini process (PPM) or partial Pechini process in two steps (TSP) [8]. Niobium oxide (up to 0.8 mol%) and yttrium (0.4 mol %) were used as dopants. The Ba/Ti ratio was 1:1. Barium acetate, titanium tetraisopropoxide, niobium oxide, yttrium oxide, citric acid and ethylene glycol were used as raw materials. In the PPM process the doped BT was carried out as a three-stage process using citrate solutions of all components mixed together. In the TSM process pure BT was previously prepared and after that doped with Nb or Y. More details about the procedure were reported previously [9,10]. The obtained powders were calcined at 700 and 800°C for 2 hours. After calcination and milling, the powders were pressed at 175 MPa into pellets of 10 x 2.5 mm2 using a cold isostatic press. The sintering process was carried out at 1310°C and 1330oC for 2 hours with a heating rate of 5°C/min and 10°C/min during cooling in air atmosphere. The procedure for BT preparation is presented as a flow chart on Fig. 1.
Hastings profile function and the Riello-Canton-Fagherazzi asymmetry function were used. The background was fitted to a 6th degree polynomial.
Fig. 1. Flow chart for the preparation of doped barium titanate from citrate solutions
XRD; IR; DSC/TGA
Doped BT precursor with Nb5+ and Mn2+
Heating at 150°C to form a resin
Niobium/Yttrium Citrates
Manganese Citrate
Organometallic Complex 200°C/1h +300°C/4h - 2°C/min
Thermal Treatment 300°C/8h - 2°C/min
BT doped powder Treatment at 500°C; Calcining at 700°C/4 h or 700°C/8 h
BT doped pellets Sintering at 1290°/2h
Heating rate: 5°C/min; Cooling rate 10°C/min Titanium Citrate
90°C
Barium Acetate
SEM; k; tanδ
The Ti K-edge and Ba LIII edge X-Ray Absorption spectra were collected at the
LNLS (Laboratório Nacional de Luz Sincrotron, Campinas, Brazil) facility using the XAS beam line [11]. The LNLS storage ring was operated at 1.36 GeV and 100-160 mA. Data were collected at the Ti K-edge (4966 eV) and Ba LIII edge (5247 eV) in transmission mode
using a Si (111) channel-cut monochromator. Ionization chambers were used to detect the incident and transmitted flux. Due to the presence of the BaLIII edge at 5247 eV, only the
XANES (X-Ray Absorption Near-Edge Structure) spectra were collected at the Ti K edge. An energy step equal to 0.4 eV and 1.0 eV was used to collect the data at the near the region of the absorption edge of titanium and barium atoms, respectively. The energy calibration of the monochromator was checked after each spectrum using a Ti metal foil to provide good energy reproducibility.
obtained by a standard procedure [12], normalized, background removed, and Fourier transformed using programs available for Macintosh computers [13].
The dielectric properties were measured using an impedance analyzer (HP 4192A) coupled with a furnace.
3. Results and discussion
It is known that precursor-prepared barium titanate (BT) powders may reach a high chemical homogeneity. The kinetics of phase formation was reported earlier [17-19]. Powders obtained after calcination were fine-grained and significantly influenced the processes of consolidation, densification and sintering behavior.
The dopants have a deep effect on the properties of BaTiO3. However, in addition to
the variety of functions that a dopant can display, analysis of the dopant role is rather complicated. Niobium in lower concentrations enhances grain growth improving the properties, while close to or above the limit of dopant solubility in barium titanate it inhibits grain growth and changes electrical properties [18]. Yttrium has a prominent influence on grain growth and could enhance grain growth. In fact, the major role of both donor cations (Nb5+ and Y3+) is their ability to influence grain boundary mobility because the charge compensation has an important effect on that. According to literature data the concentration of less than 0.6 mol % is close to the limit of solubility of niobium and yttrium dopants in barium titanate in the observed temperature regime [19]. Since the niobium ion has a different valence than barium or titanium ions, substitution by niobium produces a charge imbalance. Looking to ionic radii, Nb5+ can be a substitute to Ti4+ at the B-site perovskite lattice. On the other hand, Y3+ is the donor dopant replacing Ba2+ ions at the A-site perovskite lattice resulting in n-type conduction. Thus, in both cases, the ion with a higher valence state exchanges the ion with the lower valence state resulting in a charge imbalance and creation of a more rich defect structure of barium titanate. Besides, the small amount of excess of titanium rich phase is possible above the BaTiO3-Ba6Ti17O40 eutectic temperature and the
rather small amount of liquid phase can change the morphology of niobium or yttrium doped barium titanate grains influencing the dielectric properties of doped barium titanate.
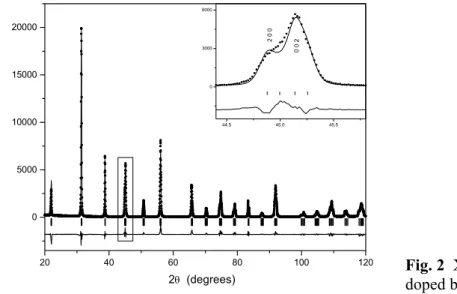
A clearer picture concerning the effect of both dopants on barium titanate could be done by analyzing the influence of niobium and yttrium on the structure of barium titanate. Looking for the structure of doped barium titanate, in all investigated BT samples, the obtained phase was tetragonal with the P4mm space group (Fig. 2.). Unit cell refinement showed that the tetragonality of BT was changed by introducing the Nb dopant. Otherwise, the change is not significant for the Y doped material. The table below (Tab. I) presents the unit cell parameters and tetragonality factors c/a. The ionic radius of Y3+ (=1.34Å) is smaller than the ionic radius of Ba2+ (=1.39Å) being substituted and causes the decrease of the unit cell volume although the tetragonality factor does not change. The ionic radius of Nb5+ (=0.69Å) is almost the same as the ionic radius of Ti4+ (=0.68Å) but in this case it causes an increase of the unit cell volume and decrease of the tetragonality factor. It can be attributed to the oxidation state of Y-ion, that yttrium does not vary from it stable value “3+”, and to the rather small amount of barium and oxygen vacancies in the lattice. On the other hand the more expressed effect of niobium could be explained by the creation of a higher concentration of various defects in the crystal structure of barium titanate influencing the change of crystal lattice parameters (equations 1. to 3.).
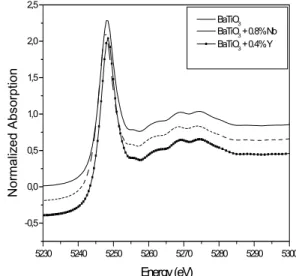
The results obtained by XANES and EXAFS analysis using the Ti K-edge XANES spectra of BaTiO3 samples, undoped, and doped with 0.8% of Nb and 0.4 % of Y are
presented at Fig. 3. The XANES spectra of BaTiO3 are similar to that published in literature
[20-26]. As can be observed, the introduction of Nb and Y as dopants in the BaTiO3 structure
spectra of transition metal oxides are strongly dependent on the symmetry of the transition metal site and titanium and other transition metals possess unoccupied electron states of d
character.
20 40 60 80 100 120
0 5000 10000 15000 20000
In
ten
s
ity (
c
ts
)
2θ (degrees)
44.5 45.0 45.5
0 3000 6000
0 0
2
2 0
0
Fig. 2 XRD data for niobium doped barium titanate
The states are inaccessible to the dipole excitation of an s electron and displacement of the transition metal from its site of centrosymmetry drives the mixing of p character of the transition metal atom. The presence of a large peak in the XANES spectrum before the main rise in the spectrum (4965-4975 eV) is the signature of a large displacement of the transition atom from its centrosymmetric site [22].
Tab. I Unit cell parameters for pure and doped barium titanate Unit cell parameters for the pure and doped BT
Pure BT (PPM)
Nb doped (0.4 mol %) (PPM)
Nb doped (0.4 mol %) (TSP)
Y doped (0.4 mol %) (PPM)
a [Å] 3.99406(5) 4.0007(1) 4.0005(1) 3.99389(7)
c [Å] 4.03603(6) 4.0254(2) 4.0241(1) 4.03610(9)
c/a 1.01051(3) 1.00617(8) 1.00590(6) 1.01057(4)
V [Å3] 64.385(2) 64.420(3) 64.403(3) 64.380(2)
esd’s are given in parentheses.
It is well known that the BaTiO3 sample undergoes phase transitions from
rhombohedral structure to orthorhombic at 183 K, orthorhombic to tetragonal at 278 K and tetragonal to cubic at 393 K [22]. However, according to the work of Ravel et al. [21], the local structure around Ti atoms in BaTiO3 remains rhombohedral at all temperatures. Due to
the similarity of the XANES spectra presented on Fig. 3 with that of Ravel’s work, and results obtained using Thompson-Cox-Hastings profile function and the Riello-Canton-Fagherazzi asymmetry, it was concluded that the local structure of Ti atoms in samples is not affected and significantly changed by the introduction of dopants like Nb and Y.On the other hand, Fig. 4shows the XANES spectra obtained at the Ba LIII edge. The XANES spectra of BaTiO3
samples are very similar to the BaTiO3 XANES spectra obtained by H. Rumpf et al. for a
sample with 700nm particle size and also did not show any influence from the dopants [24]. Fig. 5 shows the Ba LIII edge EXAFS spectra of BaTiO3 samples. The Fourier
Å-1 range using a Kaiser-Bessel type window (τ=2.5). The modules obtained in this way are plotted versus R in Fig. 6. The main peak of the Fourier transform of the samples consists of one peak and one shoulder located between 1.6 and 4.1 Å. The Fourier transforms are not correct for the phase shift parameters, so the maximum peak positions are shifted to lower values compared to the real one.
4960 4970 4980 4990 5000 5010 5020 5030 0,0
0,8 1,6
BaTiO3 pure BaTiO3 + 0.8% Nb BaTiO3 + 0.4% Y
Nor m aliz e d Absor p ti o n Energy (eV)
5230 5240 5250 5260 5270 5280 5290 5300 -0,5 0,0 0,5 1,0 1,5 2,0 2,5 BaTiO3 BaTiO3 + 0.8% Nb BaTiO3 + 0.4% Y
Nor m aliz ed Ab s o rp tion Energy (eV)
Fig. 3 Normalized XANES spectra at the TiK-edge of BT samples, undoped and doped samples
Fig. 4 Normalized XANES spectra at the Ba LIII-edge of BT samples, undoped and
doped samples.
2 3 4 5 6 7 8 9
0,0 0,5
BaTiO3 BaTiO3 + 0.8% Nb BaTiO3 + 0.4% Y
k
χ
(
k
)
k(Å-1)
0 1 2 3 4 5 6
0 1 2 3 4 5 6 7
8 BaTiO3
BaTiO3 + 0.8% Nb BaTiO3 + 0.8% Y BaTiO3 Feff6
Fo ur ier T ransf o rm R(Å)
Fig. 5 EXAFS spectra of BT samples. Fig. 6 Fourier transform of the EXAFS signals presented in Figure 5 compared with the crystalline BaTiO3 Fourier transform
spectracalculated using the FEFF6.0 software
and 4.1 Å using the structural information of the rhombohedral or tetragonal phase for this region around Ba atoms [15]. Calculations were performed using the FEFF program (version 6.0) for Ba, Ti and O atoms within 4.0 Å from the Ba absorber [18]. The Fourier transform was obtained using the following diffraction data: Ba-O (Å) (3 x 2.786, 6 x 2.828 and 3 x 2.886), Ba-Ti (Å) (1 x 3.37, 3 x 3.43, 3 x 3.501 and 1 x 3.583) and Ba-Ba (Å) (6 x 4.00). The calculated Fourier transform is shown in Figure 6. In the calculation we have used only single-scattering parameters and as we can see, the first peak of the Fourier transform of the BaTiO3 pure crystalline sample is well reproduced. For BaTiO3 doped samples, we can
observe a slight amplitude increase in the Fourier transform first peak when compared to the undoped sample. If we agree that in all cases we have a rhombohedral local structure, this increase can be related to a decrease of local disorder. Thus, the addition of Nb and Y induces a decrease of local disorder around Ba atoms.
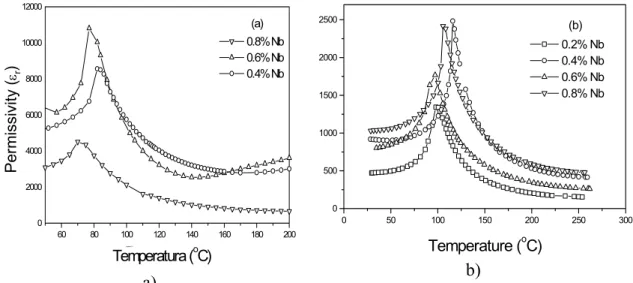
The variation of dielectric constant with temperature for samples with various compositions (Fig. 7a and b) showed that niobium and yttrium have a prominent influence on dielectric properties. A characteristic tetragonal-cubic phase transformation, from ferroelectric in the paraelectric phase of barium titanate was observed. The samples doped with Nb and prepared by PPM showed a rather high dielectric constant from 4500 up to 10700 at the Curie temperature (Tc = 82°C for BT doped with 0.4 mol%, 77°C for BT doped with 0.6 mol% and 70°C for BT doped with 0.8 mol%) (Fig. 7a) and 3000, 6300 and 4500 at room temperature justifying the influence of niobium doping on barium titanate. The samples doped with Nb prepared by TSM showed a rather low dielectric constant from 1400 up to 2600 at the Curie temperature (Tc = 98°C for BT doped with 0.2 mol%, 101°C for BT doped with 0.4 mol%, 100°C for BT doped with 0.6 mol% and 105°C doped with 0.8 mol%) (Fig. 7 b).
60 80 100 120 140 160 180 200 0
2000 4000 6000 8000 10000 12000
(a)
Per
m
issivity
(
εr
)
0.8% Nb 0.6% Nb 0.4% Nb
Temperatura (oC)
Temperatura (oC)
a)
0 50 100 150 200 250 300
0 500 1000 1500 2000
2500 (b)
0.2% Nb 0.4% Nb 0.6% Nb 0.8% Nb
Temperature (oC)
b)
Fig. 7Dielectric properties of doped barium titanate prepared through (a) PPM powder processing , (b) TSM powder processing
compared to yttrium ions is rather more expressed. That is a result of the creation of various type of defects, higher concentration of defects in the crystal structure, as well as from the fact that the Nb-ion exchanges the Ti –ion at the B- position of ABO3 (higher coordination
number)that influenced generally the total effect of the dopant. The introduction of dopants changes the charge balance in the crystal lattice of barium titanate because of the fact that an ion with a higher valence exchanges an ion with a smaller valence state. Next, analyzing the local structure of Ti and Ba atoms in doped barium titanate samples, it was mentioned that the local structure was not affected and significantly changed by the introduction of dopants like Nb and Y. The local structure around Ba and Ti atoms remains rhombohedral. A slight amplitude increase in the Fourier transform first peak when compared to the undoped sample can be related to a decrease of local disorder. Thus, the addition of Nb and Y induces a decrease of local disorder around Ba atoms and has a rather small influence on the local structure of Ti.
Finally, the dielectric behaviour of pure and doped barium titanate confirmed the presence of a tetragonal phase at room temperature and phase transition from tetragonal to cubic phase at the Curie temperature. That is in agreement with the results obtained through XRD analysis. The effect of dopants is expressed and influenced a change of the temperature of phase transition. Higher concentrations of dopants caused lowering of the Curie temperature. Besides, the effect of powder processing was obvious. Barium titanate obtained by the PPM process showed higher values of the dielectric constant at the Curie temperature than the other process (TSM). That was affected by small grain sized powders obtained by PPM and accordingly a microstructure with smaller grain sizes after sintering.
4. Conclusion
The obtained results indicated that the introduction of dopants like Nb and Y did not introduce significant changes in the local structure around Ti atoms, and according to the results published in literature, the local structure is similar to that of the rhombohedral phase. Analysis of the EXAFS spectra obtained at the Ba LIII edge shows that although the local structure is also similar to the rhombohedral phase, a decrease in local disorder is observed for all doped samples.
The crystal structure of Nb doped barium titanate showed smaller tetragonality. The effect of dopants on the change of tetragonality is more expressed in barium titanate doped with niobium than yttrium. The dielectric behaviour of doped barium titanate is in agreement with the presence of the tetragonal structure observed by XRD. The influence of dopants as well as powder processing is rather significant.
5. Acknowledgements
The authors acknowledge the Brazilian research funding institution CNPq (301007/99-3) and FAPESP (98/13678-3 and 00/01991-0) for the financial support for this work. The authors also gratefully acknowledge the facility for experiments in LNLS (Laboratório Nacional de Luz Sincrotron, Campinas, Brazil) and the Serbian Ministry for Science and Environmental Protection (project P1832).
6. References
2. G.H. Heartling, J. Amer. Ceram. Soc., 82, 4 ,797-818 (1999). 3. G. Bush, Ferroelectrics, 4, 267-284 (1987).
4. J. Fousek, Ferroelectrics, 113, 3-20 (1991).
5. M. Kuwabara, J. Amer. Ceram. Soc., 64, 11, 639-44 (1981).
6. A.S. Shaikh, R.W. Vest, J. Amer. Ceram. Soc., 69, 9 689-694 (1986). 7. A. Maccoy, W.E. Lee, R.W. Grimes, J. Mater. Sci. 33 5759-5771 (1998). 8. M. P. Pechini, US Patent 3,330,697 (1976).
9. B.D. Stojanovic, M.A. Zaghete, C.R. Foschini, F.O.S. Vieira, C.O Paiva Santos, M. Cilense ,J.A. Varela, Science of Sintering, 33, 3, (2001) (in press).
10. B.D. Stojanovic.;M. Zaghete, C.R. Foschini, J.A. Varela, Materials Engeneering, 12 (1), p 95-108, (2001).
11. H.C.N. Tolentino, A.Y. Ramos, M.C.M. Alves, R.A. Barrear, E. Tamura, J.C. Cezar and N. Watanabe, J. Synchrotron Rad. 8, 1040-1046 (2001).
12. D.E. Sayers and B.A. Bunker , in X-Ray Absorption Techniques of EXAFS, SEXAFS and XANES, edited by D.C. Konisberger, and R. Prins, (Wiley, New York, 1988). 13. A. Michalowicz, thesis, Université du Val de Marne, France, 1990
14. R. A. Young, Allen C. Larson and C.O. Paiva-Santos, “User's Guide to Program DBWS9807a for Rietveld Analysis of X Ray and Neutron Powder Diffraction Patterns with a `Pc' and Various Other Computers”, School of Physics. Georgia Institute of Technology. Atlanta, GA, USA, 1999.
15. H.C.N. Tolentino, A.Y. Ramos, M.C.M. Alves, R.A. Barrear, E. Tamura, J.C. Cezar and N. Watanabe, J. Synchrotron Rad. 8, 1040-1046 (2001).
16. D.E. Sayers and B.A. Bunker , in X-Ray Absorption Techniques of EXAFS, SEXAFS and XANES, edited by D.C. Konisberger, and R. Prins, (Wiley, New York, 1988). 17. A. Michalowicz, J. Phys. IV, France 7 (1997), C2-235.
18. A.I. Frenkel, M.H. Frey, D.A. Payne, J. Synchrotron Rad. 6, 515-517 (1999).
19. B. Ravel, E.A. Stern, R.I. Vedrinskii and V. Kraizman, Ferroelectrics 206-207, 407-430 (1998)
20. H. Rumpf, H. Modrow, J. Hormes, H.J. Glasel, E. Hartmann, E. Erdem, R. Bottcher, K.H. Hallmeier, J. Phys. And Chem. B 105, 3415-3421 (2001).
21. G.H. Kwei, A.C. Lawson, S.L. Billinge, S.W. Cheong, J. Phys. Chem. 97, 2368 (1993). 22. A.I. Frenkel, M.H. Frey, D.A. Payne, J. Synchrotron Rad. 6, 515-517 (1999).
23. B. Ravel, E.A. Stern, R.I. Vedrinskii and V. Kraizman, Ferroelectrics 206-207, 407-430 (1998)
24. G.H. Kwei, A.C. Lawson, S.L. Billinge, S.W. Cheong, J. Phys. Chem. 97, 2368 (1993). 25. H. Rumpf, H. Modrow, J. Hormes, H.J. Glasel, E. Hartmann, E. Erdem, R. Bottcher,
K.H. Hallmeier, J. Phys. And Chem. B 105, 3415-3421 (2001).
26. J.J. Rehr, J. Mustre de Leon, S.I. Zabinsky and R.C. Albers, J. Am. Chem. Soc. 113 (1988) 5135.
ю : П Nb5+ Y3+. И
П
П .
1310 13800 2 . (
XRD, XANES, EXAFS)
Nb5+ Y3+ . И
.
К юч вы ва: , , , XRD,
XANES, EXAFS, .
а а: П - Nb5+ Y3+. П
. 1310 13800
. И
Nb Y - ,
XRD, XANES EXAFS. ђ
ђ - .
К уч ч : - , , , XRD, XANES,