Denadai JC1
Ducatti C2
Pezzato AC3
Carrijo AS4
Caldara FR1
Oliveira RP1
1 Animal Science PhD student, Veterinary
Medicine and Animal Science School (FMVZ), São Paulo State University (UNESP).
2 Professor Doctor, Supervisor of the Stable
Isotopes Center, Biosciences Institute, São Paulo State University (UNESP).
3 Professor Doctor, Veterinary Medicine and
Animal Science School (FMVZ), São Paulo State University (UNESP).
4 Professor, Animal Production Department,
Mato Grosso do Sul Federal University (UFMS).
# Experiment sponsored by FUNDIBIO –
Fundação do Instituto de Biociências – São Paulo State University (UNESP), Botucatu, SP, Brazil
Juliana Célia Denadai Centro de Isótopos Estáveis Instituto de Biociências UNESP Universidade Estadual Paulista Caixa Postal 510
18.618-000. Botucatu, SP, Brazil
Phone: (+55) 14–3811 6359
Fax: (+55) 14–3815 1171
E-mail: [email protected]
Albumen; carbon-13; yolk; blood; egg; comercial laying hens.
The authors are grateful to the staff of the Stable Isotopes Center of the Biosciences
In-stitute of UNESP, Botucatu Campus, for
car-rying out the isotopic analyses.
Studies on carbon-13 turnover in eggs and
blood of commercial layers
#Mail Address
Keywords Author(s)
Arrived: July / 2006 Approved: November / 2006
ABSTRACT
This paper aimed at evaluating the influence of diets containing different isotopic values of carbon-13 turnover on the half-life of egg (yolk + albumen), yolk and albumen individually, and blood of poultry using δ‰13C isotopic variation. Commercial layers fed four experimental
isocaloric and isonitrogenous diets (RC4, RC3, RMC4 and RMC3) containing
different isotopic values, during an experimental period of 56 days. Turnover of the studied tissues was influenced by the experimental diets. Blood and albumen were more influenced by dietary treatments as compared to egg and yolk. The RMC3 diet induced better performance
(better feed intake and higher egg production) due faster rate of carbon substitution than the RC4 diet, and lower half-life for egg (yolk +
albumen), yolk, and albumen.
INTRODUCTION
Most of turnover studies using the natural variations of the delta per thousand of carbon-13 (δ‰13C)* of foods are related to ecological issues,
focusing on the substitution velocity of tissue carbon from food with different isotopic ratios due migrations and changes in trophic levels (Mizutani et al., 1991, Hobson 1995). However, stable isotopes technique can be useful in physiology and animal nutrition studies as the substitution rates of tissue carbon can be influenced by environmental, nutritional, and health factors (Carrijo et al., 2000).
The period during which the isotopic concentration of a tissue reflects the isotopic signature of a diet is partially dependent on the isotopic turnover rate of that tissue (Hobson and Clark, 1992a). Isotopic turnover rate depends on the absorption, synthesis, and catabolism rates of each tissue component (Gannes et al., 1998). Tissues with fast isotopic turnover rates reflect more recent diets, while those with slower turnover rates reflect diets fed during previous periods (Hobson and Clark, 1992a, b). Most metabolically active tissues (liver, pancreas, and adipose tissue) present faster turnover rates than the less metabolically active tissues, such as bone collagen (Hobson & Clark, 1992a).
Eggs, as other animal products, such as like milk and feces, are not considered tissues, and therefore it is not possible to calculate its tissue renewal rate (turnover). However, turnover studies in these products indicate that the renewal rate of nutrients for their synthesis reflect the metabolism of the tissues that generated these products.
Carrijo et al. (2000), studying carbon turnover in eggs and liver of laying hens, verified that carbon substitution time was similar in those tissues. This indicates that eggs could be used as an indirect measure of liver turnover rate, thereby avoiding the sacrifice of the birds. These
* Content of carbon-13 expressed in parts per thousand (‰) relative to the Peedee Belemnite
(PDB) standart.
authors recommend the separate isotopic rate analysis of egg fractions (albumen and yolk), because values found in eggs could result from isotopic dilution of fractions with different substitution velocity.
When working with diets based on grains of plants of the C3 and C4 photosynthetic cycle, a feed
formulation problem arises in diets containing C4 plants.
There are few C4 ingredients that can replace soybean
meal (C3), which is the main protein source of balanced
diets for commercial layers. An alternative ingredient to replace soybean meal is corn gluten, which is a by-product of corn starch removal, and which contains 60% crude protein. However, corn gluten presents some restrictions, as it is deficient in lysine and tryptophan for chickens, and due to its bitter flavor.
Ducatti et al. (2002), based on literature results , proposed a theoretical model to express the results of relative carbon enrichment (δ‰13C) in terms of feeding
time by supplying diets with different 13C isotopic values,
and comparing this with adult animals. We hypothesized the metabolism of certain animal tissues depends on the input rate of dietary carbon compounds and the substitution rate of the pre-existent compounds. This model is suitable for determining the total or partial (half-life) carbon substitution time in tissues in studies with poultry and small animals.
Kennedy & Krouse (1990) stated that stress related to external environmental factors, physical conditions, and diseases could cause variations in the isotopic fractionation.
The present study aimed at evaluating the influence of diets with different isotopic values on carbon-13 turnover of egg (yolk + albumen), yolk and albumen individually, and blood half-lives of commercial laying hens, using δ‰13C isotopic variation.
MATERIAL AND METHODS
commercial feed (based on corn, soybean meal, and wheat). This diet had a δ‰13C isotopic signal = -16.06
± 0.23 (n = 2). Average egg production was 52%. As these birds were at the end of their productive cycle, their egg production was low.
This trial lasted 84 days, including a 28 days of pre-experimental period. According to Carrijo et al. (2000), this pre-experimental period is sufficient for isotopic marking of eggs to happen. The objective of this period objective was to replace carbon derived from the commercial feed in the studied tissues by carbon derived from the new diets. Birds were divided in two groups of 48 each, with one group receiving a diet based on grains of C3 (RC3) photosynthetic cycle plants,
whereas the other was fed with a diet consisting of grains of C4 (RC4) photosynthetic cycle plants. At the
end of the adaptation period, birds started to receive the experimental diets.
The group fed the RC3 feed during the
pre-experimental period was divided in two treatments (n=24), which were fed RC4 and RMC4 diets afterwards.
The other group, which was being fed RC4, was also
divided in two treatments, and were fed RC3 and RMC3
diets (see treatment description below).
Treatments consisted of four isocaloric and isonitrogenous diets with different isotopic values, which were fed during the entire experimental period (56 days).
Treatments: Treatment 1 (RC
4) - Feed consisting of grains of C4
photosynthetic cycle plants.
Treatment 2 (RC
3) - Feed consisting of grains of C3
photosynthetic cycle plants.
Treatment 3 (RMC4) - Mixed feed consisting of
67% C4 grains and 33% C3 grains.
Treatment 4 (RMC
3) - Mixed feed consisting of
67% C3 grains and 33% C4 grains.
The mixed diets were used to obtain intermediate δ‰13C values as those of the pure diets with the
objective of evaluating the influence of the mixed diets and the possible improvement of the quality of the C4
diet.
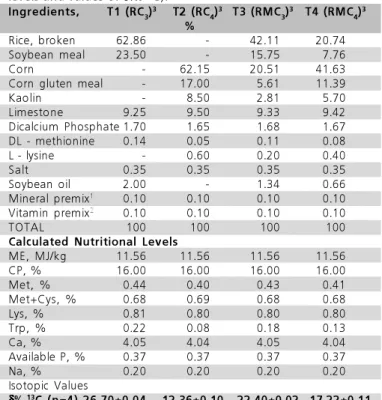
Nutritional composition of ingredients used in feed formulation, as well as nutritional requirements followed recommendations of Rostagno et al. (2000). The percentage composition, calculated nutritional levels, and δ‰13C values of the experimental diets are
shown in Table 1.
On the 0th, 1st, 2nd, 4th, 7th, 11th, 16th, 21st, 28th, 35th,
42nd, 49th, and 56th day of the experimental period,
The study was carried out at Lageado Experimental Farm, in the School of Veterinary Medicine and Animal Science (FMVZ) of São Paulo State University (UNESP), Botucatu campus.
4 hours. It is necessary to remove lipids from the sample because the presence of fat makes the isotopic signature lighter in 13C in relation to the diet. For
albumen and blood, the drying period was 24 hours, and these were not defatted because they have low fat content. All samples were ground in cryogenic mill (Spex freezer/mill 6750 model) for three minutes at -190oC, in order to obtain homogeneous material with
microscopic aspect (Ducatti, 2004).
Isotopic composition of samples was determined using a DELTA-S (Finnigan Mat) mass spectrometer coupled to an EA 1108 CHN Elemental Analyzer, in the Stable Isotopes Center facilities of the Biosciences Institute of UNESP, Botucatu campus. The results were expressed as δ‰13C relative to the
Peedee Belemnite
(PDB) standard, with analysis error of 0.2%, according to equation 1:
δ δδ δ δ‰13C
(sample, standard)=[(Rsample/Rstandard)– 1] x 10 3 (1)
Where:
δ‰13C = enrichment of the 13C/12C ratio of the
sample in relation to the PDB standard. R = isotopic ratio (13C/12C) of the sample and
the standard.
In order to quantitatively measure the carbon substitution speed of the diets after certain time, the exponential function expressed by equation 2 (Ducatti
et al., 2002) was used:
δ δδ δ
δ‰13C(t) = δδδδδ‰13C(f) + [δδδδδ‰13C(i) - δδδδδ‰13C(f)]e-kt (2)
Where:
δ‰13C(t) = isotopic enrichment of the tissue at any
time (t).
δ‰13C(f) = isotopic enrichment of the tissue at the
balanced base, or final status.
δ‰13C(i) = isotopic enrichment of the tissue, at the
initial condition.
k = change constant (turnover) in time units-1
t = time (in days) since feed was replaced.
Carbon-13 half-life for egg, yolk, albumen, and blood, in the condition of 50% of each diet in t = T was calculated by equation 3:
T = ln 2/k (3)
where,
T represents half-life in days In order to perform isotopic analyses, egg and yolk
samples were thawed, dried in forced ventilation oven (Marconi - MA 035 model) at 56oC for 48 hours, and
defatted in ethyl ether using the Soxhlet apparatus for eight eggs were randomly collected per treatment group on each collection day, with four eggs used for yolk and albumen sampling, and the other four eggs were homogenized in blender (yolk + albumen). Additionally, on each collection day, blood samples were taken from the wing vein of four birds per treatment. The samples were labeled, frozen, and stored at -18°C. The collections were concentrated in the first days due the higher velocity of carbon incorporation. Day zero was assumed when samples were obtained immediately before feed change, and its purpose was to express the isotopic composition of feed offered at the pre-experimental period
Table 1 – Composition of the experimental diets (calculated
levels and values of δ‰13C).
Ingredients, T1 (RC3)
3 T2 (RC 4)
3 T3 (RMC 3)
3 T4 (RMC 4)
3
%
Rice, broken 62.86 - 42.11 20.74
Soybean meal 23.50 - 15.75 7.76
Corn - 62.15 20.51 41.63
Corn gluten meal - 17.00 5.61 11.39
Kaolin - 8.50 2.81 5.70
Limestone 9.25 9.50 9.33 9.42
Dicalcium Phosphate 1.70 1.65 1.68 1.67
DL - methionine 0.14 0.05 0.11 0.08
L - lysine - 0.60 0.20 0.40
Salt 0.35 0.35 0.35 0.35
Soybean oil 2.00 - 1.34 0.66
Mineral premix1 0.10 0.10 0.10 0.10
Vitamin premix2 0.10 0.10 0.10 0.10
TOTAL 100 100 100 100
Calculated Nutritional Levels
ME, MJ/kg 11.56 11.56 11.56 11.56
CP, % 16.00 16.00 16.00 16.00
Met, % 0.44 0.40 0.43 0.41
Met+Cys, % 0.68 0.69 0.68 0.68
Lys, % 0.81 0.80 0.80 0.80
Trp, % 0.22 0.08 0.18 0.13
Ca, % 4.05 4.04 4.05 4.04
Available P, % 0.37 0.37 0.37 0.37
Na, % 0.20 0.20 0.20 0.20
Isotopic Values
δ δδ δ
δ‰13C (n=4)-26.70±0.04 -12.36±0.10 -22.40±0.02 -17.22±0.11
1 - Composition by kg of the mineral supplement: Copper: 8,000mg; Iron: 50,000mg; Manganese: 70,000mg; Zinc: 50,000mg; Iodine: 1,200mg; Selenium: 200mg; QSP Excipient: 1,000g. 2 - Composition by kg of the vitamin supplement: Vitamin A: 7,000,000 UI; Vitamin
D3: 2,000,000 UI; Vitamin E: 5,000 mg; Vitamin K3: 1,600mg; Vitamin
B2: 3,000mg; Vitamin B12: 8,000mcg; Niacin: 20,000mg; Panthotenic
Acid: 5,.000mg; Antioxidant: 15,000mg; QSP Excipient: 1,000g. 3
-T1 (RC4) - Feed consisting of grains of C4 photosynthetic cycle plants;
T2 (RC3) - Feed consisting of grains of C3 photosynthetic cycle plants.;T3
(RMC4) - Mixed Feed consisting of 67% C4 grains and 33% of C3
grains; T4 (RMC3) - Mixed Feed consisting 67% C3 grains and 33% C4
ln is the Neperian logarithm, and constant k presents time unit-1, providing an idea of “speed” in the
exchange process of stable isotopes in the tissues (Tieszen et al., 1983; Hobson & Clark, 1992a, b; Ducatti
et al., 2002; Ducatti, 2004).
Isotopic results were analyzed using regression equation method of Origin® 6.0 Professional (Microcal
Software, 1999) software, whereas performance results (feed intake, egg production, and egg mass) were statistically analyzed using analysis of variance (ANOVA), with the aid of the GLM procedure of the SAS software (1999). The test of Tukey at the probability level of 5% was used to compare treatment means.
RESULTS AND DISCUSSION
Table 2 shows the regression equations of the treatments in the different studied tissues. δ‰13C value
changes in tissues along time occurred gradually until a new balance was reached. This change can be seen in Figure 1, which illustrates turnoverbehavior in blood, egg, yolk, and albumen.
Blood carbon half-life was 13.3 days in RC4
treatment, and 5.3 days in RC3 treatment. Turnover
period was 2.5 times slower in the blood of RC4
treatment layers as compared to layers fed the RC3
diet. These results are consistent with those of Carrijo
et al. (2000), who evaluated liver and egg turnover rates of layers, and found higher half-life values when a C3 feed was replaced by a C4 diet as compared to
the inverse replacement. This slower turnover can be partly explained by the drastic feed intake reduction of layers fed RC4 (Table 3). Corn gluten may have
reduced palatability, and nutritionally unbalanced the feed mainly due to the level of tryptophan–, which was
not considered when the experimental feeds were formulated – was probably the reason of low feed intake.
Gonzales (2002) states that very sweet (20% of sucrose) or bitter water is usually rejected by poultry. This is also true for solid feed; poultry reject very sweet or bitter foods (Balog & Millar, 1989).
In addition, amino acids balance in the RC3 diet was
different from that in the RC4 diet (Table 1), where
Figure 1 – Experimental model of the turnover of carbon stable isotopes* (mean + standard-deviation, n = 4) of blood, egg, yolk,
and albumen of commercial laying hens with respective half-life values, in days, of treatments RC3, RMC3, RMC4, and RC4.
* Microcal Software Origin®6.0 Professional. Origin Data Analysis
and Technical Graphics. USA, Microcal Software Inc. 1999.
-5 0 5 10 15 20 25 30 35 40 45 50 55 60
-10 -12 -14 -16 -18 -20 -22 -24 -26 -28
RC4 T = 13.3 days
RM C4 T = 10.5 days
RM C3 T = 9.2 days
RC3 T = 5.3 days
Blood
δδδδ ‰ 13C
Time (days)
-5 0 5 10 15 20 25 30 35 40 45 50 55 60
-10 -12 -14 -16 -18 -20 -22 -24 -26 -28
RC3 T = 3.8 days
RMC3 T = 3.5 days
RM C4 T = 3.8 days
RC4 T = 4.8 days
Egg
δδδδ ‰
13C
Time (days)
-5 0 5 10 15 20 25 30 35 40 45 50 55 60
-10 -12 -14 -16 -18 -20 -22 -24 -26 -28
RM C3 T = 4.6 days
RM C4 T = 4.8 days
RC3 T = 4.5 days
RC4 T = 5.5 days
Yolk
δδδδ ‰
13C
Time (days)
-5 0 5 10 15 20 25 30 35 40 45 50 55 60
-10 -12 -14 -16 -18 -20 -22 -24 -26 -28
RM C3 T = 1.5 days
RM C4 T = 3.2 days
RC3 T = 2.5 days
RC4 T = 5.2 days
Albumen
δδδδ ‰
13C
Time (days)
Table 2 - Regression and half-life equations of blood, whole egg, and egg fractions (yolk and albumen) of commercial laying hens.
Tissues Treatments Equations (δ13
C) R2
CarbonHalf-life (days)
Blood(n=4) RC4 -11.95‰ – 13.63‰e
-0.052t 0.99 13.3
RC3 -26.15‰ + 12.14‰e
-0.132t 0.98 5.3
RMC4 -17.43‰ – 8.17‰e
-0.066t 0.99 10.5
RMC3 -21.90‰ + 7.87‰e
-0.076t 0.98 9.2
Egg(n=4) RC4 -13.10‰ – 13.82‰e
-0.146t 0.99 4.8
RC3 -26.36‰ + 14.95‰e
-0.181t 0.99 3.8
RMC4 -17.41‰ – 9.83‰e
-0.185t 0.99 3.8
RMC3 -21.89‰ + 9.42‰e
-0.200t 0.98 3.5
Yolk(n=4) RC4 -13.01‰ – 14.99‰e
-0.127 0.99 5.5
RC3 -27.13‰ + 16.70‰e
-0.153t 0.99 4.5
RMC4 -17.67‰ – 9.97‰e
-0.143t 0.99 4.8
RMC3 -22.50‰ + 9.96‰e
-0.151t 0.99 4.6
Albumen(n=4) RC4 -12.30‰ –13.48‰e
-0.133t 0.95 5.2
RC3 -26.14‰ + 14.54‰e
-0.277t 0.98 2.5
RMC4 -17.06‰ – 8.86‰e
-0.220t 0.99 3.2
RMC3 -21.20‰ + 11.26‰e
exclusively C4 due the interference of the diet on
metabolism. This fact is probably more related to the supply of nutritional requirements than to photosynthetic cycle type of the plants included in the diets.
The half-life value for the egg (yolk + albumen) of layers fed the RC3 diet was 3.8 days, and 4.8 days birds
in RC4 treatment. These results agree with those of
Carrijo et al. (2000), who evaluated liver and egg turnover rates of layers, and obtained half-life values of 3.7 days when a C4 diet was replaced for a C3 diet.
These authors also found a value of 4.0 days when the C3 diet was replaced for the C4 diet. In the present
study, carbon half-life values of eggs from RMC4 and
RMC3 treatments were 3.8 days and 3.5 days,
respectively.
The yolk carbon half-life of the RC3 treatment was
4.5 days, whereas 5.5 days were calculated for the RC4 treatment (Table 2). Intermediary and values similar
to the RC3 treatment were found for yolks from layers
in treatments RMC4 and RMC3, which were 4.8 days
and 4.6 days, respectively.
The albumen of layers in the RC4 treatment had
carbon half-life of 5.2 days, a while for the birds in treatments RC3, RMC4, and RMC3, values were 2.5,
3.2, and 1.5 days, respectively. The possible reason for the slower turnover of albumen in RC4 treatment is
that, as amino acids for albumen formation are directly taken from blood plasma and blood, and these birds may still have had carbon from the previous diets in the body (slow turnover), this carbon was used for albumen formation in these birds.
Hobson (1995), studying turnover of quail egg components, stated that total carbon replacement from egg yolk took eight days, and from albumen, from three to five days. These data are different from the findings of this study, which may be due to the fact that Hobson (1995) studied different species and diets. In addition, quails were producing eggs daily, whereas in the present study, layer hens produced one egg every other day.
Egg carbon turnover values are intermediate to yolk and albumen values, showing the influence of each component (yolk and albumen) in their formation process, where the yolk takes longer to reflect the new diet.
During the physiological process of egg formation, the ovary programs a sequence of ova in different development stages (approximately eight days of production). Therefore, in the eggs collected in the beginning of the trial, yolk had a large influence of The high feed intake of birds in RC3 and RMC3
treatments was probably due to thefeed offered in the pre-experimental period , when these birds were fed a diet formulated exclusively with C4 ingredients. After
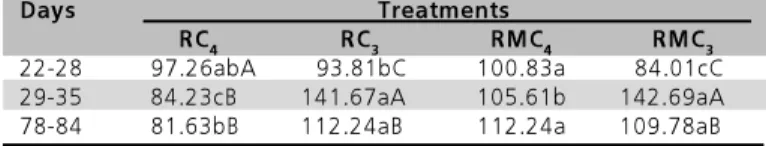
feed change (29-35 days), feed intake was dramatically increased to compensate the low feed intake of the last phase.
Studies demonstrated that poultry can control their feed intake based on feed protein amount and quality. Feed intake regulation theory by dietary protein considers the principle that the detection of plasmatic levels of amino acids, particularly of the nutritionally essential amino acids, takes place by activating control systems in the central nervous system (Gonzales, 2002).
Feed intake regulation mechanism is essentially homeostatic, with variations in feed intake depending on protein quality and amount in the feed. Feeds with serious amino acids unbalance induce a marked decrease in intake (Boorman, 1979). These factors may have contributed for a reduction in the layer metabolism rate, and consequently blood carbon turnover.
Carbon half-life values in the blood of layers in the intermediate treatments (RMC4 and RMC3) were 10.5
days and 9.2 days, respectively. These values were not different from RC4 treatment. These results are
consistent with those obtained by Hobson & Clark (1992a), who, working with substitution of predominant C3 diet for C4 in quails, obtained blood carbon half-life
of 11.4 days. These half-life values were expected to be similar to those found in the RC3 treatment. Feed
intake results of these treatments presented similar values. Tryptophan balance was probably less harmful to these birds as compared to the diet including only methionine and lysine requirement levels were corrected. However, RC4 diet tryptophan levels were
below (calculated tryptophan level was 0.08%) the nutritional requirement, which is 0.18% for layer in this stage (Rostagno et al., 2000).
Table 3 – Feed intake, in g/bird/day, at the end of the pre-experimental period (22-28 days), beginning (29-35 days) and end of the experimental period (78-84 days).
Days Treatments
RC4 RC3 RMC4 RMC3
22-28 97.26abA 93.81bC 100.83a 84.01cC
29-35 84.23cB 141.67aA 105.61b 142.69aA
78-84 81.63bB 112.24aB 112.24a 109.78aB
carbon-13 isotopic ratio from the previous feed. Albumen deposition around the yolk takes about three hours in the magnum, where proteins are synthesized from amino acids directly derived from blood plasma (Hobson, 1995). This explains the lower half-life of the albumen.
Blood and albumen showed to be strongly influenced by diet composition as compared to egg and yolk. This is why RC4 treatment turnover was slower
than the other treatments. The possible explanation is that, since blood transports nutrients, there was intense mobilization of reserves in layers in this treatment to try to maintain egg production. As albumen synthesis is directly dependent from plasma, this reflects the blood turnover.
Moreover, blood turnover is slower than the turnover of the egg and its fractions. A possible explanation is the blood consists of a cellular fraction and plasma, and the cellular fraction takes longer to exchange existing carbon as compared to plasma. This reflects nutrient transit in the body (Hobson and Clark, 1993), which is similar to what occurs during the formation of the egg and its fractions.
CONCLUSION
The RMC3 diet was better because it promoted
better productive performance (high feed intake and high egg production), faster carbon substitution rate than the unbalanced diet (exclusively C4), and shorter
half-life of egg (yolk + albumen), yolk, and albumen. Turnover is influenced by the quality of the diet fed to the birds. In addition, diet composition has less influence on egg and yolk turnover, as compared to blood and albumen. Carbon substitution rate is faster for egg and its components (yolk and albumen) than for blood.
REFERENCES
Balog JM, Millar RI. Influence of the sence of taste on broiler chick feed comsumption. Poultry Science 1989; 68:123-140.
Boorman KN. Regulation of protein and amino acid intake. In: Boorman KN; Freeman BM, editor. Food intake regulation in poultry. Edinburg: British Poultry Science; 1979. p.87-126.
Carrijo AS, Pezzato AC, Ducatti C. Avaliação do metabolismo nutricional em poedeiras pela técnica dos isótopos estáveis do carbono (13C/12C). Revista Brasileira Ciência Avícola 2000;
2:209-218.
Ducatti C. Isótopos estáveis ambientais [apostila]. Botucatu (SP): Universidade Estadual Paulista; 2004. 138p.
Ducatti C, Carrijo AS, Pezzato AC, Mancera PFA. Modelo teórico e experimental da reciclagem do carbono-13 em tecidos de mamíferos e aves. Scientia Agrícola 2002; 59:29-33.
Gannes LZ, Rio CM, Koch P. Natural abundance variations in stable isotopes and their potential uses in animal physiological ecology. Comparative Biochemistry Physiology 1998; 119A:725-737.
Gonzales E. Ingestão de alimentos: Mecanismos regulatórias. In: Macari M; Furlan R L; Gonzales E. Fisiologia aviária aplicada a frangos de corte. 2ed. Jaboticabal: FUNEP-UNESP; 2002. p.187-199.
Hobson KA. Reconstructing avian using stable-carbon and nitrogen isotope analysis of egg components: patterns of isotopic fraction and turnover. Condor 1995; 97:752-762.
Hobson KA, Clark RG. Assessing avian diets using stable isotopes I: Turnover of 13C in tissues. Condor 1992a; 94:181-188.
Hobson KA, Clark RG. Assessing avian diets using stable isotopes II: Factors influencing diet-tissue fractionation. Condor 1992b; 94:189-197.
Hobson KA, Clark RG. Turnover of 13
C in cellular and plasma fractions of blood: implications for nondestructive sampling in avian dietary studies. The Auk 1993; 110: 638-641.
Kennedy BV, Krouse HR. Isotope fractionation by plants and animals: implications for nutrition research. Canadian Journal Physiology and Pharmacology 1990; 68:960-972.
Mizutani H, Kubaya Y, Wada E. Nitrogen and carbon isotope composition relates linearly in cormorants tissues and its diets. Isotopenpraxis 1991; 4:166-168.
Rostagno HS, Albino LFT, Donzele JL, Gomes PC, Ferreira AS, Oliveira RF, Lopes DC. Tabelas brasileiras para aves e suínos: composição de alimentos e exigências nutricionais. Viçosa: UFV; 2000.141p.
Tieszen LL, Boutton TW, Tesdahl KG, Slade NA. Fractionation and turnover of stable carbon isotopes in animal tissues: Implications for δ13C analysis of diet
. Oecologia 1983; 57:32-37.
SAS Institute. SAS/STATTM