www.biogeosciences.net/10/3525/2013/ doi:10.5194/bg-10-3525-2013
© Author(s) 2013. CC Attribution 3.0 License.
Biogeosciences
Geoscientiic
Geoscientiic
Geoscientiic
Geoscientiic
Concentration and vertical flux of Fukushima-derived radiocesium
in sinking particles from two sites in the Northwestern Pacific Ocean
M. C. Honda1, H. Kawakami2, S. Watanabe2, and T. Saino1
1Research Institute for Global Change, Japan Agency for Marine-Earth Science and Technology, 2–15 Natsushima,
Yokosuka, Kanagawa 237-0061, Japan
2Mutsu Institute for Oceanography, Japan Agency for Marine-Earth Science and Technology, 690 Aza-kitasekine,
Oaza-sekine, Mutsu, Aomori 035-0022, Japan
Correspondence to:M. C. Honda (hondam@jamstec.go.jp)
Received: 26 December 2012 – Published in Biogeosciences Discuss.: 11 February 2013 Revised: 30 April 2013 – Accepted: 7 May 2013 – Published: 3 June 2013
Abstract.At two stations in the western North Pacific, K2 in the subarctic gyre and S1 in the subtropical gyre, time-series sediment traps were collecting sinking particles when the Fukushima Daiichi Nuclear Power Plant (FNPP1) acci-dent occurred on 11 March 2011. Radiocesium (134Cs and
137Cs) derived from the FNPP1 accident was detected in
sinking particles collected at 500 m in late March 2011 and at 4810 m in early April 2011 at both stations. The sink-ing velocity of 134Cs and 137Cs was estimated to be 22 to 71 m day−1 between the surface and 500 m and>180 m
day−1between 500 m and 4810 m.137Cs concentrations
var-ied from 0.14 to 0.25 Bq g−1 dry weight. These values are
higher than those of surface seawater, suspended particles, and zooplankton collected in April 2011. Although the ra-diocesium may have been adsorbed onto or incorporated into clay minerals, correlations between134Cs and lithogenic ma-terial were not always significant; therefore, the form of the cesium associated with the sinking particles is still an open question. The total137Cs inventory by late June at K2 and by late July at S1 was 0.5 to 1.7 Bq m−2 at both depths. Com-pared with137Cs input from both stations by April 2011, esti-mated from the surface137Cs concentration and mixed-layer depth and by assuming that the observed137Cs flux was con-stant throughout the year, the estimated removal rate of137Cs from the upper layer (residence time in the upper layer) was 0.3 to 1.5 % yr−1(68 to 312 yr). The estimated removal rates
and residence times are comparable to previously reported values after the Chernobyl accident (removal rate: 0.2–1 %, residence time: 130–390 yr).
1 Introduction
On 11 March 2011, the 2011 Tohoku-Oki Earthquake of magnitude 9.0 occurred off Miyagi Prefecture, Japan. This earthquake and the tsunami it generated seriously damaged the Fukushima Daiichi Nuclear Power Plant (FNPP1). As a result of the loss of power and the associated malfunc-tion of the cooling system, large quantities of artificial ra-dionuclides were emitted from FNPP1 by hydrogen explo-sions, venting, and intentional and accidental discharge of contaminated water. However, the exact amount of radionu-clides emitted from FNPP1 are still being argued: regard-ing eolian/atmospheric input, the estimates of 137Cs emis-sion range from about 5 to 35 PBq (e.g. 20–53 with aver-age of 37 PBq, Stohl et al., 2011; 5.5–9.7 PBq, Miyazawa et al., 2013), and, regarding direct discharge to the ocean, estimates of137Cs discharge range from about 3 to 40 PBq (e.g. 12–24 with average of 27 PBq, Bailly du Bois, 2012; 3.5±0.7 PBq, Tsumune et al., 2012; 11–16 PBq, Charette et
Direct discharge of Cs in contaminated water was esti-mated to be 3.5–5.9 PBq (Kawamura et al., 2011; Tsumune et al., 2011; Miyazawa et al., 2012). In addition, eolian input of137Cs was estimated to be 5 to 10 PBq (Kawamura et al., 2011; Miyazawa et al., 2012; Aoyama et al., 2012). About one month after the FNPP1 accident, Honda et al. (2012) in-vestigated the dispersion of FNPP1-derived radiocesium in the western North Pacific. They measured radiocesium in surface water, suspended particles, and zooplankton and per-formed a mathematical simulation that verified that FNPP1-derived radiocesium had dispersed over a broad area of the western North Pacific. They suspected that radiocesium de-tected in remote parts of the North Pacific had been trans-ported via the atmosphere and was not derived from the released contaminated water. Since then the dispersion of FNPP1-derived radionuclides has been investigated over an even broader area by voluntary observing ships and scientific cruises (Aoyama et al., 2012; Buesseler et al., 2012) and by mathematical simulations (Masumoto et al., 2012; Miyazawa et al., 2012). Nevertheless, the vertical invasion and trans-port of radionuclides in the ocean is still insufficiently un-derstood. Radionuclides invade the ocean interior by verti-cal diffusion and advection or on sinking particles. After the CNPP accident, radionuclides on sinking particles were col-lected by sediment traps in the Black Sea (Buesseler et al. 1987, 1990), North Sea (Kempe and Nies, 1987), Mediter-ranean Sea (Fowler et al., 1987), and North Pacific (Kusak-abe et al., 1988), and the arrival dates of the CNPP-derived radionuclides at the different stations as well as the sinking velocity and removal rate of the particles were determined.
At the time of the FNPP1 accident, sediment traps had already been deployed at time-series stations in the north-western North Pacific to collect sinking particles for stud-ies of biogeochemical cycling and how it would be affected by climate and oceanic change (project http://www.jamstec. go.jp/rigc/e/ebcrp/mbcrt/index.html). Here, we document the concentration and flux of FNPP1-derived radiocesium,134Cs (half life, 2.06 yr) and 137Cs (half life, 30.17 yr), in sink-ing particles collected at these stations before and after the FNPP1 accident. Then, we estimate the sinking velocity of the particles and discuss the form and particle scavenging process of the radiocesium.
2 Method
2.1 Sediment trap positions
In November 2010, time-series sediment traps (McLane Mark7G-21) were deployed at 500 m and 4810 m at sta-tions K2 (47◦N, 160◦E; water depth,∼5200 m), which is
in the subarctic gyre, and S1 (30◦N, 145◦E; water depth,
∼5800 m), which is in the subtropical gyre (Fig. 1). The
horizontal distances from FNPP1 to K2 and S1 are about
S1!
K2!
Fukushima! NPP!
137Cs!
(Bq kg-1)!
0.4!
0.3!
0.2! 0.5!
0.0! 0.1!
Fig. 1.Sediment trap location. Background is horizontal distribu-tion of137Cs concentration in surface seawater along R/VMirai
MR11-02 cruise track in April 2011 (Honda et al., 2012).
1870 km and 950 km, respectively. Before the traps were de-ployed, their collecting cups were filled with a seawater-based 10 % buffered formalin solution as a preservative. The sampling interval was 12 days. The sediment traps at K2 and S1 were recovered in June and July 2011, respectively, by R/VMirai.
2.2 Chemical analysis
In the laboratory, sediment trap samples were sieved through a 1 mm plastic mesh to eliminate zooplankton “swimmers” larger than 1 mm. The samples were then divided into 10 or more fractions by using a McLane splitter. Some frac-tions were filtered, rinsing with a small amount of dis-tilled water, through pre-weighed Nuclepore filters (0.4 µm pore size). If swimmers were found in sample after filtra-tion, these were removed by a tweezers. Thereafter sam-ples were dried at 50◦C for 24 h. The dried samples were then weighed and total mass fluxes were computed. Subse-quently, the samples were scraped off the filters and pulver-ized with an agate mortar.
For measurement of the total carbon concentration (TC), samples of about 5 mg were precisely weighed in a tin cap-sule. Samples for the measurement of organic carbon (OC) were precisely weighed on GF/F filters, and then the GF/F filters with sample were placed in a container filled with HCl mist for 24 h to eliminate CaCO3. After decalcification, the
(a)
(d)
(c)
(b)
* *
* *
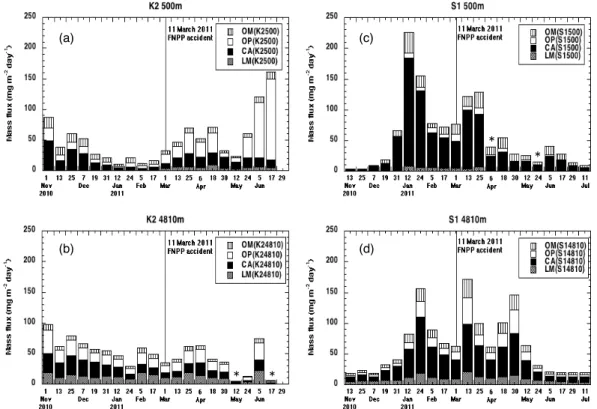
Fig. 2.Seasonal variability of sinking particles at(a)K2-500 m,(b)K2-4810 m,(c)S1-500 m and(d)S1-4810 m. Chemical compositions of OM, OP, CA and LM express organic materials, biogenic opal, CaCO3and lithogenic materials, respectively. Date is opening day of respective collecting cups. Radiocesium was measured on sinking particle samples collected after 1 March 2011. From samples with asterisk, radiocesium derived from the FNPP1 accident was not detected because of insufficient sample mass.
For measurement of trace elements, samples of about 20 mg were precisely weighed in a graphite crucible. About 140 mg of lithium metaborate (LiBO4)(approximately seven times
the sample mass) was then added and mixed well with the sample. Samples in graphite crucibles were placed in a fur-nace and maintained for 15 min at 950◦C. The resulting
“lava-like” samples were placed in a Teflon beaker with 6 % nitric acid solution (HNO3, ∼20 mL) and stirred for 1 h.
This solution was filtered through a GF/F filter to elimi-nate graphite debris, its volume was adjusted to 50 ml by adding 6 % HNO3 solution, and then it was weighed
pre-cisely. Concentrations of trace elements (Si, Ca, Fe, Ti, Mn, Mg, Ba, K) were measured by ICP-AES (Perkin-Elmer Op-tima 3300DV). Measurement errors were less than 5 % for every element. Concentrations of organic materials (OM), CaCO3, biogenic opal and lithogenic material (LM) were
calculated following Honda et al. (2002).
Radionuclide activities of 134Cs and 137Cs (hereinafter
concentrations) were measured in samples collected after 1 March 2012. A plastic tube was filled with dried and pul-verized samples, and the specific gamma rays emitted by
134Cs and137Cs were measured by gamma spectrometry with
a well-type Ge detector (ORTEC GWL-120210). The Ge de-tector was calibrated by using mixed-volume sources (Eckert & Ziegler Isotope Products, EG-ML). The counting time
var-ied from one day to a few days. The134Cs activity was cor-rected for cascade summing (43–49 %). The detection limit was 10 mBq per sample. Concentrations of radiocesium were decay-corrected to the date and time of the middle day of the sampling period. The precision of134Cs and137Cs measure-ments was one sigma of the counting error.
3 Results
3.1 Seasonal variability of the flux and chemical composition of sinking particles
3.1.1 K2
The total mass flux (TMF) of sinking particles at 500 m at K2 (K2-500 m) decreased from November 2010 to Febru-ary 2011 (Fig. 2a). After the FNPP1 accident in March 2011, TMF increased and, although it dipped in early May, the highest value was reached in June. Between November and February, CaCO3was the dominant component of the
sam-ples, whereas biogenic opal was dominant after March. Dur-ing the entire observation period, biogenic opal and CaCO3
(a)
(d)
(c)
(b)
Fig. 3.Variability of134Cs concentration (line graph) and134Cs flux at(a)K2-500 m,(b)K2-4810 m,(c)S1-500 m and(d)S1-4810 m. B.D.L. is below detection limit. B.D.L. in parenthesis is supposed to be below detection limit likely caused by insufficient sample mass and radiocesium for gamma ray analysis.
from November 2010 and mainly increased, with low values in May, from March to June 2011 (Fig. 2b). The LM concen-tration was relatively higher at 4810 m (24 %) than at 500 m (6 %). We attribute this result to LM being more refractory than biogenic materials. Biogenic opal accounted for about 33 % of each sample, and was also dominant in the annual average. Therefore, the sediment trap samples form K2 used for the radiocesium analysis in this study consisted of sinking particles, of which biogenic opal was the major component, and the TMF tended to increase from March toward early summer.
3.1.2 S1
The smallest TMF was observed at S1-500 m at the time that the sediment trap was deployed in November 2010 (Fig. 2c). It began to increase in late December 2010 and reached a maximum in January 2011, after which it decreased be-fore rising again in March 2011. Thereafter, TMF tended to decrease toward July 2011. The CaCO3 concentration was
about 80 % on average, and CaCO3 was the major
compo-nent of sinking particles. At S1-4810 m, TMF also increased from late December 2010 to January 2011 (Fig. 2d), and TMF peaks were observed in March and late April 2011. In general, the seasonal variability at 4810 m was similar to that at 500 m. Although concentrations of biogenic opal and LM
in the samples were higher at 4810 m than at 500 m, CaCO3
was still the dominant component at 4810 m. Therefore, sam-ples for radiocesium analysis from S1 consisted of sinking particles whose major component was CaCO3, and the TMF
tended to gradually decrease from March toward June.
3.2 Concentrations and flux of radiocesium
The concentrations and fluxes of134Cs and137Cs are listed in Table 1 and shown against time in Fig. 3.134Cs was detected in almost all samples, whereas before the FNPP1 accident,
134Cs concentration was zero worldwide (e.g., Aoyama and
Hirose, 2004). In addition, in all samples the activity ratio of
134Cs to137Cs (134Cs/137Cs) was about one, which was the
ratio in the radionuclides released by the FNPP1 accident, as verified by radiocesium analysis of seawater (Buesseler et al., 2011, 2012), aerosols (Haba et al., 2012) and soil (Qin et al., 2012). Thus, there is no doubt that the radiocesium detected in the sinking particles was derived from the FNPP1 accident.
3.2.1 K2
Table 1.Concentrations and fluxes of radiocesium at K2. The analytical error is based on one sigma of counting statistics. Concentrations are decay-corrected based on middle day of each sampling period. B.D.L. is below detection limit (0.01 Bq). (B.D.L.) is supposed to be below detection limit because of insufficient sample mass and activity by gamma procedures.
Station Opening 134Cs concentration 137Cs concentration 134Cs/137Cs TMF 134Cs Flux 137Cs Flux
Depth Day (Bq g−1) (Bq g−1) (mg m−2day−1) (mBq m−2day−1) (mBq m−2day−1)
K2 1-Mar B.D.L. B.D.L. – 35.0 – –
500 m 13-Mar B.D.L. B.D.L. – 51.2 – –
25-Mar 0.48±0.03 0.41±0.01 1.16±0.07 75.4 36.2±2.1 31.1±0.6
6-Apr 0.37±0.04 0.35±0.01 1.06±0.13 55.9 20.9±2.4 19.8±0.8
18-Apr 0.40±0.05 0.34±0.02 1.16±0.15 80.0 31.9±3.8 27.5±1.5
30-Apr 0.16±0.05 0.16±0.02 1.00±0.33 33.6 5.3±1.7 5.4±0.6
12-May 0.21±0.06 0.19±0.02 1.11±0.36 23.9 4.9±1.5 4.4±0.6
24-May 0.20±0.05 0.20±0.02 0.98±0.24 61.5 12.4±2.9 12.6±1.0
5-Jun 0.19±0.02 0.19±0.01 1.00±0.14 125.6 24.3±3.1 24.3±1.2
17-Jun 0.13±0.02 0.12±0.01 1.07±0.22 166.9 20.9±4.1 19.6±1.4
K2 1-Mar B.D.L. B.D.L. – 37.5 – –
4810 m 13-Mar B.D.L. B.D.L. – 43.2 – –
25-Mar B.D.L. B.D.L. – 66.4 – –
6-Apr 0.09±0.03 0.07±0.01 1.16±0.49 69.6 6.1±2.3 5.2±0.9
18-Apr 0.11±0.04 0.11±0.01 0.97±0.35 43.3 4.7±1.6 4.9±0.6
30-Apr 0.16±0.06 0.17±0.02 0.94±0.39 39.9 6.3±2.5 6.6±0.9
12-May (B.D.L.) (B.D.L.) – 5.0 – –
24-May 0.34±0.11 0.33±0.04 1.01±0.37 13.3 4.5±1.5 4.4±0.6
5-Jun 0.24±0.04 0.22±0.02 1.10±0.21 79.3 18.8±3.1 17.1±1.5
17-Jun (B.D.L.) (B.D.L.) – 5.8 – –
all sediment trap samples analyzed in this study. Sub-sequently, 134Cs concentration tended to decrease gradu-ally. The largest 134Cs flux was also observed between 25 March and 6 April (36.2 mBq m−2day−1), and it also tended to decrease thereafter.
At K2-4810 m,134Cs was initially detected in sinking par-ticles collected during the next sampling interval, between 6 and 18 April, 12 days after it was first detected at K2-500 m (Fig. 3b). Unlike at K2-K2-500 m, at K2-4810 m 134Cs concentration increased over time, and it reached its largest value of 0.35 Bq g−1between 24 May and 6 June 2011. No
134Cs was detected in sinking particles collected between 12
and 24 May or between 17 and 29 June, probably because the sample mass was insufficient for detection by the gamma procedure rather than because the sinking particles contained no FNPP1-derived134Cs. At K2-4810 m, the134Cs flux was largest (20.9 mBq m−2day−1)between 5 and 17 June.
The average 134Cs concentration at 500 m and K2-4810 m during the observation period (500 m, 96 days; 4810 m, 60 days) was 0.27 and 0.19 Bq g−1, respectively. The total 134Cs inventory was 1.9 Bq m−2 at 500 m and 0.5 Bq m−2at 4810 m (Table 2).
3.2.2 S1
At S1-500 m,134Cs was first detected in sinking particles col-lected between 25 March and 6 April, that is, the same period that they were first detected at K2-500 m (Fig. 3c). In gen-eral,134Cs concentration tended to increase with time at S1-500 m, and it reached a maximum (∼0.3 Bq g−1)in sinking
particles collected between 17 and 29 June. As at K2-4810 m, and probably for the same reason, no134Cs was detected in sinking particle samples collected at S1-500 m between 6 and 18 April and between 24 May and 6 June. The134Cs flux was relatively higher in late April and June, and variations of the flux and the activity were generally synchronous. The total
134Cs inventory and average134Cs activity during the
obser-vation period (96 days) were estimated to be 0.5 Bq m−2and
0.16 Bq g−1, respectively (Table 2).
At S1-4810 m134Cs was initially detected in sinking par-ticles collected between 6 and 18 April (Fig. 3d), the same period that134Cs was first detected at K2-4810 m (Fig. 3b).
134Cs concentration increased toward late April and early
May, and thereafter it fluctuated around a relatively constant value. A maximum134Cs concentration of 0.25 Bq g−1was detected in the sample collected between 17 and 29 June. The peak134Cs flux occurred between 30 April and 12 May, af-ter which it decreased. The total134Cs flux and the average
134Cs activity at S1-4810 m were estimated to be 1.0 Bq m−2
and 0.17 Bq g−1, respectively (Table 2).
decay-corrected based on the middle day of each sampling period. B.D.L. is below detection limit (0.01 Bq). (B.D.L.) is supposed to be below detection limit because of insufficient sample mass and activity by gamma procedures.
Station Opening 134Cs concentration 137Cs concentration 134Cs/137Cs TMF 134Cs Flux 137Cs Flux
Depth Day (Bq g−1) (Bq g−1) (mg m−2day−1) (mBq m−2day−1) (mBq m−2day−1)
S1 1-Mar B.D.L. B.D.L. – 77.9 – –
500 m 13-Mar B.D.L. B.D.L. – 127.4 – –
25-Mar 0.03±0.01 0.03±0.00 1.24±0.44 126.3 4.4±1.5 3.5±0.5
6-Apr (B.D.L.) (B.D.L.) – 37.2 – –
18-Apr 0.16±0.03 0.16±0.01 0.98±0.20 52.3 8.3±1.6 8.5±0.6
30-Apr 0.12±0.05 0.11±0.03 1.16±0.57 24.9 3.1±1.3 2.6±0.6
12-May 0.11±0.05 0.10±0.02 1.06±0.53 26.1 2.8±1.3 2.7±0.5
24-May (B.D.L.) (B.D.L.) – 16.6 – –
5-Jun 0.22±0.06 0.23±0.02 0.95±0.27 40.5 8.9±2.3 9.3±0.9
17-Jun 0.28±0.05 0.21±0.02 1.36±0.27 27.6 7.8±1.4 5.7±0.5
29-Jun 0.22±0.08 0.20±0.03 1.10±0.43 14.6 3.2±1.2 2.9±0.4
11-Jul 0.17±0.06 0.18±0.03 0.92±0.38 15.1 2.5±1.0 2.7±0.4
S1 1-Mar B.D.L. B.D.L. – 63.0 – –
4810 m 13-Mar B.D.L. B.D.L. – 170.4 – –
25-Mar B.D.L. B.D.L. – 98.2 – –
6-Apr 0.09±0.04 0.07±0.01 1.31±0.57 63.8 6.0±2.3 4.5±0.9
18-Apr 0.16±0.03 0.13±0.01 1.25±0.25 100.0 15.7±2.9 12.6±1.2
30-Apr 0.22±0.03 0.19±0.01 1.20±0.18 147.0 32.9±4.4 27.3±1.7
12-May 0.19±0.05 0.18±0.02 1.04±0.26 64.6 12.3±2.9 11.9±1.1
24-May 0.14±0.07 0.13±0.03 1.08±0.53 31.9 4.6±2.1 4.3±0.8
5-Jun 0.17±0.05 0.12±0.02 1.37±0.50 21.7 3.6±1.2 2.6±0.5
17-Jun 0.24±0.07 0.18±0.03 1.33±0.42 19.2 4.6±1.3 3.4±0.5
29-Jun 0.13±0.06 0.11±0.02 1.19±0.63 20.8 2.7±1.3 2.3±0.4
11-Jul 0.19±0.09 0.16±0.04 1.16±0.66 20.9 3.9±2.0 3.3±0.9
4 Discussions
4.1 Sinking velocity
Although the distance to K2 from FNPP1 is double that to S1, it is noteworthy that at each respective depth FNPP1-derived radiocesium in sinking particles was first detected at both stations in the same period: at 500 m in samples collected between 25 March and 6 April, and at 4810 m in samples collected between 6 and 18 April. We estimated the sink-ing velocity of radiocesium between 500 m and 4810 m to be greater than∼180 m day−1[(4810–500)/(12+12)]. This
velocity is comparable to that estimated for sediment trap radionuclide data from the CNPP accident (∼190 m day−1:
Kusakabe et al., 1988) and for general deep-sea sediment trap data (∼140 m day−1, Honda et al., 2009; 100–300 m day−1,
Berelson, 2002).
The results of a mathematical simulation of the transport of contaminated eolian dust containing radiocesium (Honda et al., 2012) suggest that eolian radiocesium arrived and was deposited at K2 on 14 March and at S1 on 18 March 2011. Under the assumption that the eolian radiocesium arrived at 500 m between 25 March and 6 April, we estimated the sink-ing velocity between 0 (surface) and 500 m as 22 to 46 m day−1at K2 and 26 to 71 m day−1at S1. Although these val-ues are smaller than the estimated general deep-sea sinking
velocity of∼140 m day−1, these low velocities at shallow
depth are comparable to the estimated radionuclide flux at shallow depth associated with the CNPP accident (>20 m day−1in the upper 1000 m of the Black Sea, Buesseler et al., 1987; 29 m day−1in the upper 200 m of the Mediterranean Sea, Fowler et al., 1987; 65±22 m day−1in the upper 222 m
of the North Sea, Kempe and Nies, 1987). This increase in the sinking velocity with depth is also supported by previ-ous work (Berelson, 2002; Honda et al., 2009). This increase might be partly attributed to the increase in density of set-tling particle because “light” and fragile organic material de-creases with depth compared to “heavy” and relatively re-fractory opal, CaCO3and lithogenic material.
At K2-500 m, the sinking particles collected between 25 March and 18 April were composed of biogenic opal (∼46 %) and CaCO3 (∼32 %), whereas at S1-500 m, they
consisted of∼9 % biogenic opal and∼72 % CaCO3. Thus,
Table 3.Total radiocesium flux, average radiocesium concentration, suspected137Cs inventory (see text), and removal rate of137Cs from and residence time of137Cs at surface water.
134Cs 134Cs 134Cs 134Cs Sampling 137Cs Flux 137Cs Removal Residence
concentration concentration Inventory Inventory period (mBq m−2day−1) inventory rate time
(Bq g−1) (Bq g−1) (Bq m−2) (Bq m−2) (day) (Bq m−2) (% yr−1) (yr)
K2 500 0.27±0.13 0.25±0.11 1.9 1.7 96 18.1 450 1.5 68
K2 4810 0.19±0.10 0.18±0.10 0.5 0.5 60 7.6 450 0.6 161
S1 500 0.16±0.08 0.15±0.07 0.5 0.5 96 4.7 540 0.3 312
S1 4810 0.17±0.05 0.14±0.04 1.0 0.9 108 8.0 540 0.5 184
4.2 Comparisons with radiocesium activities of sinking particles from the CNPP accident and those of seawater, suspended substances, and zooplankton
The137Cs concentration of sinking particles observed in this study ranged from 0.03 to 0.41 Bq g−1(30–410 Bq kg−1;
Ta-ble 1). We estimated the average137Cs concentration to be 0.18 to 0.25 Bq g−1 (180–250 Bq kg−1) at K2 and 0.14 to 0.15 Bq kg−1(140–150 Bq kg−1)at S1 (Table 2). Compared with the137Cs concentrations resulting from the FNPP1 ac-cident observed in this study, the 137Cs concentrations of sinking particles observed just after the CNPP accident were higher (Black Sea, 0.5 and 1.9 Bq g−1, Buesseler et al., 1987; Mediterranean Sea, 0.15–4.0 Bq g−1, Fowler et al., 1987; North Sea, 1.6–13.6 Bq g−1, Kempe and Nies, 1987). Despite distances from the CNPP to respective sediment trap stations (about 580 km for the Black Sea, 1950 km for the Mediter-ranean Sea and 1880 km for the North Sea) compared to dis-tances from the FNPP1 to S1 (950 km) and K2 (1870 km), concentrations observed after the CNPP accident were much higher than that after the FNPP1 accident this study. This might be mainly attributable to the fact that the amount of
137Cs emitted during the CNPP accident was about six times
the amount emitted during the FNPP1 accident.
In addition, as a result of wind direction and dry/wet deposition, the higher concentrations after the CNPP acci-dent might be attributed to higher fallout of radionuclides to observation areas and subsequent elevated concentration in the water.
After the CNPP accident, the observed137Cs concentra-tions of surface seawater (Black Sea, 0.04–0.19 Bq kg−1, Buesseler et al., 1987; North Sea, 0.07–0.3 Bq kg−1, Kempe and Nies, 1987) were also higher than activities of sur-face seawater observed in April 2011 at K2 and S1 (0.009 and 0.018 Bq kg−1, respectively), after the FNPP1 accident
(Honda et al., 2012).
On the other hand,137Cs concentrations observed in sed-iment trap samples from the northern North Pacific and the Bering Sea after the CNPP accident (0.01–0.027 Bq g−1 in the North Pacific and 0.07–0.25 Bq g−1 in the Bering Sea, Kusakabe et al., 1987) were comparable to or smaller than those observed after the FNPP1 accident. These similar ac-tivities presumably reflect the fact that the distance between
the CNPP and the North Pacific and Bering Sea sediment trap stations is about 8500 km, so the amount of137Cs transported from the CNPP to these areas was small.
In contrast to the relatively low 137Cs concentrations of surface seawater at K2 and S1 in April 2011, about one month after the FNPP1 accident (Honda et al., 2012),137Cs concentrations of suspended particles in April 2011 at both stations were quite high, ranging from 3 to 32 Bq kg−1, and concentrations of zooplankton collected at the same time ranged from 13 to 71 Bq kg−1 dry weight, slightly higher
than those of suspended particles (Honda et al., 2012). These
137Cs concentrations of zooplankton are comparable to both
those of zooplankton observed after the CNPP accident in the Mediterranean Sea (Fowler et al., 1987) and those observed in the western North Pacific after the FNPP1 accident (Bues-seler et al., 2012). However,137Cs activities of sinking parti-cles in this study (140–250 Bq kg−1on average) were several times higher than those of zooplankton. In steady state, the distribution coefficient (Kds) of Cs of sediment or lithogenic
materials is much higher than the concentration factor (CF) of creature (IAEA, 2004). Although the observation periods were not steady state, and only transient137Cs concentrations of the various materials were measured, it is suspected that radiocesium in sinking particles was mainly associated with lithogenic materials.
4.3 Form of the radiocesium associated with sinking particles
Cesium, including radiocesium, is an alkaline metal that is regarded as soluble in water. The Chernobyl fallout was rapidly (within days) solubilized in seawater (Whitehead et al., 1988). However, a part of the cesium can be ad-sorbed onto or incorporated into aluminosilicates (clay min-erals), similar to potassium (Qin et al., 2012, and references therein), and the adsorption or incorporation of cesium is not easily reversed (e.g., Kogure et al., 2012; Otosaka and Kobayashi, 2012). To determine the form of the radiocesium associated with sinking particles, we computed correlations between the concentration and flux of radiocesium with those of organic carbon, biogenic opal, CaCO3, lithogenic
not always significant: correlation coefficients (r ) between fluxes of Cs and LM (potassium) for respective depths of sta-tions were 0.42 (0.37) on average. A possible reason for the failure to find a significant correlation is that the radioce-sium concentrations and fluxes were transient values; con-sequently, the magnitude of radiocesium adsorption or in-corporation might not be constant. Although it is suspected that radiocesium in sinking particles was mainly associated with lithogenic materials as described before, another possi-ble reason is that the cesium was partly assimilated by living organisms (e.g. Kasamatsu and Ishikawa, 1997). Fowler et al. (1987) also reported that137Cs can become concentrated in fecal pellets. Moreover, Kaneyasu et al. (2012) reported that sulfate aerosol is a potential transport medium of radio-cesium rather than lithogenic materials. In this case, sulfate Cs is easily dissolved in surface and then might be absorbed by creature. Any of these circumstances could cause the cor-relation between radiocesium and potassium or LM to not be significant. Thus, the form of the radiocesium associated with sinking particles is still an open question. Precise mea-surements of stable Cs (133Cs), electron microscopic analy-ses, and characterization/extraction experiments are needed to resolve this question.
5 Removal rate and residence time
In April 2011, 137Cs concentration of surface water was 0.009 Bq kg−1at K2 and 0.018 Bq kg−1at S1 (Honda et al.,
2012), but Honda et al. (2012) did not detect radiocesium from FNPP1 in subsurface water (200 m). In April 2011, the surface mixed layer thickness (SML) was 100 m at K2 and 60 m at S1. If it can be assumed that 137Cs decreased lin-early from the surface to the bottom of the SML, the137Cs inventory in April 2011 can be estimated as 450 Bq m−2at K2 and 540 Bq m−2at S1 (Table 2). The average137Cs flux (137Cs inventory/the observation period) to the ocean inte-rior ranged from 7.6 to 18.1 mBq m−2day−1at K2 and from 4.7 to 8.0 mBq m−2day−1at S1 (Table 2). After this study,
137Cs flux might decrease with time. However concentration
of137Cs at K2-4810 m, S1-500 m and S1-4810 m did not be-gin to decrease. In addition, it is suspected that total mass flux at K2 might increase in summer. If these137Cs fluxes re-mained constant for a year, the removal rate at K2 can be es-timated as 0.62 % yr−1to 1.47 % yr−1and the residence time
as 68 to 161 years, whereas the estimated removal rate at S1 is 0.32 % yr−1to 0.54 % yr−1and the estimated residence
time is 184 to 312 years. From sediment trap and seawater
137Cs data collected in the Black Sea in the several months
following the CNPP accident, Buesseler et al. (1987) esti-mated a removal rate and residence time of radiocesium of 0.77 % yr−1and 130 yr, respectively. Kusakabe et al. (1988) reported removal rates of 1 % in the North Pacific and Bering Sea for radiocesium from the CNPP accident, and Fowler et
ranean Sea. All of these removal rate estimates for radioce-sium from the CNPP accident are comparable to our esti-mates for radiocesium from the FNPP1 accident. However, the 137Cs concentration and flux might change with time, which might alter estimates of the removal rate and resi-dence time. For example, using sediment trap data from an entire year, Buesseler et al. (1990) estimated a longer resi-dence time (230–390 yr) in the Black Sea. Resiresi-dence time estimated this study (68–312 yr) might be an underestimate.
6 Concluding remarks and future work
Sediment trap data revealed that FNPP1-derived radiocesium was quickly transported to the deep sea in the western North Pacific. Estimates of the removal rate and residence time were comparable to previous estimates for CNPP-derived ra-diocesium. Moreover, data from sinking particles collected at K2 and S1 after the end of the observation period of this study confirm the increasing trend of TMF at K2 and the decreasing trend at S1 (Honda et al., in preparation). In ad-dition, except at K2-500 m, 134Cs concentration of sinking particles is continuing to increase with time. These new data will reveal more details about the radiocesium flux associ-ated with sinking particles. We also collected seafloor sedi-ments at K2 and S1 in June/July 2011. The removal rate of radiocesium from the water column to the seafloor sediment and, conversely, its remobilization from sediments are also of considerable interest (e.g. Otosaka and Kobayashi, 2012). In addition, in July 2011 we deployed time-series sediment traps about 90 km off Fukushima, and data from these sedi-ment traps will reveal not only the vertical transport of radio-cesium to the ocean interior but also its lateral transport from the land or from shallower seafloor sediments.
Acknowledgements. We thank our scientific colleagues from our
institution, Marine Works Japan, ltd., and Global Ocean Develop-ment Incorporation for their cooperation in sample collection and analysis. Constructive comments from two anonymous reviewers and Ken Buesseler were helpful in improving contents of our manuscript. This research was funded in part by the international collaborative research program (J-RAPID), the Japan Science and Technology (JST), and a MEXT Kakenhi Grant in Aid for Scientific Research on Innovative Areas. This research is an activity of the Great East Japan Earthquake Working Group organized by the Oceanographic Society of Japan.
References
Aoyama, M. and Hirose, K.: Artificial radionuclides database in the Pacific Ocean: HAM database, The Scientific World Journal, 4, 200–215, 2004.
Aoyama, M., Tsumune, D., and Hamajima, Y.: Distribution of 137Cs and 134Cs in the North Pacific Ocean: impacts of the
TEPCO Fukushima-Daiichi NPP accident, J. Radioanal. Nucl. Chem., 296, 535–539, doi:10.1007/s10967-012-2033-2, 2012. Bailly du Bois, P., Laguionie, P., Boust, D., Korsakissok, I., and
Di-dier, D: Estimation of marine source-term following Fukushima Dai-ichi accident, J. Environ. Radioactiv., 114, 2–9, 2012. Berelson, W. L.: Particle settling rates increase with depth in the
ocean, Deep-Sea Res. II, 49, 237–251, 2002.
Buesseler, K. O., Livingston, H. D., Honjo, S., Hay, B. J., Man-ganini, S. J., Degens, E., Ittekkot, V., Izdar, E., and Konuk, T., and Kempe, S.: Chernobyl radionuclides in a Black Sea sediment trap, Nature, 329, 825–828, 1987.
Buesseler, K. O., Livingston, H. D., Honjo, S., Hay, B. J., Konuk, T., and Kempe, S.: Scavenging and particle deposition in the south-western Black Sea-evidence from Chernobyl radiotracers, Deep-Sea Res., 37, 413–430, 1990.
Buesseler, K. O., Aoyama, M., and Fukasawa, M.: Impacts of the Fukushima nuclear power plants on marine radioactivity, Envi-ron. Sci. Tech., 45, 9931–9935, 2011.
Buesseler, K. O., Jayne, S. R., Fisher, N. S., Rypina, I. I., Baumann, H., Baumann, Z., Breier, C. F., Douglass, E. M., George, J., Mac-donald, A. M., Miyamoto, H., Nishikawa, J., Pike, S. M., and Yoshida, S.: Fukushima-derived radionuclides in the ocean and biota off Japan, Proc. Natl. Acad. Sci., 109, 5984–5988, 2012. Charette, M. A., Breier, C. F., Henderson, P. B., Pike, S. M., Rypina,
I. I., Jayne, S. R., and Buesseler, K. O.: Radium-based estimates of cesium isotope transport and total direct ocean discharges from the Fukushima Nuclear Power Plant accident, Biogeo-sciences, 10, 2159–2167, doi:10.5194/bg-10-2159-2013, 2013. Chino, M., Nakayama, H., Nagai, H., Terada, H., Katata, G., and
Yamazawa, H.: Preliminary estimation of release amounts of131I and137Cs accidentally discharged from the Fukushima Daiichi nuclear power plant into the atmosphere, J. Nuclear Sci. Tech., 48, 1129–1134, 2011.
Fowler, S. W., Buat-Menard, P., Yokoyama, Y., Ballestra, S., Holm, E., and van Nguyen, H.: Rapid removal of Chernobyl fallout from Mediterranean surface waters by biological activity, Nature, 329, 56–58, 1987.
Haba, H., Kanaya, J., Mukai, H., Kambara, T., and Kase, M.: One-year monitoring of airborne radionuclides in Wako, Japan, af-ter the Fukushima Daiichi nuclear power plant accident in 2011, Geochem. J., 46, 271–278. 2012.
Honda, M. C., Imai, K., Nojiri, Y., Hoshi, F., Sugawara, T., and Kusakabe, M.: The biological pump in the northwestern North Pacific based on fluxes and major components of particulate mat-ter obtained by sediment-trap experiment (1997–2000), Deep-Sea Res. II, 49, 5595–5625, 2002.
Honda, M. C., Sasaoka, K., Kawakami, H., Matsumoto, K., Watan-abe, S., and Dickey, T.: Application of underwater optical data to estimation of primary productivity, Deep-Sea Res. I, 56, 2281– 2292, 2009.
Honda, M. C., Aono, T., Aoyama, M., Hamajima, Y., Kawakami, H., Kitamura, M., Masumoto, Y., Miyazawa, Y., Takigawa, M., and Saino, T.: Dispersion of artificial caesium-134 and -137 in
the western North Pacific one month after the Fukushima acci-dent, Geochem. J., 46, e1–e9, 2012.
IAEA (International Atomic Energy Agency) Technical Reports Se-ries, 422, 95 pp., 2004.
Kaneyasu, N., Ohashi, H., Suzuki, F., Okuda, T., and Ikemori, F.: Sulfate aerosol as a potential transport medium of radiocesium from the Fukushima nuclear accident, Environ. Sci. Tech. 46, 5720–5726, 2012.
Kasamatsu, F. and Ishikawa, Y.: Natural variation of radionuclide 137Cs concentration in marine organisms with special reference
to the effect of food habits and trophic level, Mar. Ecol. Prog. Ser., 160, 109–120, 1997.
Kawamura, H., Kobayashi, T., Furuno, A., Ishikawa, Y., Nakayama, T., Shima, S., and Awaji, T.: Preliminary numerical experiments on oceanic dispersion of 131I and 137Cs discharged into the ocean because of the Fukushima Daiichi nuclear power plant dis-aster, J. Nucl. Sci. Technol., 48, 1349–1356, 2011.
Kempe, S. and Nies, H.: Chernobyl nuclide record from a North Sea sediment trap, Nature, 329, 828–831, 1987.
Kogure, T., Morimoto, K., Tamura, K., Sato, H., and Yamagishi, A.: XRD and HRTEM evidences for fixation of cesium ions in vermiculite clay, Chem. Lett., 41, 380–382, 2012.
Kusakabe, M., Ku, T. -L., Harada, K., Taguchi, K., and Tsunogai, S.: Chernobyl radioactivity found in mid-water sediment inter-ceptors in the N Pacific and Bering Sea, Geophys. Res. Lett., 15, 44–47, 1988.
Masumoto, Y., Miyazawa, Y., Tsumune, D., Kobayashi, T., Es-tournel, C., Marsaleiz, P., Lanerolle, L., Mehra, A., and Gar-raffo, Z. D.: Oceanic dispersion simulation of cesium 137 from Fukushima Daiichi nuclear power plant, Elements, 8, 207–212, 2012.
Miyazawa, Y., Masumoto, Y., Varlamov, S. M., Miyama, T., Taki-gawa, M., Honda, M., and Saino, T.: Inverse estimation of source parameters of oceanic radioactivity dispersion models associated with the Fukushima accident, Biogeosciences, 10, 2349–2363, doi:10.5194/bg-10-2349-2013, 2013.
Morino, Y., Ohara, T., and Nishizawa, M.: Atmospheric behav-ior, deposition, and budget of radioactive materials from the Fukushima Daiichi nuclear power plant in March, Geophys. Res. Lett., 38, L00G11, doi:10.1029/2011GL048689, 2011.
NERH (Nuclear Emergency Response Headquarters, Government of Japan): Report of Japanese Government to the IAEA Minis-terial Conference on Nuclear Safety-The Accident at TEPCO’s Fukushima Nuclear Power Stations-, http://www.kantei.go.jp/ foreign/kan/topics/201106/iaea houkokusho e.html, 2011. Otosaka, S. and Kobayashi, T.: Sedimentation and remobilization
of radiocesium in the coastal area of Ibaraki, 70 km south of the Fukushima Dai-ichi nuclear power plant, Environ. Monit. As-sess., 184, 12, doi:10.1007/S10661-012-2956-7, 2012.
Qin, H., Yokoyama, Y., Fan, Q., Iwatani, H., Tanaka, K., Sakaguchi, A., Kanai, Y., Zhu, J., Onda, Y., and Takahashi, Y.: Investiga-tion of cesium adsorpInvestiga-tion on soil and sediment samples from Fukushima prefecture by sequential extraction and EXAFS tech-nique, Geochem. J., 46, 297–302. 2012.
hardt, S., Tapia, C., Vargas, A., and Yasunari, T. J.: Xenon-133 and caesium-137 releases into the atmosphere from the Fukushima Dai-ichi nuclear power plant: determination of the source term, atmospheric dispersion, and deposition, Atmos. Chem. Phys., 12, 2313–2343, doi:10.5194/acp-12-2313-2012, 2012.
Tsumune, D., Tsubono1, T., Aoyama, M., and Hirose, K.: Distri-bution of oceanic137Cs from the Fukushima Daiichi Nuclear Power Plant simulated numerically by a regional ocean model, J. Environ. Radioact., 111, 100–108, 2011.
Chernobyl radionuclides in shellfish, J. Environ. Radioact., 7, 107–121, 1988.