Clim. Past, 11, 803–824, 2015 www.clim-past.net/11/803/2015/ doi:10.5194/cp-11-803-2015
© Author(s) 2015. CC Attribution 3.0 License.
Bottom water variability in the subtropical northwestern Pacific
from 26 kyr BP to present based on Mg
/
Ca and stable carbon
and oxygen isotopes of benthic foraminifera
Y. Kubota1,2, K. Kimoto2, T. Itaki3, Y. Yokoyama4,5, Y. Miyairi4, and H. Matsuzaki6
1Department of Geology and Paleontology, National Museum of Nature and Science, 4-1-1, Amakubo, Tsukuba-shi,
Ibaraki 305-0005, Japan
2Research Institute for Global Change, Japan Agency for Marine-Earth Science and Technology, 2-15 Natsushima-cho,
Yokosuka-shi, Kanagawa 237-0061, Japan
3Geological Survey of Japan, National Institute of Advanced Industrial Science and Technology, Central 7, Higashi 1-1-1,
Tsukuba-shi, Ibaraki 305-8567, Japan
4Atmosphere and Ocean Research Institute, the University of Tokyo, 5-1-5, Kashiwanoha, Kashiwa-shi,
Chiba 277-8564, Japan
5Department of Biogeochemistry, Japan Agency for Marine-Earth Science and Technology, 2-15, Natsushima-cho,
Yokosuka-shi, Kanagawa 237-0061, Japan
6Department of Nuclear Engineering and Management, the University of Tokyo, 2-11-16 Yayoi, Bunkyo-ku,
Tokyo 113-0032, Japan
Correspondence to:Y. Kubota ([email protected])
Received: 27 February 2014 – Published in Clim. Past Discuss.: 28 March 2014 Revised: 18 February 2015 – Accepted: 26 Febrauary 2015 – Published: 3 June 2015
Abstract. To understand bottom water variability in the subtropical northwestern Pacific, bottom water temperatures (BWTs), carbon isotopes (δ13C), and oxygen isotopes of seawater (δ18Ow) at a water depth of 1166 m were
recon-structed from 26 kyr BP to present. A new regional Mg/Ca calibration for the benthic foraminiferaCibicidoides wueller-storfi(type B) was established to convert the benthic Mg/Ca value to BWT, based on 26 surface sediment samples and two core-top samples retrieved around Okinawa Island. Dur-ing the Last Glacial Maximum (LGM), the δ18Ow in the
intermediate water in the northwestern South Pacific was ∼0.4 ‰ lower than in the deep South Pacific, indicating a greater vertical salinity gradient than at present. This salin-ity (and probably denssalin-ity) structure would have led to strati-fication in the intermediate and deep Pacific, which would, in turn, have greatly influenced carbon storage during the glacial time. The benthic Mg/Ca andδ18Ow records
sug-gest changes that seem to follow Heinrich event 1 (H1) and the Bølling–Alleød (B/A) and Younger Dryas (YD) intervals, with BWT higher during H1 (∼17 kyr BP) and
YD (∼12 kyr BP) and lower during B/A (∼14 kyr BP). The warming in the bottom water during H1 suggests increased contribution of North Pacific Intermediate Water (NPIW) to the subtropical northwestern Pacific and decreased upwelling of cooler waters from the abyssal North Pacific. During the interval from 17 to 14.5 kyr BP, the BWT tended to decrease successively in association with a decrease inδ13C values, presumably as a result of increased upwelling of the abyssal waters to the intermediate depths of the North Pacific caused by shoaling and enhancement of the southward return flow of Pacific Deep Water (PDW). During the Holocene, the millennial- to sub-millennial-scale variations in the BWT generally correlate with the sea surface temperatures in the Okhotsk Sea, the source region of the NPIW, suggesting that changes in the BWT are linked to changes in the NPIW pro-duction rate.
804 Y. Kubota et al.: Bottom water variability from 26 kyr BP to present based on Mg/Ca
1 Introduction
Intermediate and deep water circulation in the Pacific is of particular interest because the deep Pacific is potentially an area in which a large amount of carbon was stored during glacial times (Broecker et al., 2004, 2008). It has been hy-pothesised that, during the last glacial period, older carbon was released to the atmosphere from the deep Pacific or Southern Ocean through changes in ocean circulation (e.g. Sigman and Boyle, 2000). Thus, the reconstruction of inter-mediate and deep ocean circulation in the North Pacific and its link to CO2release into the atmosphere is essential for
understanding of the mechanisms of glacial–interglacial cli-mate change.
At present, deep water formation is absent in the North Pacific because of excess precipitation and subsequent low surface salinity in the subarctic (e.g. Warren, 1983). Instead, the presence of intermediate water in the North Pacific (North Pacific Intermediate Water; NPIW) is seen as a well-defined salinity minimum in the subtropical North Pacific at depths of approximately 300 to 800 m (e.g. Sverdrup et al., 1942; Reid, 1965; Talley, 1993; Yasuda, 1997).
Several studies have been conducted regarding the sub-arctic Pacific, including the western North Pacific (Ahagon et al., 2003; Sagawa and Ikehara, 2008), the Okhotsk Sea (Ohkushi et al., 2003), and the Bering Sea (Horikawa et al., 2010; Rella et al., 2012). Together, this body of work has improved our understanding of intermediate and deep water formation and ocean circulation in the subarctic North Pa-cific since the Last Glacial Maximum (LGM). During the LGM, a centre of high-nutrient water, recognised by the lowest benthic carbon isotope values in direction of depth, existed at ∼3000 m water depth, which is∼1000–1500 m deeper than the level of a similar layer today in the North Pacific, suggesting a more vertically compressed circulation than today (Keigwin, 1998; Matsumoto et al., 2002). During the last deglaciation, Pacific circulation seemed to shift from a glacial stratified mode to an interglacial upwelling mode during the transition between Heinrich event 1 (H1) and the Bølling–Allerød interval (B/A) (Okazaki et al., 2010, 2012). In particular, deep water formation during H1, which may have reached ∼2500 m water depth, was suggested by14C age differences between planktic and benthic foraminifers (Okazaki et al., 2010). Okazaki et al. (2010) argued that, dur-ing H1, a deep Pacific Meridional Overturndur-ing Circulation (PMOC) was established, driven by a collapse of the Atlantic Meridional Overturning Circulation (AMOC) that occurred after a large freshwater discharge into the high-latitude North Atlantic. However, recently, Jaccard and Galbraith (2013) ar-gued against such a deep water formation and claimed that waters deeper than ∼2400 m were poorly ventilated, while the upper portion of the North Pacific (i.e. above ∼1400 m depth) was well ventilated. Regardless of the conclusion of the debate regarding how deep the ventilated water reached during H1, the upper 1400 m of the water column appears
to have been well ventilated in the subarctic North Pacific, likely owing to greater NPIW production in association with a shift of its production area from the Okhotsk Sea to the Bering Sea (Rella et al., 2012) or the open subarctic Pacific (Jaccard and Galbraith, 2013). Signs of enhanced ventilation were found off northeastern Japan, suggesting greater lateral advection of NPIW to the mid-latitude northwestern Pacific (Ahagon et al., 2003; Sagawa and Ikehara, 2008). Some of these studies suggested stronger and well-ventilated NPIW also during YD, whereas NPIW during B/A was reduced and less well ventilated. In contrast to the intensive research that has focused on the deglaciation, there are fewer studies deal-ing with Holocene variability of the intermediate/deep Pa-cific circulation system.
Investigation of the variability of intermediate water in the subtropical Pacific is significant for our understanding of in-termediate/deep ocean circulation in the Pacific as a whole and its links to postulated CO2 degassing in the South
Pa-cific or Southern Ocean. Nevertheless, the intermediate wa-ter variability in the subtropical North Pacific remains poorly understood. To address this, we present intermediate tem-perature and salinity records based on benthic foraminiferal magnesium / calcium ratios (Mg/Ca) as well as stable oxy-gen and carbon isotope records that reveal temporal varia-tions in bottom water properties in the northwestern Pacific from 26 kyr BP to present.
2 Oceanographic setting and water mass tracers
The North Pacific can be divided into the subtropical and subarctic gyres at∼35 to 40◦N. On the surface, the west-ern boundary current, the Kuroshio, flows northward along the western side of the North Pacific and carries warm, saline, and oligotrophic water to the high latitudes, while the Oyashio flows southward and transports cold and more eu-trophic water away from the high latitudes. There are three main water types at intermediate depths (500–1000 m) in the Pacific Ocean: NPIW, Antarctic Intermediate Water (AAIW), and Equatorial Pacific Intermediate Water (EqPIW) (e.g. Bo-stock et al., 2010). The distribution and flow of NPIW are shown in Fig. 1. NPIW is characterised by low salinity (33.9– 34.16) and low oxygen concentrations (50–150 µmol kg−1)
(Kaneko et al., 2001; Bostock et al., 2010). At present, this water mass is formed in the Okhotsk Sea, subducts into and below the thermocline of the Kuroshio Extension, enters the subtropical gyres (Reid, 1965; Kaneko et al., 2001), and is distributed at intermediate depths in the North Pacific (Tal-ley, 1993). In the west, a tongue of NPIW extends into the Celebes Sea (Bingham and Lukas, 1995), while in the east, NPIW is restricted to the subtropical gyre by the broad Cal-ifornia Current (Talley, 1993). AAIW is a distinctive water mass with high oxygen concentrations (200–250 µmol kg−1) and relatively low salinity (34.3–34.5) (Bostock et al., 2010). AAIW is formed in the southeast Pacific off southern Chile
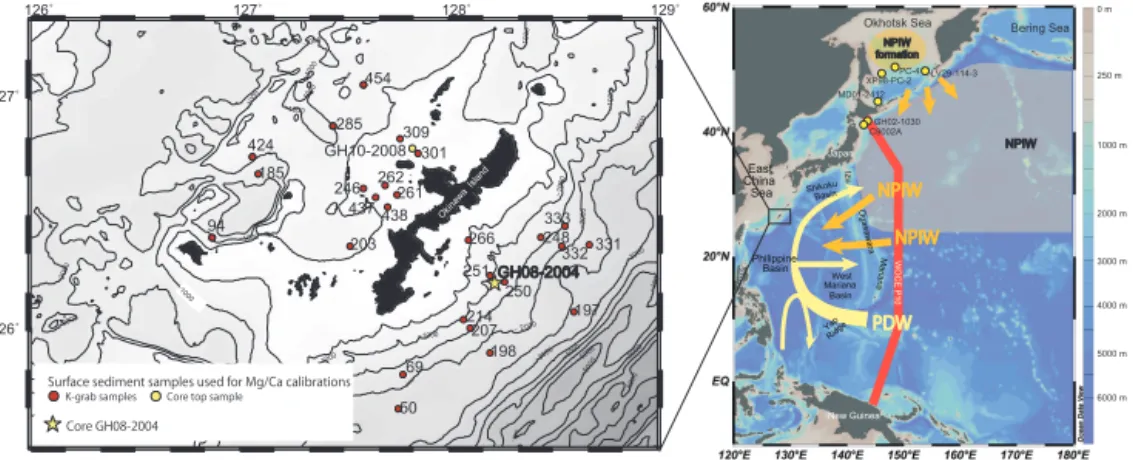
Y. Kubota et al.: Bottom water variability from 26 kyr BP to present based on Mg/Ca 805 New Guinea Philippine Basin East China Sea Japan T aiwan Shikoku Basin West Mariana Basin Luzon Izu Yap Ridge Mariana Mindanao 26˚ 27˚ − 6000 −5000 −5000 −5000 −5000 −4000 −4000 −3000 −3000 −2000 −2000 −2000 − 2000 −2000 −2000 −1000 −1000 −1000 −100 0 −1000 −1000 −1000 −1000 −1000
−1000 −1000
−1000 −1000 − 1000 −1000 −1000 GH08-2004 GH10-2008 185 424 94 203 246 262261 285 301 309 437 438 454 50 69 197 198 207 214 248 250 251 266 332 333 Okinawa Island
−1000 −1000 NPIW formation GH02-1030 Bering Sea Okhotsk Sea WOCE P10
126˚ 127˚ 128˚ 129˚
2000 m 4000 m 3000 m 5000 m 6000 m 1000 m 250 m 0 m
K-grab samples Core top sample
Surface sediment samples used for Mg/Ca calibrations
Core GH08-2004 Ogasawara NPIW 331 LV29-114-3 MD01-2412 XP98-PC-2PC-4 C9002A
Figure 1.Map showing the locations of surface sediment samples and cores discussed in this study. The orange and yellow arrows indicate the flow of water at 500 and 1500 m water depth, respectively (Kaneko et al., 2001). The red line indicates WOCE Section P10. NPIW: North Pacific Intermediate Water; PDW: Pacific Deep Water.
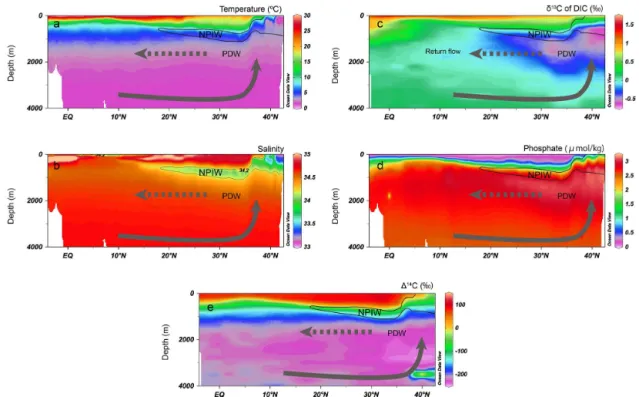
(Talley, 1996; Tsuchiya and Talley, 1998; Hanawa and Tal-ley, 2001) and flows west into the Coral Sea. The distribution and flow path of AAIW is still under debate (Reid, 1997; Ya-suda, 2004; Qu and Lindstrom, 2004). EqPIW is distributed in the equatorial and tropical Pacific (approximately 15◦N to 15◦S) at intermediate depths (< 1000 m water depth). Based on quasi-conservative tracers, such as radiocarbon (114C), EqPIW is a combination of parental AAIW waters mixed with old PDW. PDW lies beneath the NPIW (<∼1000 m) in the North Pacific (Fig. 2). The deep Pacific is ventilated from the south by the densest waters, such as Antarctic Bot-tom Water and lower Circumpolar Deep Water, which upwell to moderate depths in the North Pacific and return south as PDW (Schmitz, 1996).
Carbon isotope values (δ13C) of dissolved inorganic car-bon (DIC) have been utilised as water mass tracers. Theδ13C values of DIC (δ13CDIC) at intermediate or deep water depths
are controlled primarily by the mixing and ages of the water masses, as well as surface water processes such as biologi-cal productivity and air–sea exchange (Duplessy et al., 1988; Kroopnick, 1985; Mook et al., 1974). Because lighter 12C is preferentially taken up by phytoplankton to form organic carbon at the surface,δ13CDICgenerally exhibits higher
val-ues at the ocean surface. Thus, δ13C distribution exhibits an inverse relationship with nutrient concentrations. As13 C-depleted organic carbon sinks and remineralises at depth, it decreases the δ13CDIC of deep water. Modern δ13CDIC
data show a clear separation depending on the water masses, with NPIW (−0.5–0 ‰) < Northern EqPIW (−0.25–0.25 ‰) < Southern EqPIW (0–0.5 ‰) < AAIW (0.75–1.75 ‰) (Bo-stock et al., 2010). The distribution of the δ13CDICis
com-parable to the phosphate distribution in the North Pacific (Fig. 2). The lowest δ13C water is found below the main thermocline and above approximately 2500 m water depth (Fig. 2), which is consistent with the highest nutrient content at these depths. Moreover,δ13C of PDW becomes higher
to-ward the south, which can be explained by mixing with the nutrient-depleted upper Circumpolar Deep Water along the path of its flow (Matsumoto et al., 2002).
The study area is located east of Okinawa Island in the northern part of the Philippine Sea, which lies on the western side of the North Pacific and is composed of three basins: the Shikoku, Philippine, and West Mariana basins (Fig. 1). The general circulation regime changes at around 1500 m water depth in the Philippine Sea (Kaneko et al., 2001). Above this depth, the clockwise subtropical gyre is dominant, with multiple zonal inflows of intermediate waters from west-ern and southwestwest-ern areas. NPIW flowing into the Philip-pine Sea crosses the Izu–Ogasawara–Mariana–Yap Ridge at 26◦N, 20◦N with a total flow of 11×109kg s−1. Of this, 8×10⁹kg s−1 circulates within the subtropical gyre along the Kuroshio, while the remainder is transported to the trop-ics and the South China Sea (Kaneko et al., 2001). Rela-tively high-oxygen water does exist in the Okinawa Trough and south of Japan (Komatsu et al., 2004), and had previ-ously been considered to be attributed to the influence of AAIW (Reid, 1997; Yasuda, 2004). However, Qu and Lind-strom (2004) subsequently showed evidence that AAIW does not reach northward of 15◦N based on traceable salinity min-ima. At 1500–3000 m water depth, a main inflow at 9–15◦N likely carries PDW from the eastern tropical Pacific along 10◦N, forming a large clockwise gyre in the Philippine Basin (Kaneko et al., 2001). The net inflow south of 15◦N is esti-mated to be 17×109kg s−1, all of which returns eastward at 16–24◦N (Kaneko et al., 2001). Bottom waterδ13CDICnear
site GH08-2004 is−0.19 ‰ at 968 m water depth (Suzuki et al., 2009), which is similar toδ13CDICat 10◦N at the same
depth along 145◦E, which is consistent with the postulated flow path. A salinity profile at site GH08-2004 is shown in Fig. 3 (Itaki et al., 2009b) and exhibits a salinity minimum (34.16) that is indicative of the influence of NPIW at 700 m water depth. The increase in salinity deeper than 700 m water
806 Y. Kubota et al.: Bottom water variability from 26 kyr BP to present based on Mg/Ca
Figure 2.Latitudinal transects along WOCE Section P10:(a)temperature,(b)salinity,(c)δ13C of dissolved inorganic carbon,(d)phosphate
concentration, and(e)114C vs. depth (0–4000 m). All the data from Fukasawa et al. (2005) are available at http://cdiac.ornl.gov/oceans/
woce_p10.html. Figures are made with Ocean Data View (Schlitzer, 2009). NPIW: North Pacific Intermediate Water; PDW: Pacific Deep Water. The arrows indicate the upwelling of abyssal Pacific waters and the return flow of PDW.
a b c
0
500
1000
1500
2000
2500
3000
3500
4000
5 10 15 20 25 30
Depth (m)
Temperature (ºC)
0 50 100 150 200
Δ[CO3 2-] (μmol/kg)
34.2 34.4 34.6 34.8 35
Salinity
Figure 3.(a)Annual temperature and(b)salinity profile at World Ocean Atlas Station #664355 (Locarnini et al., 2013; Zweng et al.,
2013) and (c)1[CO23−] at Global Ocean Data Analysis Project
(GLODAP) station #28582 (Key et al., 2004).
depth indicates the decreasing contribution of the NPIW and the increasing contribution of relatively more saline PDW. Thus, the bottom at this site is regarded as being primarily under the influence of a mixture of PDW and NPIW.
3 Samples and location
3.1 Surface sediment samples and core GH08-2004
Twenty-six surface sediment samples were recovered from the area around Okinawa Island using a Kinoshita grab sam-pler (K-grab) during the GH08, GH09, and GH10 cruises of the Geological Survey of Japan on R/VHakurei-maru No. 2 (Fig. 1; Itaki et al., 2009a, 2010, 2011a). The samples were collected from a wide range of water depths, from ∼300 to 2700 m. The top 0–2 cm of each of the K-grab samples was taken for the present study. These sediments consisted of sandy mud to mud (Table 1), and the locations of the sur-face samples were carefully selected and restricted to areas in which reworking or sediment transport from shallower ar-eas (such as turbidites) was unlikely to have occurred. The age uncertainties of the two core-top samples are 347 years for GH08-2004 and 99 years for GH10–2008, respectively, which are extrapolated from the youngest14C datums (Ta-ble 1). Given that the minimum sedimentation rate around Okinawa Island is reported to be∼5 cm kyr−1(Amano and Itaki, 2012), the maximum age uncertainty for the surface sediment samples is estimated to be ∼400 years. In situ bottom water temperatures (BWTs) and salinities were mea-sured using an Idronaut Ocean Seven 306 conductivity, tem-perature, and depth (CTD) profiler system attached to the K-grab sampler. These surface sediment samples and two
Y
.
K
ubota
et
al.:
Bottom
w
ater
var
iability
from
26
kyr
BP
to
present
based
on
Mg
/
Ca
807
Table 1.List of the surface sediment samples and Mg/Ca values ofC. wuellerstorfitype B. Mg/Ca variability represents a maximum deviation from the mean value of the measurement.
Sampler Cruise Sample Latitude Longitude Sample Description Water Number of Bottom Bottom δ18O
w 1[CO2−
3 ] Mg/Ca Equivalent
ID depth depth specimens water water (‰, VSMOW) (µmol Mg/Ca error age
(cm) (m) temperature salinity Suzuki et al. kg−1) (mmol ±(mmol (yr)
(◦C) (2010) mol−1) mol−1)
K-grab GH09 261 N 26◦35′15.0" E 127◦45′10.8" 0–2 greyish-olive 336 6 16.31 34.71 124.91 3.10
foraminifer-bearing mud
K-grab GH09 262 N 26◦37′41.4" E 127◦41′44.4" 0–2 olive-yellow mud 346 4 15.89 34.68 122.39 2.6
K-grab GH09 301 N 26◦45′53.4" E 127◦51′15.0" 0–2 greyish-olive 382 9 14.36 34.59 113.32 2.73 0.012
foraminifer-bearing sandy mud
Gravity GH10 GH10–2008 N 26◦47′00.6" E 128◦49′04.8" 0–2.2 sandy silt 387 6.00 13.6 34.45 112.06 2.59 99
core core top
K-grab GH09 309 N 26◦49′40.2" E 127◦46′0.30" 0–2 olive foraminifer- 405 7 13.26 34.53 107.44 2.54 0.076
bearing mud
K-grab GH09 438 N 26◦32′60.6" E 127◦42′28.8" 0–2 olive-yellow 430 5 13.70 34.55 100.76 2.85 0.089
foraminifer-bearing sandy mud
K-grab GH09 437 N 26◦03′27.6" E 127◦39′01.8" 0–2 olive-yellow mud 446 7 13.06 34.5 96.48 2.55 0.070
K-grab GH09 246 N 26◦30′41.4" E 127◦35′31.8" 0–2 olive-yellow mud 472 6 12.97 34.52 89.52 2.78
K-grab GH08 266 N 26◦23′33.6" E 128◦50′43.2" 0–2 greyish-olive mud 496 3 11.92 34.40 83.10 2.10 0.073
K-grab GH09 203–2 N 26◦21′58.8" E 127◦30′10.2" 0–2 greyish-olive 714 7 7.31 34.35 33.71 1.69 0.033
sandy mud
K-grab GH09 454 N 27◦30′32.4" E 127◦35′33.6" 0–2 olive mud 797 7 6.00 34.39 −0.34 23.08 1.33 0.030
K-grab GH10 424 N 26◦45′01.2" E 127◦03′39.0" 0–2 dark-olive 959 9 4.70 34.41 11.48 1.26 0.028
medium sand (0–1.5 cm) and olive-grey silt (1.5–2 cm)
K-grab GH08 251 N 26◦14′23.4" E 128◦11′05.4" 0–2 greyish-olive 968 8 3.74 34.43 11.20 1.25 0.010
foraminifer-bearing mud
K-grab GH09 285 N 26◦52′58.2" E 127◦02′40.8" 0–2 olive mud 1008 7 4.81 34.42 −0.38 10.15 1.25 0.051
K-grab GH10 94 N 26◦24′01.2" E 126◦52′04.2" 0–2 olive silt 1080 4 4.15 34.43 9.98 1.16
K-grab GH08 214 N 26◦03′00.6" E 128◦04′16.2" 0–2 greyish-olive 1117 9 3.17 34.39 9.80 1.05 0.183
foraminifer-bearing mud
Gravity GH08 GH08-2004 N 26◦12′51.6" E 128◦14′10.2" 0–2.2 olive mud 1166 7 3.01 34.51 9.82 1.17 347
core core top
K-grab GH10 185 N 26◦40′21.6" E 127◦05′12.6" 0–2 greyish-olive 1294 8 3.93 34.46 9.26 1.11 0.027
sandy silt
K-grab GH08 248 N 26◦24′18.6" E 128◦26′30.6" 0–2 dark olive 1369 13 2.58 34.54 10.11 1.23 0.045
foraminifer-bearing sandy mud
K-grab GH08 250 N 26◦12′46.2" E 128◦16′04.8" 0–2 dark greyish-yellow 1369 10 2.71 34.54 10.11 0.047
foraminifer-bearing mud
K-grab GH08 207 N 26◦00′04.8" E 128◦00′37.2" 0–2 greyish-olive 1455 11, 10a 2.51 34.56 10.67 1.13 0.22b
foraminifer-bearing mud
K-grab GH08 333 N 26◦27′09.6" E 128◦33′25.2" 0–2 yellowish-brown 1611 9 2.07 34.51 10.27 0.99 0.050
foraminifer-bearing mud
K-grab GH08 69 N 25◦48′44.4" E 127◦46′53.4" 0–2 greyish-yellow 1774 6 2.17 34.58 9.66 1.05
foraminifer-bearing sandy mud
K-grab GH08 332 N 26◦22′00.0" E 128◦03′15.0" 0–2 yellowish-brown 1952 11 2.09 34.56 10.53 0.85 0.009
foraminifer-bearing sandy mud
K-grab GH08 331 N 26◦22′20.4" E 128◦40′24.6" 0–2 yellowish-brown 2195 4, 2a 1.83 34.59 9.98 0.88 0.048b
foraminifer-bearing mud
K-grab GH08 198 N 25◦54′22.2" E 128◦11′53.4" 0–2 greyish-olive 2201 2 1.84 34.64 9.95 0.83 0.058
foraminifer-bearing sandy mud
K-grab GH08 50 N 25◦39′48.6" E 127◦45′29.4" 0–2 greyish-yellow 2281 3 1.88 34.63 9.63 0.91
foraminifer-bearing mud
K-grab GH08 197 N 26◦50′00.6" E 128◦36′01.2" 0–2 greyish-olive 2679 6 1.65 34.66 7.27 1.13 0.176
foraminifer-bearing mud
aForaminiferal tests were repicked and rerun for Mg/Ca analysis.bMaximum deviation from the average of the duplicated analyses.
www
.clim-past.net/11/803/2015/
Clim.
P
ast,
11,
803–824,
808 Y. Kubota et al.: Bottom water variability from 26 kyr BP to present based on Mg/Ca
top samples were used to calibrate benthic Mg/Ca to BWT (Table 1). Since CTD measurements were not conducted at the core sites, CTD data from the vicinity were used for BWTs of the core-top samples.
In order to evaluate the influence of carbonate satura-tion on Mg/Ca values, calcite saturation state in this area was estimated using CO2sys.xls (ver. 12) (Pelletier et al., 2005) with parameters including pressure, BWT (◦C), salin-ity, total CO2 (µmol kg−1), and alkalinity (µmol kg−1) (Yu
and Elderfield, 2008). BWT and salinity data were obtained from World Ocean Atlas station #664355 (Locarnini et al., 2013; Zweng et al., 2013), and total CO2 (µmol kg−1) and
alkalinity (µmol kg−1) were obtained from Global Ocean
Data Analysis Project (GLODAP) station #28582 (Key et al., 2004). The equilibrium constants K1 and K2 are
those from Dickson and Millero (1987), and the dissolu-tion constant KSO4 for the bisulfate ion was obtained from
Dickson (1990). Carbonate saturation state was defined as
1[CO23−]=[CO23−]−[CO23−]sat. [CO23−]sat was calculated
by [CO23−]sat=[CO23−]/, whereis the solubility ratio of
calcite.
A gravity core (GH08-2004, with a length of 2.73 m) was recovered from the continental slope east of Okinawa Island (26◦12′52"N, 127◦5′13"E; 1166 m water depth). An olive-coloured oxidation layer was identified in the upper 8 cm of the core (Itaki et al., 2009a), while the lower part of the core consisted of olive to grey silty clay with some patches of sand. A brownish-grey tephra layer was recognised at 43 cm beneath the seafloor, and was identified as the K–Ah tephra (7.3 kyr BP; Kitagawa et al., 1995) based on chem-ical analyses using an electron probe micro-analyser (Itaki et al., 2009a). The core material was subsampled at 2.2 cm intervals, and roughly half of the horizons were processed for measurement. On average, we measured the samples at ∼3.6 cm intervals for the stable isotopes and∼4.3 cm for the trace elements.
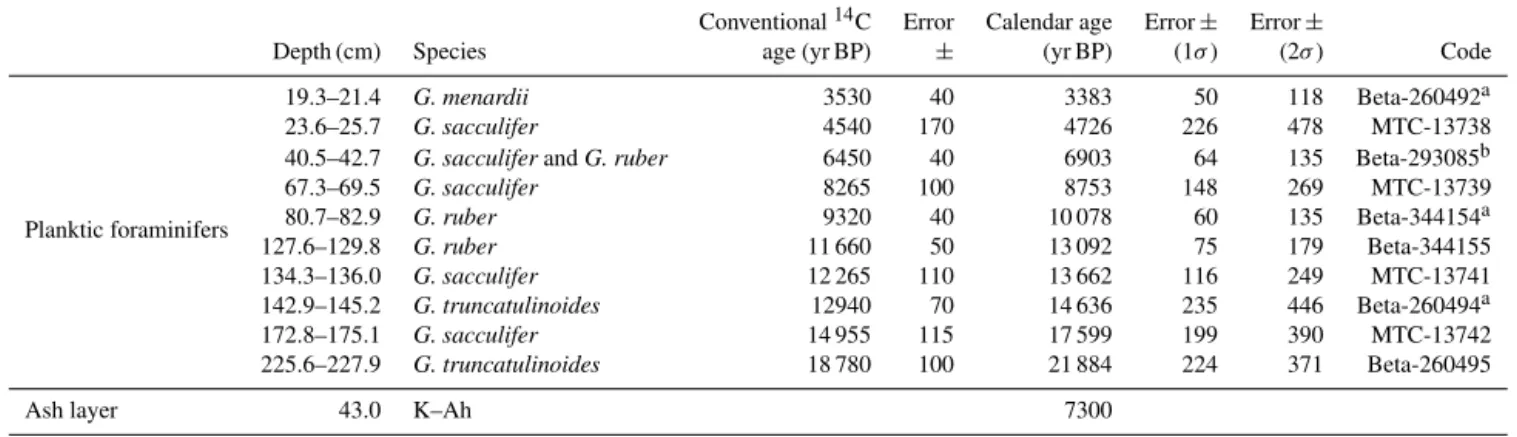
3.2 Age model for GH08-2004
Radiocarbon analyses (Table 2) were carried out by accel-erator mass spectrometry (AMS) on approximately 6–12 mg of the planktic foraminiferaGlobigerinoides sacculifer, Glo-bigerinoides ruber, Globorotalia menardii, andGloborotalia truncatulinoides in addition to the results by Itaki (2010) and Itaki et al. (2011b). The foraminiferal tests were ex-tracted from sediment samples in 10 core horizons. The con-ventional 14C dates were converted to calendar ages using Calib 6.0 software (Stuiver and Reimer, 1993) with the Int-cal/Marine09 calibration curve (Reimer et al., 2009). A1R
value of 44±16 years was used as the regional reservoir correction, derived from six locations in the Ryukyu Islands (Yoneda et al., 2007). The14C datum just above the K–Ah tephra at 43 cm is in good agreement with the age of the tephra (7.3 kyr BP; Kitagawa et al., 1995) (Fig. 4). Because the ages from deeper-dwelling species (G. menardiiandG.
0
50
100
150
200
250
0 5 10 15 20 25
Depth (cm)
Calendar age (kyr BP)
Figure 4.Age model of GH08-2004. Open symbols represent the
14C data and 2σ errors. The filled symbol represents the K–Ah
tephra. Red circles indicate14C ages from deeper-dwelling planktic
foraminifers.
truncatulinoides) are in line with ages interpolated or extrap-olated from surface-dwelling species (Fig. 4), it is highly unlikely that mixing these species would give skewed re-sults. This is supported by the fact that an unpublished14C age of G. truncatulinoides from 172.8 to 175.1 cm depth is within the range of 2σ error of the age of the surface-dwelling species (T. Itaki, personal communication, 2014). Ages of GH08-2004 were interpolated between calibrated
14C dates including deeper-dwelling species and the tephra.
Linear sedimentation rates were∼10–15 cm kyr−1from 26
to 7.3 kyr BP and∼6–8 cm kyr−1from 7.3 kyr BP to present.
The time resolutions achieved were∼340 and∼430 yrs for the isotope and trace element analyses, respectively.
3.3 Benthic foraminiferaCibicidoides wuellerstorfi
The benthic foraminifera genusCibicidoidesis widely used in palaeoceanographic reconstructions because of its epifau-nal habitat and wide distribution. Mg/Ca calibration equa-tions have been proposed for severalCibicidoidesspecies, such asC. wuellerstorfi,Cibicidoides pachyderma, and Cibi-cidoides compressus(Rosenthal et al., 1997; Rathburn and De Decker, 1997; Lear et al., 2002; Martin et al., 2002; Elder-field et al., 2006; Marchitto et al., 2007; Healey et al., 2008; Yu and Elderfield, 2008; Raitzsch et al., 2008; Tisserand et al., 2013). AlthoughC. wuellerstorfiwas recognised in most of the surface sediments used in this study, the other Cibi-cidoidesspecies were rare.C. wuellerstorfiobserved in this study has two types of surface texture: one is sensu stricto, with a relatively smooth surface texture (type A), while the
Y. Kubota et al.: Bottom water variability from 26 kyr BP to present based on Mg/Ca 809
Table 2.Radiocarbon data from core GH08-2004.
Conventional14C Error Calendar age Error± Error±
Depth (cm) Species age (yr BP) ± (yr BP) (1σ) (2σ) Code
Planktic foraminifers
19.3–21.4 G. menardii 3530 40 3383 50 118 Beta-260492a
23.6–25.7 G. sacculifer 4540 170 4726 226 478 MTC-13738
40.5–42.7 G. sacculiferandG. ruber 6450 40 6903 64 135 Beta-293085b
67.3–69.5 G. sacculifer 8265 100 8753 148 269 MTC-13739
80.7–82.9 G. ruber 9320 40 10 078 60 135 Beta-344154a
127.6–129.8 G. ruber 11 660 50 13 092 75 179 Beta-344155
134.3–136.0 G. sacculifer 12 265 110 13 662 116 249 MTC-13741
142.9–145.2 G. truncatulinoides 12940 70 14 636 235 446 Beta-260494a
172.8–175.1 G. sacculifer 14 955 115 17 599 199 390 MTC-13742
225.6–227.9 G. truncatulinoides 18 780 100 21 884 224 371 Beta-260495
Ash layer 43.0 K–Ah 7300
a 14C data from Itaki (2010).b 14C data from Itaki et al. (2011b).
other is characterised by a granular surface on the umbilical side (type B) (Fig. 5; see “Taxonomic note” for a detailed description). It is highly unlikely that the granular surface of type B results from secondary calcite deposition based on the SEM images, becauseC. wuellerstorfitype B does not have such a texture on the spiral side (Fig. 5b). C. wuellerstorfi type B was more abundant than C. wuellerstorfitype A in most of the surface and core samples; therefore, the Mg/Ca temperature calibration equations were generated for type B. C. wuellerstorfitype B was used for the oxygen and carbon isotope time series. The oxygen and carbon isotopes of C. wuellerstorfitype A were also measured for 28 horizons, but Mg/Ca measurements were not performed owing to inade-quate sample sizes.
4 Analytical methods
Approximately 10–20 cm3of the K-grab and core materials was washed onto a 63 µm mesh sieve and dried in the oven at 50◦C. As many foraminifera tests as possible were picked from each sediment sample, and 1 to 20 well-preserved and clean tests were picked from the > 250 µm size fraction for Mg/Ca and isotope analyses. Cleaning steps based on Boyle and Keigwin (1985) were carried out prior to anal-yses with some slight modifications (Kubota et al., 2010). All cleaning steps were conducted in a class 10 000 lam-inar flow clean bench at the Research Institute for Global Change (RIGC), Japan Agency for Marine-Earth Science and Technology (JAMSTEC). First, the foraminiferal tests were crushed on a glass slide and placed into a micro-tube, where they were repeatedly washed using ultra-pure (Milli-Q) wa-ter (> 18.3 M) and methanol in an ultrasonic bath. Then, the samples were divided into two micro-tubes, for isotope and Mg/Ca analyses, respectively. For the Mg/Ca samples, ad-ditional cleaning steps were conducted; in particular, organic matter and manganese–iron oxides were removed using a re-ductive and oxidative procedure (Boyle, 1994). For 20 sur-face sediment samples, the foraminiferal tests were split into
(a)-1
(b)-1 (b)-2
(a)-2
(a)-3
(b)-3
Figure 5.SEM images ofC. wuellerstorfitype A: sensu stricto
(a)-1 umbilical side,(a)-2 spiral side,(a)-3 aperture andC. wuellerstorfi
type B(b)-1 umbilical side,(b)-2 spiral side, and(b)-3 aperture.
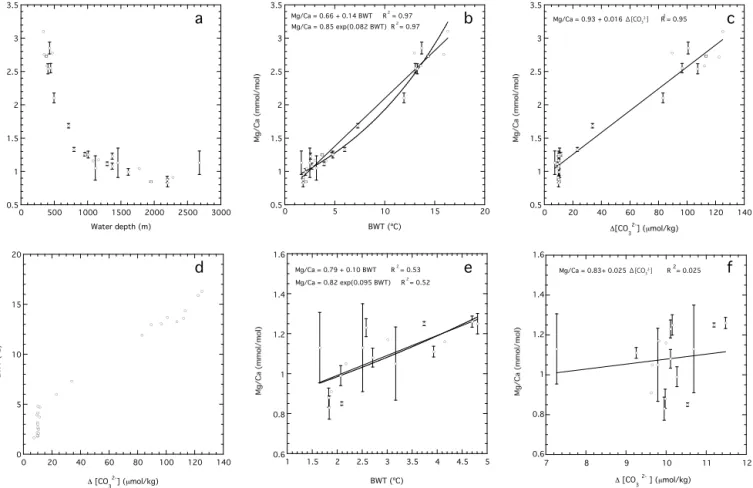
several sample cups after the cleaning steps and trace ele-ment compositions were measured for each sample cup. The obtained Mg/Ca ranges for each horizon are expressed as error bars in Fig. 6. For two of the surface sediment sam-ples (#331 and #207), another set of the foraminiferal tests was repicked, cleaned, and subjected to trace element analy-sis (Table 1).
Mg/Ca analysis was performed using a magnetic sector field inductively coupled plasma mass spectrometer (Thermo Finnigan, ELEMENT2) at the Mutsu Institute for Oceanog-raphy (MIO), JAMSTEC. Four isotopes of three elements (24Mg,44Ca,48Ca,55Mn) were analysed using Sc as an in-ternal standard. We used the SPEX Claritas PPT certified solutions as standard elemental solutions for all elements. Four working standards were prepared via successive dilu-tions of the stock standard soludilu-tions to match the concen-trations of Ca (20 to 5 ppm) and Mg (0.05 to 10 ppb), cov-ering the ranges of the Ca and Mg concentrations found in all of the samples. The precision of replicate analyses of the working standard for Mg/Ca in one sequence was better than±0.03 mmol mol−1. Mn/Ca was monitored to
810 Y. Kubota et al.: Bottom water variability from 26 kyr BP to present based on Mg/Ca
0 5 10 15 20
0 20 40 60 80 100 120 140
Δ [CO
3
2-] (μmol/kg)
0.5 1 1.5 2 2.5 3 3.5
0 5 10 15 20
Mg/Ca = 0.66 + 0.14 BWT R2
= 0.97
Mg/Ca = 0.85 exp(0.082 BWT) R2
= 0.97
BWT (ºC)
0.6 0.8 1 1.2 1.4 1.6
1 1.5 2 2.5 3 3.5 4 4.5 5
Mg/Ca = 0.79 + 0.10 BWT R 2
= 0.53
Mg/Ca = 0.82 exp(0.095 BWT) R2= 0.52
BWT (ºC)
0.5 1 1.5 2 2.5 3 3.5
0 20 40 60 80 100 120 140
Mg/Ca = 0.93 + 0.016 Δ[CO32-] R
2
= 0.95
Δ[CO
3 2-] (
μmol/kg)
0.6 0.8 1 1.2 1.4 1.6
7 8 9 10 11 12
Mg/Ca = 0.83+ 0.025 Δ[CO32-] R
2
= 0.025
Δ [CO
3 2- ] (
μmol/kg)
0.5 1 1.5 2 2.5 3 3.5
0 500 1000 1500 2000 2500 3000
Water depth (m) a
d
b
e
c
f
Figure 6.Mg/Ca values ofC. wuellerstorfitype B from the surface sediment samples vs.(a)water depth,(b)BWT, and(c)1[CO23−].(d)
BWT vs.1[CO23−]. Mg/Ca values vs.(e)BWT, and(f)1[CO23−] in the low temperature range. All the data are presented in Table 1.
check for possible diagenetic overgrowths (Boyle, 1983). Av-erage Mn/Ca was 88 µmol mol−1, and the standard devia-tion was found to be±326 µmol mol−1(1σ) owing to a few extremely high Mn/Ca values (> 1000 µmol mol−1). Three
samples with Mn/Ca values over 1σwere discarded.
δ18O andδ13C of both types ofC. wuellerstorfi(δ18Ocand
δ13Cc respectively) were measured using a Finnigan MAT
252 mass spectrometer (IR–MS) with a Kiel III carbonate de-vice at the MIO, JAMSTEC. The reproducibility of the mea-surements was better than±0.05 ‰ (1σ) for bothδ18O and
δ13C, as determined by replicate measurements of the inter-national standard NBS-19.
5 Results of Mg/Ca calibration
Previous studies have revealed that Mg/Ca of the benthic foraminiferaC. wuellerstorfiare controlled by both the tem-perature and carbonate chemistry of seawater, especially at lower1[CO23−] (Elderfield et al., 2006; Yu and Elderfield, 2008; Raitzsch et al., 2008; Healey et al., 2008). Here, we compare our benthic Mg/Ca results and their sensitivity to BWT and 1[CO23−]. Raitzsch et al. (2008) argued that Mg/Ca ofC. wuellerstorfiis more dependent on dissolved
inorganic carbon (DIC=[CO2]aq+[HCO−3]+[CO23−]) than
on1[CO23−].1[CO23−] decreases with decreasing [CO23−], while DIC increases with decreasing [CO23−]. Since both
1[CO23−] and DIC are linked to [CO23−],1[CO23−] is em-ployed here to discuss the influence of carbonate chemistry.
Mg/Ca values of C. wuellerstorfi type B obtained from the 28 surface sediment samples range from 0.83 to 3.10 mmol mol−1 and decrease rapidly with depth to ∼1000 m water depth, owing to the steeper gradient of the BWT and1[CO23−] in the upper 1000 m of the water col-umn (Table 1, Fig. 6). Conversely, the slope of the Mg/Ca– water depth relationship becomes more gentle owing to the smaller change both in the BWT and1[CO23−] with depth below 1000 m depth.
Although an exponential relationship between Mg/Ca and temperature is thermodynamically reasonable, some studies have reported that a linear fit is a more useful ap-proximation (Toyofuku et al., 2000; Marchitto et al., 2007). Exponential and linear regressions ofC. wuellerstorfitype B Mg/Ca on the BWTs that range from 1.7 to 16.3◦C yields the following relationships:
Y. Kubota et al.: Bottom water variability from 26 kyr BP to present based on Mg/Ca 811
Mg/Ca= 0.85 (±0.02)exp (0.082 (±0.003) BWT) (1)
(R2= 0.97, P <0.0001),
Mg/Ca=0.66 (±0.04)+0.14 (±0.005) BWT (2)
(R2=0.97, P <0.0001),
where the standard errors of the coefficients and intercepts are given in parentheses. The standard deviation of the differ-ence between the calculated and CTD temperature is±1.1◦C for the exponential regression and±0.92◦C for the linear re-gression. Based on these equations, the precision of repli-cate Mg/Ca analyses of ±0.03 mmol mol−1 corresponds to ±0.2–0.3◦C, which is smaller than the standard devi-ation derived from the calibrdevi-ation data set. Our Mg/Ca data also show a strong positive correlation to 1[CO23−] (R2=0.95) (Fig. 6c). Mg/Ca dependence on1[CO23−] is 0.016 mmol mol−1 per µmol kg−1 and yields the following relationship:
Mg/Ca=0.016 (±0.0007)1[CO23−] +0.93 (±0.04)
(R2=0.95, p<0.0001). (3)
It is difficult to quantify the effects of BWT and1[CO23−] in isolation owing to the robust relationship between them over this wide range of BWT (1.7 to 16.3◦C). Thus, we refer to the modern BWT vs.1[CO23−] diagram to discuss in greater detail the effects of both BWT and 1[CO23−] on Mg/Ca (Fig. 6d). In the lower BWT range (i.e. less than ∼5◦C), modern1[CO23−] is relatively constant (∼10 µmol kg−1),
al-lowing the effect of BWT to be evaluated. At these temper-atures, the correlation is weaker but still statistically signifi-cant (R2 =0.53,p< 0.0001, Fig. 6e), yielding the following equation:
Mg/Ca=0.10 (±0.02) BWT+0.79 (±0.07)
(R2=0.53, p <0.0001). (4)
The standard deviation of the difference between the cal-culated and CTD temperature is ±0.96◦C (1σ). The slope of this relationship is more gradual than that in the wide BWT range, suggesting that the carbonate ion acts to amplify BWT sensitivity owing to the positive relation-ship between BWT and 1[CO23−]. 1[CO23−] sensitivity at BWTs below ∼5◦C, where previous studies have reported higher 1[CO23−] sensitivity (< 25 µmol kg−1) (Elderfield et
al., 2006; Yu and Elderfield, 2008), could not be evalu-ated in our study, because the variation range of the mod-ern 1[CO23−] is narrow at these BWTs (Fig. 6f). Although the sensitivity of 0.10 mmol mol−1per◦C is slightly higher than that for C. wuellerstorfiwith the 1[CO23−] correction of Yu and Elderfield (2008) (0.03–0.07 mmol mol−1per◦C), it is close to the sensitivity forUvigerinaspp. in the Pacific
(0.10 mmol mol−1per◦C), which is little affected by bottom water carbonate saturation because of its infaunal habitat (El-derfield et al., 2012).
For comparison with previous calibrations, all of the pub-lished Mg/Ca data forC. wuellerstorfiare plotted (Fig. 7a). Many of the data were obtained from the Atlantic but were limited in terms of their temperature range (i.e. less than ∼6◦C), with fewer data from the Pacific and other ocean basins (Table 3). The temperature range was extended to 8.7◦C in the Pacific using a data set from Rathburn and De Decker (1997), in which neither oxidative nor reductive cleaning steps had been conducted. Most of the published Mg/Ca data are scattered primarily around one linear line (∼0.3 mmol mol−1 per◦C), except for those from the Nor-wegian Sea, which has very low BWT and high bottom water
1[CO23−] (Yu and Elderfield, 2008). Our Mg/Ca data de-viate from previous data at higher temperatures (i.e. greater than∼4–5◦C), and typically exhibit lower values than the data from both the Atlantic and Pacific.
Differences in cleaning procedure must be considered, because incorporation of a cleaning step without oxidative or reductive steps sometimes increases Mg/Ca values by more than∼1 mmol mol−1 (Barker et al., 2003). The Pa-cific Mg/Ca data from Rathburn and De Decker (1997) were produced with a cleaning step without oxidative or reductive steps, and those from Martin et al. (2002), which were orig-inally from Rosenthal et al. (1997), were cleaned with both steps. Nevertheless, Rathburn and De Decker’s data appear to follow a linear fitting line and agree with the data of Martin et al. (2002); thus, these values do not appear to have been increased by the different cleaning procedure. In addition, the difference in obtained Mg/Ca between the oxidative and reductive methods is relatively small (∼0.09 mmol mol−1)
(Yu and Elderfield, 2008). Therefore, the lowest sensitivity of Mg/Ca to temperature does not appear to be caused by differences in cleaning protocols. This sensitivity difference can be attributed in part, but not wholly, to the carbonate ion effect, as discussed below. At 1200 m depth, the total alka-linity (TA) and DIC exhibit substantial south–north gradi-ents in the Pacific (Key et al., 2004). The 1200 m DIC gra-dients are greater than those for TA, reflecting lower [CO23−] (1[CO23−]) in the high- and mid-latitude North Pacific than in the equatorial and South Pacific ([CO23−]∼TA–DIC). The higher Mg/Ca in the Coral Sea (Rathburn and De Decker, 1997) and Ontong Java Plateau (Martin et al., 2002) may be explained partly by their higher1[CO23−] than those in the western subtropical North Pacific.
To investigate the relationship between Mg/Ca and
1[CO23−] in greater detail, our Mg/Ca data together with previously published data are plotted in Fig. 7b. Four pre-vious studies have presented1[CO23−] values together with their Mg/Ca values (Elderfield et al., 2006; Yu and Elder-field, 2008; Raitzsch et al., 2008; Tisserand et al., 2013). Of these, the Mg/Ca values from Tisserand et al. (2013) appear
812
Y
.
K
ubota
et
al.:
Bottom
w
ater
var
iability
from
26
kyr
BP
to
present
based
on
Mg
/
Ca
Table 3.Published Mg/Ca data from various oceans. Reduction: cleaning protocol including reductive and oxidative steps. Oxidation: cleaning protocol including only oxidative step.
Leaching: only sonication and leaching were conducted. Sonication: only sonication was conducted.
Species References Ocean Number Cleaning/measurement Temperature 1[CO23−] Remarks
of data method range range
(◦C) (µmol kg−1)
C. wuellerstorfi Russell et al. (1994) Atlantic, Pacific 11, 4 Reduction 1.7–2.8 −
(P. wuellerstorfi)
Rosenthal et al. (1997) Atlantic 3 Leaching 2.3–2.5 −
Rathburn and De Decker (1997) Pacific 45 Sonication 2.7–8.7 −
Billups and Schrag (2002) Pacific 1 Oxidation 1.6 −
Lear et al. (2002) Atlantic, Pacific 6,10 Reduction 1.8–4.3 −
Martin et al. (2002) Atlantic, Pacific 26, 13 Reduction −1.1–3 − Unpublished data by
Rothernthal et al. are included.
Healey et al. (2008) Atlantic, Indian Ocean, 22, 7, 4 Reduction 0.8–3.8 –
South China Sea
Raitzsch et al. (2008) Atlantic 44 Laser ablation 0.4–3.7 92–128
measurement
Yu and Elderfield (2008) Atlantic, Indian Ocean, 94, 10, 28, 23 Oxidation/reduction −1.1–4.4 −23–61
including Elderfield et al. (2006) Norwegian Sea, Pacific
Tisserand et al. (2013) Atlantic 34 Oxidation 4.1–6.6 33-38
C. wuellerstorfi This study Pacific 28 Reduction 1.7–16.3 7–125
(P. wuellerstorfi) type B
C. pachyderma Rathburn and De Decker (1997) Pacific 2 Sonication 3.0–4.0 −
(C. floridanus)
Rosenthal et al. (1997) Atlantic 20 Leaching 4.5–18.4 −
Lear et al. (2002) Atlantic, Pacific 13, 4 Reduction 2.4–18.4 −
Marchitto et al. (2007) Atlantic 29 Reduction 5.8–18.6 46–161
Clim.
P
ast,
11,
803–824,
2015
www
Y. Kubota et al.: Bottom water variability from 26 kyr BP to present based on Mg/Ca 813 Billups_PAC Lear_ATL Lear_PAC Healey_ATL Martin_PAC Martin_ATL Rosenthal_ATL Raitzsch_ATL Rathburn_PAC Russell_PAC Russell_ATL Tisserand_ATL Yu_ATL Yu_IND Yu_NOR Yu_PAC Healey_SCS Healey_IND Raitzsch_ATL Tisserand_ATL Yu_ATL Yu_IND Yu_NOR Yu_PAC Lear_PAC Lear_ATL Marchitto_ATL Rosenthal_ATL Marchitto_ATL Marchitto_ATL 0.5 1 1.5 2 2.5 3 3.5 4
0 5 10 15
This study
BWT (ºC)
Mg/Ca = 0.66 + 0.14 BWT Mg/Ca = 0.51 + 0.33 BWT
R 2= 0.65
-5 0 5 10 15 20
-50 0 50 100 150
BWT (ºC)
BWT (ºC)
Δ[CO 3
2-] (
μmol/kg) b a e c f
Mg/Ca = 0.94 + 0.014 Δ[CO32-]
R 2= 0.75
0.5 1 1.5 2 2.5 3 3.5 4
-50 0 50 100 150
This study Mg/Ca (mmol/mol) Mg/Ca (mmol/mol) Mg/Ca (mmol/mol) Mg/Ca (mmol/mol)
Δ [CO 3
2-] (
μmol/kg)
Mg/Ca = 0.88 + 0.016 Δ[CO3
2-]
R2 = 0.87
0 2 4 6 8 10
0 5 10 15 20
This study BWT (ºC) d 0.5 1 1.5 2 2.5 3 3.5
0 50 100 150 200
This study
Δ[CO 3
2-] (
μmol/kg) 0 5 10 15 20
0 50 100 150 200
This study
Δ[CO 3
2- ] (
μmol/kg)
Figure 7.Comparison to previous Mg/Ca data. Mg/Ca values ofC. wuellerstorfiincluding type B vs. (a) BWT and (b) [1CO23−]. (c)
and (f) BWT vs. [1CO23−] in the different ocean basins. Mg/Ca values ofC. wuellerstorfitype B andC. pachydermavs. (d) BWT and (e)
[1CO23−]. All the data presented here are listed in Table 3. ATL: Atlantic, PAC: Pacific, IND: Indian Ocean, NOR: Norwegian Sea, SCS:
South China Sea.
to deviate from the other data. Excluding data from Tisserand et al. (2013), there is a positive correlation (R2=0.75) be-tween BWT and1[CO23−] over a wide range (Eq. 5).
Mg/Ca=0.014 (±0.0005)1[CO23−] + 0.94 (±0.018)
(R2=0.75, p<0.0001) (5)
The sensitivity of Mg/Ca to 1[CO23−] of our study (0.014–0.016 mmol mol−1 per µmol kg−1) is considerably
higher than the 0.0083–0.010 mmol mol−1per µmol kg−1
re-ported by previous studies (Elderfield et al., 2006; Healey et al., 2008; Raitzsch et al., 2008; Yu and Elderfield, 2008). This might be due to a steeper temperature rise vs.1[CO23−] in the subtropical northwestern Pacific than in other regions (Fig. 7c).
Yu and Elderfield (2008) concluded that considering
1[CO23−] provided a satisfactory explanation for differences in the absolute Mg/Ca values ofC. wuellerstorfiamong
dif-ferent oceanic basins. In their study, the Mg/Ca sensitivity to temperature decreases to 0.03–0.07 mmol mol−1 per ◦C when the1[CO23−] effect is taken into account. In contrast, Tisserand et al. (2013) demonstrated a very high Mg/Ca de-pendence on temperature (19 % increase per◦C), even when the1[CO23−] effect may be negligible (Fig. 7a, c). That is, the slope of Mg/Ca to temperature could change depending on1[CO23−], even among same species. As mentioned by Marchitto et al. (2007), benthic foraminifera tend to incorpo-rate less Mg/Ca when calcifying in both undersaturated and very supersaturated conditions. For the undersaturated con-dition, Yu and Elderfield (2008) suggested the possible exis-tence of a1[CO23−] threshold for changes inC. wuellerstorfi Mg/Ca at 25 µmol kg−1: when1[CO2−
3 ] is < 25 µmol kg −1, C. wuellerstorfiMg/Ca seems to be less sensitive to tem-perature changes. However, the Mg/Ca dependence in the supersaturated condition cannot be evaluated due to the lack of a larger data set extending into supersaturated waters for
814 Y. Kubota et al.: Bottom water variability from 26 kyr BP to present based on Mg/Ca
C. wuellerstorfi. In addition, we cannot exclude the possi-bility that differences inC. wuellerstorfi types might affect Mg/Ca dependence through physiological differences.
It is interesting to provide a comparison between our Mg/Ca of C. wuellerstorfi type B and that of C. pachy-derma. AmongCibicidoidesspecies, Mg/Ca of C. pachy-derma in the Florida Strait from Marchitto et al. (2007) fits well with our Mg/Ca of C. wuellerstorfi type B in Mg/Ca–BWT plots (Fig. 7d). The Mg/Ca data of Mar-chitto et al. (2007) are also in good agreement with our Mg/Ca data in the corresponding Mg/Ca-1[CO23−] plot but more scattered (Fig. 7e). An overlapping variation pat-tern of BWT vs. 1[CO23−] could lead to the similarity in Mg/Ca values between C. wuellerstorfi B and C. pachy-derma(Fig. 7f). Alternatively, one might argue that the sim-ilarity results from their common habitat or physiological characteristics. For example, Raitzsch et al. (2008) argued that interspecies differences in microhabitat might explain Mg/Ca differences. TypicalC. wuellerstorfiprefers an ele-vated position above the sediment–water interface (Lutze and Thiel, 1989), whileC. pachyderma, similar toC. mundulus, lives at deeper depths but within the sediment–water inter-face (Rathburn and Corliss, 1994). Although our knowledge of the ecology ofC. wuellerstorfitype B remains very poor, C. wuellerstorfi type B might be less affected by the water carbonate saturation state of the bottom water than typical C. wuellerstorfi if it lives at deeper depths than typical C. wuellerstorfi.
6 Downcore results
6.1 Benthic Mg/Ca
The Mg/Ca values for GH08-2004 vary between 0.61 and 1.36 mmol mol−1 for the last 26 kyr (Fig. 8a). Mg/Ca
was relatively high at 25 kyr BP, possibly coinciding with Heinrich event 2 (H2). Mg/Ca exhibits values of 0.83 mmol mol−1, on average, during the LGM (18– 22 kyr BP). For the last deglaciation, the Mg/Ca record ex-hibits a high peak at 17 kyr BP, likely coinciding with H1. Mg/Ca began to decrease by∼0.3 mmol mol−1from 17 to 14 kyr BP, and subsequently increased by∼0.5 mmol mol−1 toward 11.5 kyr BP. Another high peak at 11.5 kyr BP seems to coincide with YD, although only a single data point sup-ports the peak. Holocene Mg/Ca appears highly variable, ranging between ∼0.8 and∼1.2 mmol mol−1at the
multi-millennial scale, with high peaks at 10.5, 8.2, and 5.3– 5.6 kyr BP and low peaks at 9.6, 6.5, and 2.3 kyr BP.
6.1.1 Evaluation of carbonate saturation effect on Mg/Ca
It seems that the carbonate saturation state has not remained constant since the last glacial period (Yu et al., 2014). Al-though the core site is located well above the carbonate lysocline depth (∼3500 m in the western tropical Pacific; Broecker and Peng, 1982), the potential effect of1[CO23−] should be evaluated when interpreting the downcore Mg/Ca record. In order to estimate the carbonate ion effect on the temporal Mg/Ca changes, we present another proxy, an in-dex usingG. menardiifragmentation, which can reflect the carbonate saturation state; however, this is a qualitative mea-sure. Tests of the planktic foraminiferaG. menardiiare sen-sitive to carbonate dissolution, and attrition ofG. menardii tests correlates well with the fraction of calcite dissolved (Ku and Oba, 1978; Mekik et al., 2002). All specimens of G. menardii were picked from an assemblage sample, and the numbers of the following specimens were counted: (a) undamaged specimens; (b) almost whole specimens, or those with more than half of the original specimen remain-ing; (c) specimens with less than half remainremain-ing; and (d) fragments of keels only (Mekik et al., 2002). Then, theG. menardiifragmentation index (MFI: Mekik et al., 2002) was calculated according to the following equation of Mekik et al. (2002):
MFI=(b+(c/3)+d/5)/(a+b+(c/3)+d/5). (6)
The MFI record of GH08-2004 is exhibited together with the percentage of perfect tests (Fig. 8b), indicating gener-ally better carbonate preservation during glacial times than during the Holocene. This may be related to the higher car-bonate saturation state at water depths less than∼2 km dur-ing glacial time, possibly due to lower atmospheric CO2
concentrations (e.g. Bertram et al., 1995). During the last deglaciation, the temporal variation in carbonate preserva-tion state does not correlate with Mg/Ca (Fig. 8). There is no correlation between the benthic Mg/Ca and % dissolu-tion (R=0.052,p=0.754), suggesting that carbonate satu-ration state is unlikely to affect Mg/Ca.
For planktic foraminiferal Mg/Ca, post-depositional car-bonate dissolution decreases Mg/Ca at low saturation level (bottom water1[CO23−] < 30 µmol kg−1) (Regenberg et al.,
2014). However, this is the case for planktic foraminifers but not benthic foraminifers; that is, the post-depositional disso-lution effect on Mg/Ca is negligible for benthic foraminifers (Lear et al., 2002; Elderfield et al., 2006).
6.1.2 Conversion of foraminiferal Mg/Ca to temperature
As described in Sect. 5, we report the Mg/Ca–BWT con-version equations depending on the two temperature ranges. Eqs. (1) and (2) contain the effect of the carbonate ion com-ponent, while this component can be negligible in Eq. (4).
Y. Kubota et al.: Bottom water variability from 26 kyr BP to present based on Mg/Ca 815
0 5 10 15 20 25 30
2
2.5
3
3.5
4
Age (kyr BP)
-0.1 0 0.1 0.2 0.3 0.4 0.5 MFI 0.6 0.8 1 1.2 1.4 Mg/Ca (mmol/mol) 50 60 70 80 90 100 110 -0.2 -0.1 0 0.1 0.2 0.3 0.4
Perfect test %
δ
1
8O (‰, PDB)
δ
1
3C (‰, PDB)
type A type B a b c d H1 H2 B/A YD
Figure 8.(a)Mg/Ca,(b)perfect test % (in black) and MFI (in
blue),(c)δ18Oc (original values), and(d)δ13Cc(original values)
vs. calendar age for GH08-2004.(c, d)Filled red circles represent
δ18Ocandδ13Ccdata fromC. wuellerstorfitype A, and open
cir-cles representC. wuellerstorfitype B. H1, B/A, and YD represent
Heinrich 1, Bølling–Allerød, and Younger Dryas intervals. The bold
line in(a)indicates three-point running mean. Analytical errors are
expressed as bars.
Moreover, the modern BWT of the core site is 3.0◦C, which is within the range of Eq. (4), and most of the downcore Mg/Ca values were lower than the core-top value. There-fore, Eq. (4) can be regarded as more appropriate for conver-sion of the downcore Mg/Ca record. The Mg/Ca values of core GH08-2004 were converted to temperature by the linear fitting using Eq. (4), because little difference is seen between the linear fitting and exponential fitting (Fig. 6e).
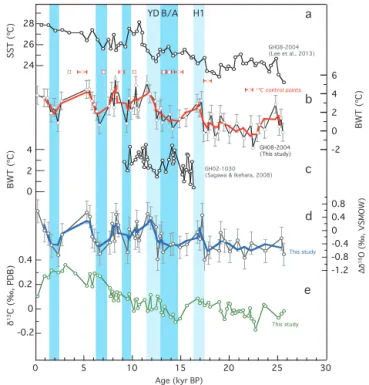
6.1.3 BWT variation
Average BWT during the LGM was found to be 0.4±1.0◦C; thus, BWT during the LGM was ∼2.6◦C lower than to-day (Fig. 9b). Subsequently, BWT increased by 2.5–3◦C at 17 kyr BP, then exhibited a decreasing trend (by ∼2◦C overall) toward B/A. BWT appears to have increased again at about 12.5 kyr BP during YD. During the Holocene, BWT was highly variable, with variability of±1.4◦C (1σ). The bottom water was warmer at 11.5, 8.2–8.4, and 5.3– 5.6 kyr BP, and was cooler at∼9.3,∼6.5, and∼2.3 kyr BP.
0 2 4 24 26 28 -2 0 2 4 6
0 5 10 15 20 25 30
-1.2 -0.8 -0.4 0 0.4 0.8 -0.2 0 0.2 0.4 H1 B/A YD GH08-2004 (This study) GH08-2004 (Lee et al., 2013)
GH02-1030 (Sagawa & Ikehara, 2008)
This study
This study
14C control points
a b c d e SST (ºC) BWT (ºC) BWT (ºC) δ 1
3C (‰, PDB)
Δδ
1
8O (‰, VSMOW)
Age (kyr BP)
Figure 9.(a)Sea surface temperature (SST) derived from Mg/Ca
of the planktic foraminiferaG. ruberof core GH08-2004 (Lee et
al., 2013),(b) bottom water temperature (BWT) of core
GH08-2004 (this study),(c)Mg/Ca-derived BWT ofU. akitaensisof core
GH02-1030, 1212 m water depth in the subarctic western North
Pa-cific (Sagawa and Ikehara, 2008), and(d)localδ18Ow(1δ18Ow)
and(e)benthicδ13C of GH08-2004 (this study). Bold lines
indi-cate three-point running mean in(b)and(d). The±1◦C errors and
propagated errors are expressed as error bars in(b)and(d).
6.2 Benthicδ18
O and conversion to localδ18
O of seawater
For a best estimate of oxygen isotopic equilibrium, adjust-ment is needed for some benthic species, and is estimated to be+0.64 ‰ forC. wuellerstorfi(Shackleton et al., 1984). The difference inδ18OcbetweenC. wuellerstorfitype A and
type B (δ18Oc(typeB−A)) is+0.081±0.19 (1σ) ‰ (n=25),
which is larger than the analytical error. Thus, we applied the adjustment factor of +0.56 ‰ (=0.64−0.081) forC. wuellerstorfitype B.
The δ18Oc from core GH08-2004 exhibits a glacial
transition, and has gradually decreased from ∼4.0 to ∼2.5 ‰ from the LGM to the present (Fig. 8c). The 1.5 ‰ difference inδ18Ocbetween the LGM and the present
is 0.4–0.5 ‰ larger than that expected based on the global ice volume effect (Schrag et al., 2002). We used the palaeotem-perature equation of Shackleton (1974) to compute variations inδ18O of bottom water (δ18Ow). Theδ18Owwas obtained in
the PDB scale and converted to the VSMOW scale as follows (δ18Ow(VSMOW)=δ18Ow(PDB)+0.27 ‰; Hut, 1987):
T=16.9−4.38 (δ18Oc−δ18Ow) + 0.10 (δ18Oc−δ18Ow)2. (7)
816 Y. Kubota et al.: Bottom water variability from 26 kyr BP to present based on Mg/Ca
Subsequently, the ice volume offset (Waelbroeck et al., 2002) was subtracted from δ18Ow, yielding a local δ18Ow
(1δ18Ow) (Fig. 9d). Eventually, ±0.34 ‰ of 1δ18Ow
er-ror is derived based on adding the erer-ror for the ice vol-ume offset (±0.1 ‰) to±0.24 ‰ (1σ), which is the prop-agated error of δ18Ow from BWT reconstruction when a
BWT error of ±0.96◦C is applied (0.25 ‰ per 1◦C). A core top yields1δ18Owof 0.57 ‰, which is∼0.9 ‰ higher
than that expected in equilibrium with ambient water (−0.3 to −0.4 ‰, Suzuki et al., 2010). Even assuming a mod-ern δ18Ow value of −0.13 ‰±0.03 (1σ, n=91), which
is an average value for 1000–2000 m water depth in the northwestern Pacific (120–180◦E, 20–60◦N; Schmidt et al., 1999), the difference is still large (∼0.7 ‰). Considering that
δ18Oc of C. wuellerstorfi type B increases by ∼0.5 ‰ in
the youngest horizon (core top) and exhibits a large dif-ference from the δ18Oc value of C. wuellerstorfi type A,
we prefer not to rely on the core-top value. Middle to late Holocene average 1δ18Ow, including the core top, is −0.09±0.39 ‰(1σ,n=8), which approaches the modern
δ18Ow value of ambient seawater. Average 1δ18Ow during
the LGM was−0.5±0.1 ‰, which is 0.4 ‰ lower than the middle to late Holocene average. In general, 1δ18Ow
ex-hibits a negative correlation with BWT (Fig. 9). The vari-ability of 1δ18Ow is±0.41 ‰ (1σ) throughout the record.
Compared to the Mg/Ca results, higher 1δ18Ow intervals
at 17, 11.5, 8.2–8.4, and 5.3–5.6 kyr BP basically coincided with warmer BWT peaks, while lower1δ18Ow intervals at
17.5, 12.5, 6.5, and 2.3 kyr BP coincided with cooler BWT peaks (Fig. 9).
6.3 δ13
C variations
The δ13C of epifaunal benthic foraminifera living at the bottom water–surface sediment interface was used to esti-mate changes in water massδ13CDICcomposition, and Cibi-cidoides reflect δ13CDIC in ambient water with a defined
genera- or species-dependent offset inδ13Cc(Graham et al.,
1981; McCorkle et al., 1990, 1997). The δ13Cc offset is
zero for C. wuellerstorfi, and the difference between type A and type B (1δ13Cc (typeB−A)) is 0.03±0.10 ‰ (n=25).
Although this is not significant compared to analytical er-ror, an adjustment factor of −0.03 ‰ was applied for the
δ13Ccrecord ofC. wuellerstorfitype B. The middle to late
Holocene averageδ13Ccis 0.28 ‰ (n=8), which is within
the modern range of δ13CDIC at 1000–2000 m water depth
at 0–20◦N (−0.25 to+0.25 ‰, Bostock et al., 2010), when the analytical error is considered. Downcore benthic δ13Cc
exhibits lower values for the LGM section, with low peaks at 22.5 and 19.5 kyr BP (Fig. 8d). Averageδ13Ccduring the
LGM was∼0.29 ‰ lower than the middle to late Holocene average. A shift in δ13Cc from 17 to 14.5 kyr BP was in
accordance with the gradual decrease in BWT. The δ13Cc
then shifted to higher values at 13 kyr BP, coinciding with the beginning of YD. During the Holocene, δ13Cc shifted
by approximately 0.2 ‰ during the time interval from 8 to 7 kyr BP, and decreased from 3 kyr BP to present.
7 Discussion
7.1 The Last Glacial Maximum
During the last glacial period, a water mass corresponding to the modern NPIW is thought to have been thicker and to have penetrated more deeply into the North Pacific (Mat-sumoto et al., 2002). In contrast, recent studies reveal that the deep ocean at the LGM was poorly ventilated, based on older benthic14C ages (Rae et al., 2014). These deep waters were isolated from the atmosphere, accumulating DIC effectively (Sarnthein et al., 2013). Without a drop in the deep North Pa-cific pH, the increase in alkalinity acted to buffer such an in-crease in DIC storage (Rae et al., 2014). Our MFI record sug-gests the better preservation of CaCO3during the LGM,
sup-porting the higher pH. Theδ13Ccrecord exhibits lower
val-ues during the LGM than at present, consistent withδ13C dis-tribution compiled by Schmittner (2012) for the LGM. The surface productivity might have increased during the LGM, as inferred by an increase in total organic carbon in GH08-2004 during this period (Amano and Itaki, 2015), and the subsequent increased remineralisation would have decreased
δ13Cc.
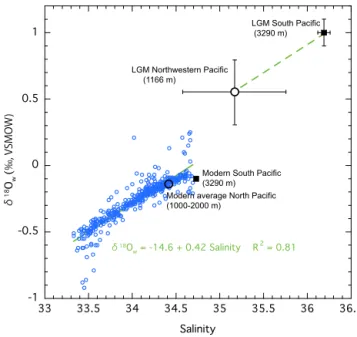
The average δ18Ow during the LGM (18–22 kyr BP) is ∼0.5 ‰ lower than a previously reconstructedδ18Owvalue
of deep water (3290 m) in the South Pacific (Adkins et al., 2002). The modern δ18Ow–salinity relationship at depths
greater than 300 m isδ18Ow=0.42 salinity−14.6 in the area
between 120 and 180◦E and 20 and 60◦N in the North Pa-cific (R2=0.81) (Fig. 10, data from Schmidt et al., 1999). A modern deep water value of salinity andδ18Owin the South
Pacific (Adkins et al., 2002) plots near an end member in the
δ18Ow–salinity diagram of the Fig. 10, indicating a quite
ho-mogeneous distribution ofδ18Owin the modern deep Pacific.
This is also indicative of the simple mixing between higher salinity (higherδ18Ow) water from the south and lower
salin-ity (lowerδ18Ow) of NPIW in the North Pacific. The LGM
intermediate δ18Ow in the northwestern Pacific was much
lower than that in the South Pacific. The difference inδ18Ow
between intermediate northwestern Pacific and South Pacific during the LGM was∼0.4 ‰, much larger than at present (less than 0.1 ‰). Exceeding the propagated error range of
δ18Owreconstruction, the increase in thisδ18Ow difference
during the LGM seems probable. Given that the δ18Ow–
salinity relationship during the LGM was likely similar to to-day, as suggested by a coupled climate model (Roche et al., 2004), the salinity difference between the two regions was greater during the LGM than at present. Applying the mod-ern slope ofδ18Owto salinity (2002) yields 35.17±0.57 for
the LGM bottom water salinity at site GH08-2004. Accord-ing to Adkins et al. (2002), by calculatAccord-ing a salt mass balance, the mean Pacific salinity was estimated to be 35.90 during
Y. Kubota et al.: Bottom water variability from 26 kyr BP to present based on Mg/Ca 817
the LGM. However, this value is too low compared with the reconstructed deep water salinity of 36.19 in the South Pa-cific, implying the existence of a mass of low-salinity water in the North Pacific (Adkins et al., 2002). Our study provides evidence to support this implication. As for the Pacific den-sity distribution during the LGM, the temperature gradient between the intermediate North Pacific and the deep South Pacific (Adkins et al., 2002) was similar to current values, but the salinity gradient was greater (∼1 in salinity) than at present (∼0.2–0.3 in salinity). Therefore, the intermediate– deep vertical density gradient was greater in the Pacific dur-ing the LGM than at present. This density structure would lead to stratification, suppressing the mixing between deep and intermediate waters in the Pacific. The stratified ocean would be favourable carbon storage in the deep Pacific.
7.2 The last deglaciation
During H1, the greater production and the deeper penetration of NPIW were suggested by the modelling study of Okazaki et al. (2010). The main source area of NPIW likely shifted to the Bering Sea from the Okhotsk Sea (Ohkushi et al., 2003; Horikawa et al., 2010; Rella et al., 2012) and spread south to the California margin in the eastern North Pacific (e.g. Keigwin and Jones, 1990; Behl and Kennett, 1996; Tada et al., 2000; Hendy and Pedersen, 2005). Although Jaccard and Galbraith (2013) argued that the well-ventilated waters pen-etrated to at most 1400–2400 m depth during H1, recent ben-thic and planktic 14C data provide evidence that the deep North Pacific, at least 3400 m water depth, was well venti-lated from 17.3 to 16 kyr BP (Rea et al., 2014). Despite the data discrepancy regarding the penetration depth, there is a common view that at least the upper 1400 m of water was filled by well-ventilated NPIW in the subarctic North Pa-cific during H1, trigged by an increase in surface density, which resulted from salinity increase promoted by a positive-salinity feedback (Okazaki et al., 2010).
The bottom water warming at 17 kyr BP in GH08-2004 seems to coincide with the time at which well-ventilated NPIW started to fill the intermediate depths in the subarc-tic North Pacific. Recent modelling results based on both an earth model of intermediate complexity, LOVECLIM, and a coupled general circulation model, MIROC, simulated inter-mediate (∼300–1200 m) warming in the Pacific Basin be-tween∼30◦N and∼30◦S as a result of reduced upwelling of cooler water from the abyssal Pacific, related to a de-crease in the return flow of PDW during H1 (Chikamoto et al., 2012). The bottom water warming at 17 kyr BP could be explained by a lesser contribution of PDW and greater con-tribution of NPIW in the subtropical northwestern Pacific.
At present, the bottom water of the site is influenced both by NPIW, which intrudes directly from the northeastern side of the basin (∼20–26◦N), and by the waters flowing from the southeastern edge of the basin (∼9–15◦N). Because the waters from the southeastern side enter at deeper depth
-1 -0.5 0 0.5 1
33 33.5 34 34.5 35 35.5 36 36.5
δ18O
w = -14.6 + 0.42 Salinity R
2
= 0.81
δ
1
8O
w
(
‰, VSMOW
)
Salinity
Modern South Pacific (3290 m) LGM Northwestern Pacific (1166 m)
LGM South Pacific (3290 m)
Modern average North Pacific (1000-2000 m)
Figure 10. The modern δ18Ow–salinity relationship at depths
greater than 300 m isδ18Ow=0.42 salinity−14.6 in the area
be-tween 120 and 180◦E and 20 and 60◦N in the North Pacific (data
from Schmidt et al., 1999). The deep water (3290 m water depth)
values of salinity andδ18Owat present and at the LGM in the South
Pacific (Adkins et al., 2002) are represented by black squares. The open circles represent the modern average value in the North Pacific (1000–2000 m water depth) and the estimated LGM of the study site in the northwestern Pacific.
(∼1500 m), today these waters are mainly from PDW, with a minor contribution of NPIW (Kaneko et al., 2001). In the case of 17 kyr BP, it seems feasible that the contribution of PDW at site GH08-2004 decreased through reduced inflow from the southeastern edge of the basin, and NPIW inflow along the northeastern edge increased. The greater produc-tion of NPIW might suppress upwelling of PDW; as a conse-quence, depths at which the PDW returned southward would shift to deeper depths (Matsumoto et al., 2002; Jaccard and Galbraith, 2013).
However, these changes in waters are not clear in our
δ13Cc record, which shows little change between the LGM
and H1. Local primary productivity does not seem to explain the lack of the change inδ13Cc, because primary
productiv-ity at this site seems to be suppressed, based on the reduced carbon mass accumulation rate (Amano and Itaki, 2015).
At 17 kyr BP, it was necessary for more heat and saline water to be transported to the high latitudes in the North Pa-cific to form more dense waters (Okazaki et al., 2010). A planktic foraminiferal Mg/Ca record shows∼1◦C rise in SST in the same core during H1 (Lee et al., 2013), which appears to coincide with BWT increase. The increase in the benthic1δ18Owin association with the bottom water
warm-ing at 17 kyr BP in core GH08-2004 is consistent with de-crease in precipitation in the North Pacific in response to duced moisture transport from the equatorial Atlantic as a