Development of Gel-Filter Method for High
Enrichment of Low-Molecular Weight
Proteins from Serum
Lingsheng Chen1,2, Linhui Zhai1, Yanchang Li1, Ning Li1, Chengpu Zhang1, Lingyan Ping1, Lei Chang1, Junzhu Wu3, Xiangping Li2, Deshun Shi2*, Ping Xu1,4*
1State Key Laboratory of Proteomics, National Engineering Research Center for Protein Drugs, Beijing Proteome Research Center, National Center for Protein Sciences, Beijing Institute of Radiation Medicine, Beijing, 102206, P. R. China,2State Key Laboratory for Conservation and Utilization of Subtropical Agro-Bioresources, Guangxi University, Nanning, 530005, P. R. China,3Department of Biochemistry, School of Medicine, Wuhan University, Wuhan, 430071, P. R. China,4Key Laboratory of Combinatorial Biosynthesis and Drug Discovery (Wuhan University), Ministry of Education, and Wuhan University School of
Pharmaceutical Sciences, Wuhan, 430071, P. R. China
*[email protected](DSS);[email protected](PX)
Abstract
The human serum proteome has been extensively screened for biomarkers. However, the large dynamic range of protein concentrations in serum and the presence of highly abun-dant and large molecular weight proteins, make identification and detection changes in the amount of low-molecular weight proteins (LMW, molecular weight30kDa) difficult. Here, we developed a gel-filter method including four layers of different concentration of tricine SDS-PAGE-based gels to block high-molecular weight proteins and enrich LMW proteins. By utilizing this method, we identified 1,576 proteins (n = 2) from 10μL serum. Among them, 559 (n = 2) proteins belonged to LMW proteins. Furthermore, this gel-filter method could identify 67.4% and 39.8% more LMW proteins than that in representative methods of gly-cine SDS-PAGE and optimized-DS, respectively. By utilizing SILAC-AQUA approach with labeled recombinant protein as internal standard, the recovery rate for GST spiked in serum during the treatment of gel-filter, optimized-DS, and ProteoMiner was 33.1±0.01%, 18.7±
0.01% and 9.6±0.03%, respectively. These results demonstrate that the gel-filter method
offers a rapid, highly reproducible and efficient approach for screening biomarkers from serum through proteomic analyses.
Introduction
Serum contains a highly complex mixture of proteins/peptides secreted from tissues and or-gans throughout the body, which systemically reflects the physiological or pathological states of a living organism [1]. Identification and quantitation of these proteins/peptides can provide valuable information for diagnosis and prognosis in health care [2,3].
OPEN ACCESS
Citation:Chen L, Zhai L, Li Y, Li N, Zhang C, Ping L, et al. (2015) Development of Gel-Filter Method for High Enrichment of Low-Molecular Weight Proteins from Serum. PLoS ONE 10(2): e0115862. doi:10.1371/journal.pone.0115862
Academic Editor:Andy T. Y. Lau, Shantou University Medical College, CHINA
Received:June 29, 2014
Accepted:December 2, 2014
Published:February 27, 2015
Copyright:© 2015 Chen et al. This is an open access article distributed under the terms of the
Creative Commons Attribution License, which permits unrestricted use, distribution, and reproduction in any medium, provided the original author and source are credited.
Data Availability Statement:All raw files are available from the iProx database (accession number
(s) reviewer132, d3d1gya2 (http://www.iprox.org/).
Funding:This work was supported by: 1. Chinese National Basic Research Programs, Grant
No.2011CB910600 & 2013CB911201,http://www.
973.gov.cn/English/Index.aspx. 2. National Natural Science Foundation of China, Grant No.31070673 &
31170780,http://www.nsfc.gov.cn/publish/portal1/. 3.
National High-Tech Research and Development Program of China, Grant No.SS2012AA020502 &
2011AA02A114,http://www.most.gov.cn/eng/
In the past decade, mass spectrometry (MS) has been developed as a proteomics platform for the sequencing and screening of potential disease-related biomarkers by comparing serum samples from healthy individuals and patients [4]. However, proteomic characterization using MS is challenging, because the dynamic range of proteins/peptides in serum is about 2–3 orders of magnitude broader (1010*11) than that in regular samples, and higher abundant peptides/
proteins are preferentially sequenced by MS [5,6]. In addition, there are 22 abundant and well-characterized proteins in serum, including albumin, immunoglobulin, fibrinogen, alpha 1-anti-trypsin, alpha 2-macroglobulin, which together represent 99% of total serum protein [7,8]. Some proteins, such as albumin, can even reach concentrations of 35–50 mg/mL in serum [9]. The remaining 1% of the other protein component in serum is composed of thousands of low-abundance and low-molecular weight (LMW, MW30 kDa) proteins/peptides, including peptide hormones, cytokines, growth factors, as well as proteins/peptides originating from nor-mal cell or tissue leakage as a result of cell death or damages and proteolytic fragments of larger proteins [9]. From a diagnostic point of view, these proteins/peptides are even more important than the abundant ones to reflect valuable disease-related information [10]. For example, the low-abundance cellular and tissue hormone leptin, with the molecular weight of 16 kDa, is sup-posedly involved in the regulation of food intake and metabolism [11]. In recent years, many researchers have shown that leptin is closely involved in the occurrence and development of diseases, such as obesity [12,13] and diabetes mellitus [14,15].
In order to analyze these low-abundance and LMW proteins in complicated serum samples, various methods have been developed in the past decade, such as ultrafiltration [8,16], organic solvent precipitation [17,18], electrophoresis [19], chromatography (on-column or on magnet-ic beads) [20–22] and affinity depletion[23]. The reduction of sample complexity is essentially the first step. However, these pre-fractionation strategies have limited efficiency in the deple-tion of highly abundant proteins (HAPs), resulting in potential loss of components through binding to the high-molecular weight (HMW) proteins and consequent unsatisfactory detec-tion of LMW proteins.
ProteoMiner, also called combinatorial solid-phase library, is one of the widely used and ef-ficient strategies for low abundant proteins by decreasing the high abundant proteins in com-plicated biological samples, such as serum[24], urine[25], platelets[26]. This combinatorial solid-phase library contains large population of beads binding with peptides with high diversi-ty, in which each bead contains millions of unique hexapeptide ligands. The HAPs have satura-tion limitasatura-tion of binding sites, whereas those remaining unbound or weakly bound proteins were washed away in the flow-through. In contrast, bindable low-abundance proteins can be enriched on their corresponding beads[27].
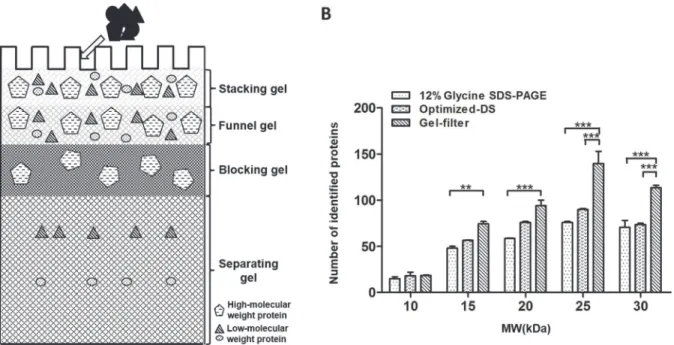
In this study, we developed a four-layer gel-filter method to block highly abundant HMW proteins and enrich low-abundance and LMW proteins (Fig. 1A). In order to determine the re-covery rate of LMW proteins after the process of different approaches, we performed LC-MS analysis by spike-in isotope-labeled protein. We could confidently identify 559 LMW proteins from 10μL of serum processed with gel-filter method, which was about 67.3% more LMW pro-teins than that from the regular SDS-PAGE approach. Interestingly, the number of identified LMW proteins from the gel-filter method was also 39.9% more than that from the optimized-DS method. In each molecular weight range bin, the number of identified proteins for gel-filter methods was the highest within three methods (Fig. 1B). More importantly, the quantitative proteomics study revealed that about 33.0% of targeted proteins could be recovered from the gel-filter process, which was about two fold or four fold higher than that in optimized-DS and ProteoMiner approaches, respectively.
National Megaprojects for Key Infectious Diseases,
Grant No.2013zx10003002,http://www.most.gov.cn/
eng/programmes1/200610/t20061008_36198.htm. 5. Key Projects in the National Science & Technology
Pillar Program, Grant No.2012BAF14B00,http://www.
most.gov.cn/eng/programmes1/200610/t20061009_ 36224.htm. 6. National Natural Science Foundation of
Beijing, Grant No. 5112012,http://www.bjnsf.org/. 7.
National Natural Science Foundation of Guangxi,
Grant No.2012GXNSFCB53002,http://gxnsf.gxsti.
net/stms/login.jsp.
Materials and Methods
Ethics Statement
The use of human serum samples for this study was reviewed and approved by the Institute of Radiation Medicine at Academy of Military Medical Sciences and Beijing Proteomics Research Center. All participants provided written informed consent (as outlined in PLOS consent form) to participate in this study.
Materials
All chemical reagents were purchased from Sigma (St. Louis, MO, USA) with analytical grade except formic acid and acetonitrile, which was high performance liquid chromatography (HPLC) grade. Trypsin was purchased from Promega (Madison, WI, USA). ProteoMiner Pro-tein Enrichment Small-Capacity kit was purchased from Bio-Rad (Hercules, CA, USA).
Human serum was obtained from six healthy volunteers (three males and three females; range from 38–80 years old, mean 61.5 ± 14.2 years) to avoid the individual variation from these serum samples. Blood was allowed to clot for 30 min at room temperature, and was then centrifuged at 1,000 × g for 15 min at room temperature to collect serum. Then, the serum from each individual donor was pooled together to save as a single sample for evaluating the features of different processing methods used in this study. The protein concentration of the pooled sample was 65μg/μL as determined by Bradford protein assay.
Regular glycine SDS-PAGE and tricine SDS-PAGE Analysis
The regular glycine SDS-PAGE and tricine SDS-PAGE preparation were described as in stan-dard protocols [28,29].
For electrophoresis analysis, the 1μL of serum sample containing 65μg proteins was diluted 1:2 ratio with 2μL of denaturing solution (8 M urea, 10 mM IAA). The sample was then Fig 1. Schematic diagram of gel-filter method and molecular weight distribution of identified LMW proteins from different methods.A. Schematic diagram for the design of four-layer gel-filter method. B. Molecular weight distribution of identified LMW proteins from the three comparison methods.
incubated at room temperature for 30 min before centrifugation at 14,000 × g for 5 min. The supernatant was diluted 4:1 ratio with SDS-PAGE loading buffer (1 M Tris-HCl, pH6.8, 10% SDS, 50% glycerol, and 1% bromphenol blue). After mixing and centrifugation at 13,800 × g for 5 min, the supernatant was transferred to a new tube and was ready for gel electrophoresis.
For regular glycine SDS-PAGE analysis, electrophoresis was carried out at a constant 80 V for 3 hours (PowerPac HC, Bio-Rad). Then the gel was briefly rinsed with ultrapure water and stained with Coomassie brilliant blue G-250. After destaining, gels were scanned with a Scanjet image system (HP Scanjet G4050). Gel images were analyzed using Scion Image (http://rsb. info.nih.gov/nihimage/).
For tricine SDS-PAGE analysis, the prepared samples were separated at a constant 30 V until they completely entered into the separating gel from the stacking gel. Then a constant 200 V was maintained until the tracking dye reached the bottom of the gel. The staining, destain-ing, and image analysis were performed as described above.
Gel-filter method preparation for LMW protein enrichment
The same glycine SDS-PAGE cassette was used for gel-filter cartridge preparation. From bot-tom to top, the gel-filter method was composed of a separating gel, blocking gel, funnel gel, and stacking gel. The concentration of separating gel was generally 10–12%. The concentration of blocking gel was 16–20%, which could be adjusted based on the size of objective proteins need to be removed. The concentration of funnel gel was 8–10%, and that for stacking gel was the same as in the standard glycine SDS-PAGE gel method.
The serum sample preparation and electrophoresis parameters for analysis were the same as described in tricine SDS-PAGE analysis.
Optimized-differential solubilization (Optimized-DS) method
Sample was prepared for the DS method in a manner similar to that described by Kawashima
et al. [30] with slight modifications. Briefly, 10μL of serum was diluted 1:2 ratio with 20μL of denaturing solution (8 M urea, 5 mM DTT) at room temperature avoiding light for 30 min, then alkylated by 20 mM IAA. After addition of 70μL of ultrapure water, the entire sample was slowly added drop-wise into 1.2 mL of ice-cold acetone, and immediately incubated at -20°C for 4 h, after which it was centrifuged at 5,000 × g for 15 min at room temperature. The precipitate was resuspended in 200μL of 70% ACN containing 12 mM hydrochloric acid and mixed at 4°C for 1 h to get the LMW proteins. The dissolved LMW protein sample was then centrifuged again at 19,000 × g for 15 min at 4°C. The proteins were lyophilized before ana-lyzed by 12% tricine SDS-PAGE as described above.
Sample preparation for ProteoMiner
The serum sample was treated with combinatorial peptide ligand library (CPLL) provided by the ProteoMiner kit according to the manufacturer’s protocol. Briefly, the column was washed three times with PBS buffer. Then 200μL of human serum containing 13 mg proteins was added to the column and incubated at room temperature for 2 h with gentle shaking. The pro-teins bound on the beads containing combinatorial peptide ligand were washed three times with PBS buffer before eluting with 20μL of elution buffer (8 M urea, 2% CHAPS) for three times. The eluted proteins were pooled together for further experiments.
Protein digestion and peptide identification
After gel electrophoresis, the specific regions in gel lanes were sliced into nine bands based on molecular weight markers. In-gel digestion, peptide extraction and desalting were performed as described previously [31–33]. The eluted peptides were dried again and dissolved with sam-ple loading buffer (1% ACN and 1% Formic acid in water) for MS analysis. The peptide identi-fication was performed on a hybrid LTQ-Orbitrap Velos mass spectrometer (Thermo Fisher Scientific, San Jose, CA) equipped with a Waters nanoACQUITY ultra-performance liquid chromatography (UPLC) system (Waters, Milford, MA) as described previously[33].
All of the three sample processing experiments were repeated three times with the same pooled serum sample to evaluate their reproducibility except for the specific description.
Determination of recovery of target protein by SILAC-AQUA approach
The protein of Glutathione-S-transferase (GST) was expressed from pGEX-4T vector in the light and heavy SILAC labeledE.coliBL21 (DE3) strain as described [34]. After completely la-beling with [13C6] lysine (+6.0201 Da), GST protein was purified using gluthatione-Sepharose beads (Qiagen, Valencia, CA) according to the manufacturer instruction. The amount of puri-fied GST was measured by standard BCA protein assay kit (Thermo Scientific, Rockford, IL) and by a Coomassie stained SDS gel as described [35].
The heavy-labeled GST was digested with trypsin and analyzed through LC-MS/MS to get the most appreciated peptides for quantification. Certain amount of human serum samples were spiked with 0.3μg of light isotope-labeled GST protein and then processed through the treatments of gel-filter, optimized-DS or ProteoMiner approaches as described above. To esti-mate the protein recovery for each individual process, the treated samples were digested with trypsin and then mixed with the same amount of heavy isotope labeled and tryptic GST pep-tides followed by nano-LC-MS/MS analysis. The same amount of heavy labeled GST peppep-tides were used as internal standards to evaluate peptide recovery. Detailed quantification method was described as previously [34].
Data processing and bioinformatics analysis
The raw data were processed with msconvert (ProteoWizard suite version 2.1.2132) using de-fault parameters. The acquired extensible markup language (XML)[36] formatted MS raw data (mzXML) were searched using the Sorcerer-SEQUEST (version 4.0.4 build, Sage-N Research, Inc.) search engine. Data were searched against the NCBIHomo sapiensprotein database (ver-sion 11232012, 35,814 protein sequences) added with 112 frequently observed contaminants (ftp://ftp.thegpm.org/fasta/cRAP/crap.fasta) and decoy sequences derived by peptide-level re-versal of all 35,926 target sequences [37]. Search parameters consisted of semitryptic restric-tion, fixed modification of Cys (+57.0215 Da, alkylation by iodoacetamide), and variable modification of oxidized Met (+15.9949 Da). Peptides with up to two missed cleavages were allowed. Mass tolerance was set to 20 ppm. Onlybandyions were considered during the data-base search.
Because different databases were used in different studies, protein ID of each datasets was converted to gene symbol ID on Uniprot web (http://www.uniprot.org/). Dataset comparison was applied on Venny web (http://bioinfogp.cnb.csic.es/tools/venny/). Protein abundance was normalized as described [39]. MS/MS spectra of peptides were extracted with p-Label [40].
ANOVA was used to determine the statistical significance of data analysis for molecular weight distribution of identified LMW proteins and protein recovery rate. All calculations were performed with Graphpad Prism software system (GraphPad San Diego, CA, USA).
Results and Discussion
Development of a novel gel-filter method for the enrichment of LMW
proteins
The human serum proteome has been extensively studied to identify protein and peptide bio-markers. However, HAPs with relative HMW in serum make the identification of low abun-dance LMW proteins through traditional approaches extremely hard. In order to retain HMW proteins and enrich for more LMW proteins for proteomics analyses, we applied a three-layer gel method as part A inS1 Fig., which was similar as described by Schaggeret al. [28] In this gel method, 5% stacking gel, 16% blocking gel and 10–12% of separating gel were included from top to bottom, respectively. When testing the gel, we found that the loaded amount of the serum sample was still limited because the HAPs with HMW passed through blocking gel and damaged separating gel (Part B inS1 Fig.).
In order to completely block the HMW proteins, we further increased the concentration of blocking gel to 20%. However, when the concentrated proteins passed from the stacking gel into the blocking gel, they spread along the interface of stacking gel and blocking gel due to the force of the fast ions from the electrophoresis system and the back pressure from the small pores of the high concentration of the blocking gel (Part C inS1 Fig.). To circumvent this prob-lem, one layer of funnel gel was added between the stacking gel and the blocking gels to hold the concentrated proteins without too much pressure. Thus, a four-layer gel method based on tricine SDS-PAGE was developed and termed the“gel-filter”method (Fig. 2A).
In this“gel-filter”method, proteins are concentrated and focused at the interface between the stacking gel and the funnel gels under the force generated by the fast ions behind the pro-teins pursuing the slower ions migrating ahead of the propro-teins. After the propro-teins pass through the interface and enter the short funnel gel, the proteins will not be separated too much by the molecular sieve of the funnel gel because of its relatively low concentration and short distance of this gel slot, such that this gel serves as a buffer area. When the proteins enter the blocking gel, the HMW proteins are retained due to the back pressure resulting from the extremely high concentration of the gel; however, the LMW proteins can pass through the small sieve of the gel. Because the blocking gel is as short as the funnel gel, the small molecular weight proteins will not be extensively separated. However, these small proteins can be resolved reasonably well after they enter the separating gel. This method utilizes four layers of gel with varied con-centrations of acrylamide and bis-acrylamide for the facile enrichment of LMW proteins with-out any loss during sample preparation. The proteins or peptides in the separating gel can be eluted or extracted out after trypsin digestion for MS analysis.
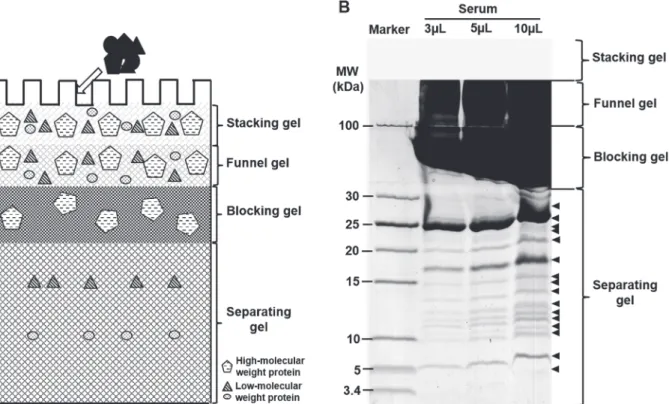
proteins. However, when the serum volume was increased to 10μL which containing 650μg protein, the leading edge of the HMW proteins began to reach the interface between the block-ing gel and separatblock-ing gel, suggestblock-ing the saturation of the loaded amount of this gel method. Therefore, we concluded that the limit of serum amount on this gel-filter method was about 650μg. In addition, to determine the reproducibility of gel-filter method, two completely repeat experiments were carried out. The intensities of the protein bands and the pattern with the same loaded amount were totally identical. It indicated that the gel-filter method performed with great reproducibility.
Gel-filter method provided more distinguishable LMW protein bands
than regular glycine SDS-PAGE and optimized-DS methods
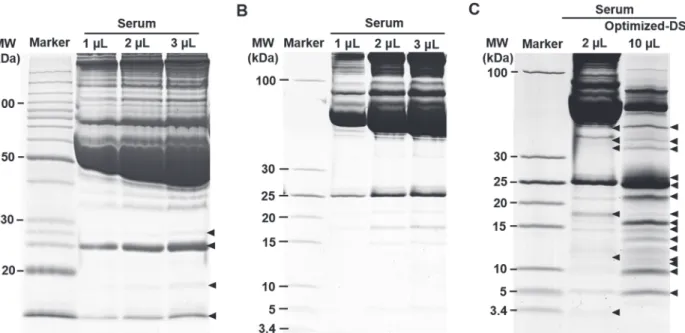
To further evaluate the enrichment efficiency of LMW proteins, three other approaches were applied in comparison with gel-filter method in this study as shown inFig. 3A. Glycine SDS-PAGE is widely used as a fractionation strategy in proteomics research, which is the pre-ferred electrophoretic method for the separation of proteins in the mass range of 1–500 kDa. However, the small proteins on the leading edge of the gel usually disappeared or heavily smeared [28]. As shown inFig. 3A, this gel method showed low resolution in LMW range with only four distinguishable bands. A comparison of lanes 2–4 revealed no obvious enhancement on the recovery for LMW proteins with increasing loaded volume of serum sample. Even worse, the loaded amount would also be limited because the high abundant proteins might damage the gel during the electrophoresis.
Fig 2. Development of gel-filter method for LMW proteins.A. Schematic diagram of the newly developed gel-filter method. B. The enrichment of LMW proteins from serum through the gel-filter method. The visible bands were labeled with arrows.
Tricine SDS-PAGE is an efficient electrophoretic method for resolving proteins smaller than 30 kDa with higher resolution in the LMW range than regular glycine SDS-PAGE [28,41]. As the same for regular glycine SDS-PAGE, there was no visible accumulation of the LMW proteins presenting on the gel with either 1μL or 3μL of serum samples (Fig. 3B). However, when the loaded amount was increased to 10μL, we found that those HAPs were easily over-loaded as well, resulting the damage of the gel. This interfered the detectability for diverse but low abundant and LMW proteins with physiological and diagnostic importance (data not shown).
To remove the HAPs from the serum sample and enrich these diverse but low abundant and LMW proteins for MS analyses, various strategies and techniques have been developed in the past decade [8,16–22]. Among them, the differential solubilization method recently devel-oped by Kawashimaet al. has been selected for comparison because of its high efficiency and reproducibility for extracting LMW proteins [30]. We applied this method, and did see much better performance on the enrichment of low abundant proteins in serum sample because the abundant HMW proteins were significantly reduced. By this way, we could detect about ten en-riched LMW protein bands below 30 kDa molecular weight range (S2 Fig.), which was consis-tent with Kawashima’s result. In order to increase the efficiency of this DS method, we slightly modified the Kawashima’s method by adding certain volume of ultrapure water to the diluted and denatured serum sample as described above to reduce the protein concentration. Then the diluted sample was slowly dropped into 1.2 mL ice-cold acetone, and immediately incubated at -20°C for 4 h. This helped to slow down the precipitation process for proteins mixed with ace-tone. By following this optimized procedure (optimized-DS), we could detect about twelve bands below 30 kDa molecular weight range (Fig. 3C, as indicated as arrows). However, when we compared the pattern between lanes for regular sample preparation and optimized-DS methods, we found that the intensity of the arrowhead-marked bands in the treated sample Fig 3. Performance comparison of the enrichment for LMW proteins from human serum using varied methods.A. The human serum was resolved by 12% glycine SDS-PAGE. B. The human serum was resolved by 12% tricine SDS-PAGE. C. The enrichment of human serum LMW proteins after the process of the optimized-DS method. The volume of serum was used as indicated on the figure.
was not positively correlated with those in the untreated serum. This might be caused by partial solubilization of some potentially important proteins, which resulting their existing in both of the soluable and insoluable fractions [9]. Even worse, some dominant or distinguishable LMW protein bands from original serum might disappear after DS treatment. This result indicated that the original abundance of proteins in the serum sample was changed after the DS treat-ment. Hence, the results from the DS treated serum may not be able to reflect the original na-ture of the sample (Fig. 3Clane3) and bother the quantitative comparison between the physiological and pathological samples for biomarker screening. Therefore, the remaining satisfactory of the enrichment methodology for LMW proteins requires the development of un-biased method with even higher efficiency.
Compared with the optimized-DS, the gel-filter method here performed better efficiency on the enrichment of LMW proteins. When we loaded 3μL of serum sample, we could clearly de-tect 12 sharp bands in the 5–30 kDa molecular weight range, although some bands were thin because of low amount of protein (Fig. 2B). The number of protein bands from 3μL of serum was the same as what we got from 10μL of same sample treated with optimized-DS method, which was the best result we got from the DS method. When the serum sample volume was increased to 5μL, the number of detectable protein bands between 3.4 kDa and 30 kDa molec-ular weight range even increased to 15, which was 25% more than what we got from the opti-mized-DS method. Further analysis of 10μL of serum sample increased the proportion of LMW proteins, but the number of total protein bands remained the same (Fig. 2B). These re-sults indicated that the sample loaded capacity, enrichment efficiency and detection sensitivity of the gel-filter method were better than all of the methods we compared here. More impor-tantly, we did not notice any pattern change on protein bands compared with both of the regu-lar SDS-PAGE and tricine SDS-PAGE results, which remained the original features of protein components in the serum. This is important in quantitative proteomics study.
Evaluation of the enrichment efficiency for LMW proteins through
multiple approaches by LC-MS/MS analysis
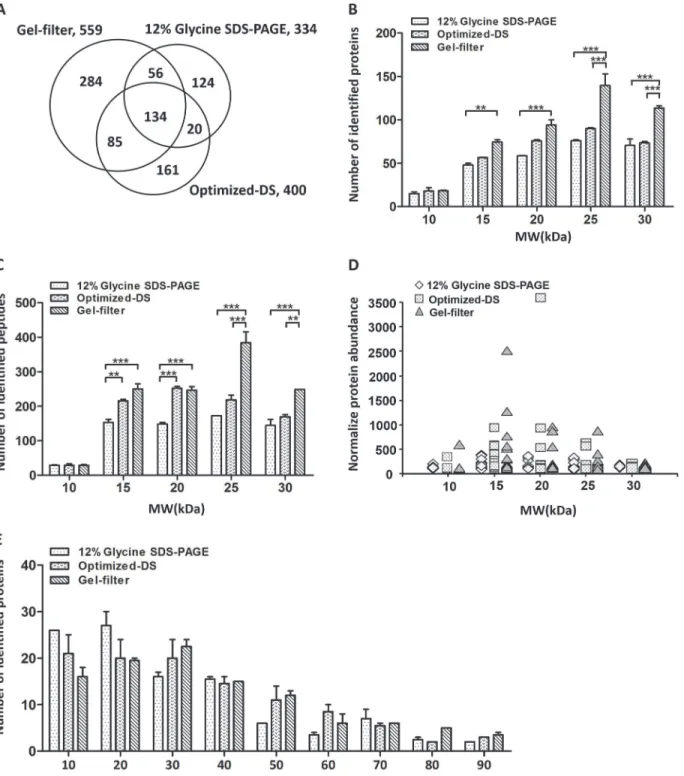
Fig 4. The comparison of identified human serum LMW proteins from the representative methods and gel-filter method.A. Venn diagram for the overlap of identified LMW proteins from the same sample processed by gel-filter, glycine SDS-PAGE and optimized-DS methods. B. Molecular weight distribution of identified LMW proteins from these three approaches. C. The distribution of identified peptides from the LMW proteins after the process of these three approaches. D. Abundance analysis of commonly identified 134 LMW proteins from these three strategies. E. Sequence coverage distribution of the commonly identified LMW proteins from these three methods.(*:P<0.05,**:P<0.01)
Totally we identified 864 LMW proteins from these serum samples treated with three meth-ods. Comparing these three datasets, we found that 134 proteins were commonly identified, representing about 15.5% of these 864 LMW proteins identified (Fig. 4A). A total of 190 pro-teins was commonly identified by both the gel-filter and regular glycine SDS-PAGE methods, which occupying 57% of all identified proteins from glycine SDS-PAGE. This was consistent with the same basic principle of these two methods. We also had 219 proteins commonly iden-tified by the gel-filter and optimized-DS methods, representing 54.8% of the total of 400 pro-teins identified using the optimized-DS method. The percentage for shared propro-teins on both of the optimized-DS and regular glycine SDS-PAGE methods were even lower (46.1% and 38.5%, respectively). This was also consistent with our gel imaging results because some bands disap-peared in the optimized-DS process compared with those for the regular glycine SDS-PAGE and gel-filter methods.
To test for bias of these methods with respect to enrichment of LMW proteins, we catego-rized the identified proteins based on their molecular weight. As indicated inFig. 4B, the pat-terns of these three methods were pretty similar. Globally, the number of proteins identified with regular glycine SDS-PAGE was the lowest one in each molecular weight range bin. It also appeared that the number of identified proteins from the regular glycine SDS-PAGE increased over the 10–25 kDa molecular weight range, and kept stable between 25–30 kDa bins. It sug-gested that this method does not have an obvious enrichment effect on LMW proteins because proteins with higher molecular weight were more easily identified due to the higher number of tryptic peptide. However, the number of proteins identified between 10 kDa and 25 kDa with the optimized-DS method was higher although the number of identified proteins with molecu-lar weight range between 25 kDa and 30 kDa decreased. This was consistent with the principle that the DS method has an enrichment effect on LMW proteins. As the same, we found that the molecular weight distribution of the proteins identified with the gel-filter method also looked like a parabolic curve, in which the highest number centered at about 25 kDa. In each molecular weight range bin, the number of identified proteins for gel-filter method was the highest within these three methods.
A similar trend was observed regarding the distribution of identified peptides (Fig. 4C). There was significant difference on the number of identified proteins/peptides between gel-fil-ter and glycine SDS-PAGE methods (p<0.001) in the molecular weight range of 15–30 kDa.
However, the significant difference on the number of identified proteins/peptides between gel-filter and DS methods was observed only in the molecular weight range of 25–30 kDa. The re-sult further confirmed the higher efficiency of gel-filter method on the enrichment of LMW proteins.
To compare the abundance feature of the identified proteins from different methods, we categorized proteins based on their theoretical molecular weight and relative abundance repre-sented by their spectral counts in mass spectrometry analysis [39]. As expected, the glycine SDS-PAGE performed the narrowest abundance distribution on all of the molecular weight range bins, representing the lowest abundance of identified proteins. This might also be consis-tent with the fact that this method did not show specific enrichment on LMW proteins. How-ever, the other two strategies showed a similar trend in the abundance change of identified proteins (Fig. 4D).
(Fig. 4E). These results further demonstrated that the LMW proteins can be enriched more effi-ciently and without any bias by the gel-filter method developed here.
In order to compare the features of these three methods on whole proteome scale, we then analyzed all of the identified proteins. As shown inFig. 5A, we totally identified 1,576, 1,022 and 1,186 proteins from two repeated runs of gel-filter, optimized-DS and 12%glycine SDS-PAGE methods, respectively (S2 Table). The shared proteins for all of these three datasets were 306, which represented 29.9% of the identification on optimized-DS method and 19.4% of the identified proteins using gel-filter method. The individual percentage for proteins commonly present on the gel-filter and optimized-DS methods and on the glycine SDS-PAGE and the op-timized-DS methods was about 30%, which was slightly lower than the 44.8% of overlapped portion between the gel-filter and glycine SDS-PAGE methods. This, again, was consistent with the similar principles of these two gel-based methods and the different principle of the DS method.
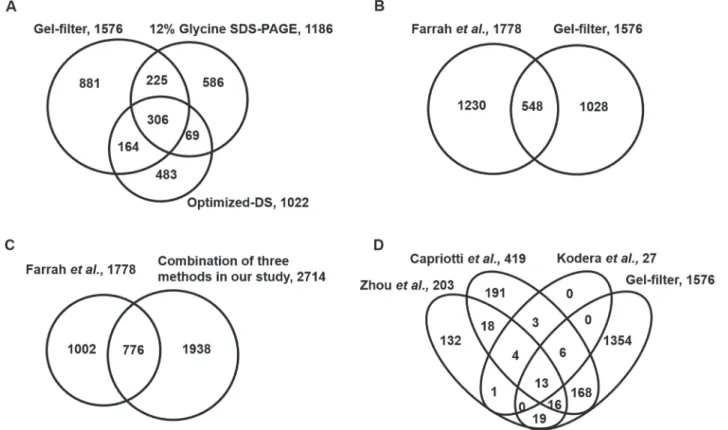
The total 1,576 proteins identified from the gel-filter method, providing one of the largest datasets publicly available for serum proteomics study so far from small volume of serum sam-ple in one experiment. This number was just slightly lower than the pooled database containing 1,778 proteins from Farrah’s group for all of the previously published serum proteomics data (Fig. 5B) [42]. The total proteins presenting in these two datasets were 2,806. By comparing our data with the summarized dataset, we found a total of 548 proteins shared on both, Fig 5. The comparison of identified human serum proteins from gel-filter method and the publically available largest datasets.A. Venn diagram for all of the proteins identified from three methods, including gel-filter, 12% glycine SDS-PAGE and the optimized-DS methods. B. Venn diagram showing the overlap between proteins identified from gel-filter method and the collected datasets for all of the published serum proteomics studies by Farrah et al. C. Venn diagram showing the overlap between proteins identified from all of the three methods used in our study and the collected datasets as in B. D. Venn diagram showing the overlap of proteins identified for gel-filter method and other three serum LMW proteomics studies. All proteins were converted to Gene symbol ID for comparison.
represented 34.8% of all of the proteins identified using the gel-filter method and 19.5% of all 2,806 identified proteins, respectively. Similar findings of low overlap between different serum proteomics studies have been reported previously [8,43]. These results suggest that the serum might contain more proteins. Therefore, multiple approaches should be adopted in the serum proteomics study to achieve even higher coverage of the serum proteome.
By combining all of the proteins identified from the same serum sample treated with all of the three methods in this study, we totally identified 2,714 proteins, which was about 52.6% more proteins than the pooled datasets mentioned above. The number of proteins that over-lapped between these two datasets was 776, representing 28.6% of all 2,714 proteins we identi-fied and 20.9% of all 3,716 proteins identiidenti-fied from human serum so far (Fig. 5C). We also compared our data with those from three publicly available proteomic datasets specifically ex-amining LMW proteins from serum. Among them, Kawashimaet al. identified 27 LMW pro-teins with the DS method they developed. The overlapped propro-teins between our data and Kawashima’s data was 19. Zhouet al. [44] identified 203 proteins by utilizing multiple antibod-ies to deplete the most abundant proteins in serum. The overlap between Zhou’s data and ours was 48 proteins, representing 23.7% of Zhou’s entire dataset and 3.1% of our dataset. Capriottic
et al. [45] tried to identify more LMW proteins by combining multiple techniques, including immunoprecipitation, ultracentrifugation and a hydrogel nanoparticles material. Totally they identified a total of 419 proteins, of which 203 were covered by our method as well, repre-senting 48.5% of all 419 proteins identified in their study. However, the overlap between Capriottic’s data and Zhou’s data was only 51 proteins, suggesting that the principles of their enrichment methods differed. A total of 13 proteins was commonly identified by all four of these studies, which represents about 48% of all proteins identified using the DS method (Fig. 5D). Interestingly, 10 of the proteins have a molecular weight30 kDa with concentra-tions ranging from reasonably high (such as apolipoprotein A-I precursor, 1–2 mg/L in serum) to quite low (such as apolipoprotein C-II precursor, 20–60 ng/mL in serum), indicating the po-tential bias of these methods for the identification of LMW proteins. The largest dataset we ob-tained from our gel-filter method further emphasized the good efficiency of our method for the identification of low-abundance and LMW proteins from serum samples.
Higher enrichment efficiency of Gel-filter method revealed by
quantitative proteomics
18.7 ± 0.01% (calculated based on two peptides) and 9.6 ± 0.03% (n = 2), respectively. This re-cover rate here for ProteoMiner was slightly higher than 3% of rere-covery rate reported previous-ly[49]. These results further demonstrated that the gel-filter method generally performed higher recovery rate than the other methods we tested.
Fig 6. Performance comparison of the recovery rater for LMW proteins from human serum using optimized-DS, ProteoMiner and gel-filter methods.A. Human serum proteome analyzed by the optimized-DS approach. On lane 1, 2μL of untreated human serum was loaded. On lane 3, 10μL of human serum was processed with the optimized-DS method after mixed with 0.3μg regular GST protein. B. The human serum was processed with ProteoMiner method. On lane2, 2μL of untreated human serum was saved as control as in A. On lane 3 (a) and 4 (b), 5% of eluates from the starting 200μL of human serum sample treated with ProteoMiner was mixed with 0.1 or 0.3μg of regular GST proteins and resolved on SDS-PAGE gel. C. Gel-filter analysis of human serum. On lane 2–4 (a-c), 10μL of human serum samples were mixed with 0.3μg of regular GST protein and analyzed by gel-filter method. On lane 4 (A) and 5 (B and C), 0.3μg of regular GST protein alone was loaded as control.
doi:10.1371/journal.pone.0115862.g006
Fig 7. Protein recovery analysis in the process of optimized-DS, ProteoMiner and gel-filter approaches for human serum samples.A. Peptide quantification with SILAC labeled GST as internal standard. Same amount of peptides digested from heavy labeled GST was spiked in the samples processed with optimized-DS, ProteoMiner and gel-filter methods, and then analyzed by LC-MS/MS. B. Histogram of protein recovery after the treatment through these three strategies. Error bars indicate mean±SD. The whole experiment was repeated twice (*: P<0.05,**: P<0.01).
Conclusions
We developed a gel-filter method utilizing varied gel concentrations in multiple layers of tricine SDS-PAGE-based gels. The layers include a stacking gel, funnel gel, blocking gel, and separat-ing gel. Upon electrophoresis, proteins are concentrated in stackseparat-ing gel and completely shifted into a short-length intermediate funnel gel. The LMW proteins pass through the high-concen-tration blocking gel layer smoothly and are further separated in the separating gel. However, HMW proteins are effectively obstructed. The newly developed gel-filter method is a simple but high-yield method for enriching LMW proteins/peptides in serum without bias. Therefore, the method here are expected to be highly instructive for the LMW proteome study and should play a prominent role in screening for LMW protein biomarkers from serum through proteo-mic analyses.
Supporting Information
S1 Data. This file contains supporting data.
(DOC)
S1 Fig. Development of gel-filter method.A. Schematic diagram for the design of three-layer gel-filter method. B. The performance of the developed three-layer gel-filter method for human serum proteome. Lane1, marker; lane 2–3, 3 and 9μL of human serum samples were resolved on the gel, respectively. C. The performance of the developed three-layer gel-filter method with 20% blocking gel in the middle for human serum proteome. Lane1, marker; lane 2–3, 3 and 9μL of human serum samples were run on the gel, respectively.
(TIF)
S2 Fig. Analysis of human serum proteome with regular DS methods.Lane 1, marker; lane 2, 2μL of untreated human serum; lane 3, 10μL of human serum.
(TIF)
S3 Fig. Venn diagrams for two technical replicate runs for the enrichment of LMW pro-teins from human serum.A. 12% Glycine SDS-PAGE, B. Optimized-DS method, C. Gel-filter method.
(TIF)
S4 Fig. Venn diagrams for two independent biological experiments for the enrichment of LMW proteins from human serum.A. 12% Glycine SDS-PAGE, B. Optimized-DS method, C. Gel-filter method.
(TIF)
S5 Fig. Strategies used for the comparison in this study.The comparison for recovery rate of LMW proteins was performed through three different approaches, including optimized-DS, ProteoMiner and Gel-filter methods.
(TIF)
S6 Fig. Protein recovery analysis in the process of optimized-DS, ProteoMiner and gel-fil-ter methods for human serum samples.Peptide quantification was performed by SILAC-AQUA methodology. Same amount of peptides digested from light labeled GST was spiked in the samples processed with optimized-DS, ProteoMiner and gel-filter methods, and then ana-lyzed by LC-MS/MS. A and C. Optimized-DS method; E and G. ProteoMiner; I and K. Gel-fil-ter method. Representative spectra with SILAC pairs of the peptide DFETLK and VDFLSK were selected for quantification as indicated.
S1 Table. Protein identification for one independent biological experiment resulting from LC-MS/MS analysis for different method treated serum samples.
(XLS)
S2 Table. Protein accession number, corresponding total peptide hits and spectral counts resulting from LC-MS/MS analysis for different approaches treated serum sample.
(XLS)
S3 Table. Quantification of recovery of the spike-in GST protein treated with different ap-proaches.
(XLS)
Author Contributions
Conceived and designed the experiments: PX LSC. Performed the experiments: LSC LHZ YCL LYP. Analyzed the data: LSC NL CPZ PX. Contributed reagents/materials/analysis tools: LC JZW XPL DSS. Wrote the paper: PX LSC DSS. Obtained helpful discussions and comments: LHZ YCL LYP NL CPZ LC JZW XPL DSS.
References
1. Drake RR, Cazares L, Semmes OJ (2007) Mining the low molecular weight proteome of blood. Proteo-mics Clin Appl 1(8): 758–768. doi:10.1002/prca.200700175PMID:21136732
2. Björhall K, Miliotis T, Davidsson P (2005) Comparison of different depletion strategies for improved res-olution in proteomic analysis of human serum samples. Proteomics 5(1): 307–317. PMID:15619298 3. Harper RG, Workman SR, Schuetzner S, Timperman AT, Sutton JN (2004) Low-molecular-weight
human serum proteome using ultrafiltration, isoelectric focusing, and mass spectrometry. Electrophore-sis 25(9): 1299–1306. PMID:15174052
4. Emanuel PI, Liotta LA (2003) Counterpoint: the Vision for a New Diagnostic Paradigm. Clin Chem 49 (1276–1278. PMID:12881442
5. Ghaemmaghami S, Huh WK, Bower K, Howson RW, Belle A, et al. (2003) Global analysis of protein ex-pression in yeast. Nature 425(6959): 737–741. PMID:14562106
6. Washburn MP, Wolters D, Yates JR 3rd (2001) Large-scale analysis of the yeast proteome by multidi-mensional protein identification technology. Nat Biotechnol 19(3): 242–247. PMID:11231557 7. Anderson NL, Anderson NG (2002) The human plasma proteome history, character, and diagnostic
prospects. Mol Cell Proteomics 1(11): 845–867. PMID:12488461
8. Tirumalai RS, Chan KC, Prieto DA, Issaq HJ, Conrads TP, et al. (2003) Characterization of the low mo-lecular weight human serum proteome. Mol Cell Proteomics 2(10): 1096–1103. PMID:12917320 9. De Bock M, de Seny D, Meuwis MA, Servais AC, Minh TQ, et al. (2010) Comparison of three methods
for fractionation and enrichment of low molecular weight proteins for SELDI-TOF-MS differential analy-sis. Talanta 82(1): 245–254. doi:10.1016/j.talanta.2010.04.029PMID:20685463
10. Hu S, Loo JA, Wong DT (2006) Human body fluid proteome analysis. Proteomics 6(23): 6326–6353. PMID:17083142
11. Barash IA, Cheung CC, Weigle DS, Ren H, Kabigting EB, et al. (1996) Leptin is a metabolic signal to the reproductive system. Endocrinology 137(7): 3144–3147. PMID:8770941
12. Mantzoros CS (1999) The role of leptin in human obesity and disease: a review of current evidence. Ann Intern Med 130(8): 671–680. PMID:10215564
13. De Luis DA, Perez Castrillon JL, Duenas A (2009) Leptin and obesity. Minerva Med 100(3): 229–236. PMID:19182739
14. Steppan CM, Bailey ST, Bhat S, Brown EJ, Banerjee RR, et al. (2001) The hormone resistin links obesi-ty to diabetes. Nature 409(6818): 307–312. PMID:11201732
15. Moran O, Phillip M (2003) Leptin: obesity, diabetes and other peripheral effects—a review. Pediatr Dia-betes 4(2): 101–109. PMID:14655266
17. Kay R, Barton C, Ratcliffe L, Matharoo-Ball B, Brown P, et al. (2008) Enrichment of low molecular weight serum proteins using acetonitrile precipitation for mass spectrometry based proteomic analysis. Rapid Communications in Mass Spectrom 22(20): 3255–3260. doi:10.1002/rcm.3729PMID:
18803344
18. Chertov O, Biragyn A, Kwak LW, Simpson JT, Boronina T, et al. (2004) Organic solvent extraction of proteins and peptides from serum as an effective sample preparation for detection and identification of biomarkers by mass spectrometry. Proteomics 4(4): 1195–1203. PMID:15048999
19. Pieper R, Gatlin CL, Makusky AJ, Russo PS, Schatz CR, et al. (2003) The human serum proteome: Display of nearly 3700 chromatographically separated protein spots on two‐dimensional electrophore-sis gels and identification of 325 distinct proteins. Proteomics 3(7): 1345–1364. PMID:12872236 20. Terracciano R, Gaspari M, Testa F, Pasqua L, Tagliaferri P, et al. (2006) Selective binding and
enrich-ment for low-molecular weight biomarker molecules in human plasma after exposure to nanoporous sil-ica particles. Proteomics 6(11): 3243–3250. PMID:16645983
21. Meng R, Gormley M, Bhat VB, Rosenberg A, Quong AA (2011) Low abundance protein enrichment for discovery of candidate plasma protein biomarkers for early detection of breast cancer. J Proteomics 75 (2): 366–374. doi:10.1016/j.jprot.2011.07.030PMID:21851866
22. Adkins JN, Varnum SM, Auberry KJ, Moore RJ, Angell NH, et al. (2002) Toward a human blood serum proteome: analysis by multidimensional separation coupled with mass spectrometry. Mol Cell Proteo-mics 1(12): 947–955. PMID:12543931
23. Shi T, Zhou JY, Gritsenko MA, Hossain M, Camp DG 2nd, et al. (2012) IgY14 and SuperMix immunoaf-finity separations coupled with liquid chromatography-mass spectrometry for human plasma proteo-mics biomarker discovery. Methods 56(2): 246–253. doi:10.1016/j.ymeth.2011.09.001PMID:
21925605
24. Sennels L, Salek M, Lomas L, Boschetti E, Righetti PG, et al. (2007) Proteomic Analysis of Human Blood Serum Using Peptide Library Beads. J Proteome Res 6(10): 4055–4062. PMID:17877382 25. Castagna A, Cecconi D, Sennels L, Rappsilber J, Guerrier L, et al. (2005) Exploring the hidden human
urinary proteome via ligand library beads. J Proteome Res 4(6): 1917–1930. PMID:16335936 26. Guerrier L, Claverol S, Fortis F, Rinalducci S, Timperio AM, et al. (2007) Exploring the Platelet
Prote-ome via Combinatorial, Hexapeptide Ligand Libraries. J ProteProte-ome Res 6(11): 4290–4303. PMID:
17918985
27. Guerrier L, Righetti PG, Boschetti E (2008) Reduction of dynamic protein concentration range of biolog-ical extracts for the discovery of low-abundance proteins by means of hexapeptide ligand library. Nat Protoc 3(5): 883–890. doi:10.1038/nprot.2008.59PMID:18451796
28. Schagger H (2006) Tricine-SDS-PAGE. Nat Protoc 1(1): 16–22. PMID:17406207
29. Laemmli UK (1970) Cleavage of Structural Proteins during the Assembly of the Head of Bacteriophage T4. Nature 227(5259): 680–685. PMID:5432063
30. Kawashima Y, Fukutomi T, Tomonaga T, Takahashi H, Nomura F, et al. (2010) High-yield peptide-ex-traction method for the discovery of subnanomolar biomarkers from small serum samples. J Proteome Res 9(4): 1694–1705. doi:10.1021/pr9008018PMID:20184378
31. Shevchenko A, Jensen ON, Podtelejnikov AV, Sagliocco F, Wilm M, et al. (1996) Linking genome and proteome by mass spectrometry: large-scale identification of yeast proteins from two dimensional gels. Proc Natl Acad Sci U S A 93(25): 14440–14445. PMID:8962070
32. Rappsilber J, Mann M, Ishihama Y (2007) Protocol for micro-purification, enrichment, pre-fractionation and storage of peptides for proteomics using StageTips. Nat Protoc 2(8): 1896–1906. PMID:
17703201
33. Linhui Z, Cheng C, Ning L, Duong DM, Hao C, et al. (2013) Systematic research on the pre‐treatment of peptides for quantitative proteomics using a C18microcolumn. Proteomics 13(15): 2229–2237. doi:10. 1002/pmic.201200591PMID:23723153
34. Ping L, Zhang H, Zhai L, Dammer EB, Duong DM, et al. (2013) Quantitative proteomics reveals signifi-cant changes in cell shape and an energy shift after IPTG induction via an optimized SILAC approach for Escherichia coli. J Proteome Res 12(12): 5978–5988. doi:10.1021/pr400775wPMID:24224529 35. Ping X, Duong DM, Junmin P (2009) Systematical optimization of reverse-phase chromatography for shotgun proteomics. J Proteome Res 8(8): 3944–3950. doi:10.1021/pr900251dPMID:19566079 36. Pedrioli PG, Eng JK, Hubley R, Vogelzang M, Deutsch EW, et al. (2004) A common open
representa-tion of mass spectrometry data and its applicarepresenta-tion to proteomics research. Nat Biotechnol 22(11): 1459–1466. PMID:15529173
38. Motoyama A, Venable JD, Ruse CI, Yates JR 3rd (2006) Automated ultra-high-pressure multidimen-sional protein identification technology (UHP-MudPIT) for improved peptide identification of proteomic samples. Anal Chem 78(14): 5109–5118. PMID:16841936
39. Peng J, Kim MJ, Cheng D, Duong DM, Gygi SP, et al. (2004) Semiquantitative proteomic analysis of rat forebrain postsynaptic density fractions by mass spectrometry. J Biol Chem 279(20): 21003–21011. PMID:15020595
40. Li D, Fu Y, Sun R, Ling CX, Wei Y, et al. (2005) pFind: a novel database-searching software system for automated peptide and protein identification via tandem mass spectrometry. Bioinformatics 21(13): 3049–3050. PMID:15817687
41. Carrette O, Demalte I, Scherl A, Yalkinoglu O, Corthals G, et al. (2003) A panel of cerebrospinal fluid potential biomarkers for the diagnosis of Alzheimer's disease. Preoteomics 3(8): 1486–1494.
42. Farrah T, Deutsch EW, Omenn GS, Campbell DS, Sun Z, et al. (2011) A high-confidence human plas-ma proteome reference set with estiplas-mated concentrations in PeptideAtlas. Mol Cell Proteomics 10(9): M110 006353. doi:10.1074/mcp.M111.010876PMID:21715319
43. Georgiou HM, Rice GE, Baker MS (2001) Proteomic analysis of human plasma: failure of centrifugal ul-trafiltration to remove albumin and other high molecular weight proteins. Proteomics 1(12): 1503– 1506. PMID:11747208
44. Zhou M, Lucas DA, Chan KC, Issaq HJ, Petricoin EF III, et al. (2004) An investigation into the human serum“interactome”. Electrophoresis 25(9): 1289–1298. PMID:15174051
45. Capriotti AL, Caruso G, Cavaliere C, Piovesana S, Samperi R, et al. (2012) Comparison of three differ-ent enrichmdiffer-ent strategies for serum low molecular weight protein iddiffer-entification using shotgun proteo-mics approach. Anal Chim Acta.
46. Xu P, Duong DM, Seyfried NT, Cheng D, Xie Y, et al. (2009) Quantitative proteomics reveals the func-tion of unconvenfunc-tional ubiquitin chains in proteasomal degradafunc-tion. Cell 137(1): 133–145. doi:10. 1016/j.cell.2009.01.041PMID:19345192
47. Phillips CM, Iavarone AT, Marletta MA (2011) Quantitative Proteomic Approach for Cellulose Degrada-tion by Neurospora crassa. J Proteome Res 10(9): 4177–4185. doi:10.1021/pr200329bPMID:
21744778
48. Geiger T, Wisniewski JR, Cox J, Zanivan S, Kruger M, et al. (2011) Use of stable isotope labeling by amino acids in cell culture as a spike-in standard in quantitative proteomics. Nat Protoc 6(2): 147–157. doi:10.1038/nprot.2010.192PMID:21293456