Subunits from the Wheat Proteome Using Combined
Liquid Chromatography-Electrospray Ionization Mass
Spectrometry
Bert Lagrain1,2*, Markus Brunnbauer1, Ine Rombouts1,2, Peter Koehler1
1German Research Center for Food Chemistry, Freising, Germany,2Laboratory of Food Chemistry and Biochemistry and Leuven Food Science and Nutrition Research Centre (LFoRCe), Katholieke Universiteit Leuven, Leuven, Belgium
Abstract
The present paper describes a method for the identification of intact high molecular weight glutenin subunits (HMW-GS), the quality determining proteins from the wheat storage proteome. The method includes isolation of HMW-GS from wheat flour, further separation of HMW-GS by reversed-phase high-performance liquid chromatography (RP-HPLC), and their subsequent molecular identification with electrospray ionization mass spectrometry using a quadrupole-time-of-flight mass analyzer. For HMW-GS isolation, wheat proteins were reduced and extracted from flour with 50% 1-propanol containing 1% dithiothreitol. HMW-GS were then selectively precipitated from the protein mixture by adjusting the 1-propanol concentration to 60%. The composition of the precipitated proteins was first evaluated by sodium dodecyl sulfate-polyacrylamide gel electrophoresis with Coomassie staining and RP-HPLC with ultraviolet detection. Besides HMW-GS ($65%), the isolated proteins mainly containedv5-gliadins. Secondly, the isolated protein fraction was analyzed by liquid chromatography-mass spectrometry. Optimal chromatographic separation of HMW-GS from the other proteins in the isolated fraction was obtained when the mobile phase contained 0.1% trifluoroacetic acid as ion-pairing agent. Individual HMW-GS were then identified by determining their molecular masses from the high-resolution mass spectra and comparing these with theoretical masses calculated from amino acid sequences. Using formic acid instead of trifluoroacetic acid in the mobile phase increased protein peak intensities in the base peak mass chromatogram. This allowed the detection of even traces of other wheat proteins than HMW-GS in the isolated fraction, but the chromatographic separation was inferior with a major overlap between the elution ranges of HMW-GS andv-gliadins. Overall, the described method allows a rapid assessment of wheat quality through the direct determination of the HMW-GS composition and offers a basis for further top-down proteomics of individual HMW-GS and the entire wheat glutenin fraction.
Citation:Lagrain B, Brunnbauer M, Rombouts I, Koehler P (2013) Identification of Intact High Molecular Weight Glutenin Subunits from the Wheat Proteome Using Combined Liquid Chromatography-Electrospray Ionization Mass Spectrometry. PLoS ONE 8(3): e58682. doi:10.1371/journal.pone.0058682
Editor:Sonja Hess, California Institute of Technology, United States of America
ReceivedOctober 12, 2012;AcceptedFebruary 5, 2013;PublishedMarch 8, 2013
Copyright:ß2013 Lagrain et al. This is an open-access article distributed under the terms of the Creative Commons Attribution License, which permits
unrestricted use, distribution, and reproduction in any medium, provided the original author and source are credited.
Funding:BL wishes to acknowledge the Research Foundation – Flanders (FWO, Brussels, Belgium; www.fwo.be) for his position as postdoctoral fellow. IR wishes to acknowledge the Special Research Fund (KU Leuven, Leuven, Belgium; www.kuleuven.be) for a position as postdoctoral fellow. IR and BL both wish to acknowledge the FWO for financial support during a research stay at the German Research Center for Food Chemistry. The funders had no role in study design, data collection and analysis, decision to publish, or preparation of the manuscript.
Competing Interests:The authors have declared that no competing interests exist.
* E-mail: [email protected]
Introduction
Gluten proteins or prolamins are the storage proteins of wheat (Triticum aestivum L.) and represent an important fraction of the daily human protein intake. They are insoluble in water, but can be divided into alcohol soluble gliadins and alcohol insoluble glutenins. Wheat gluten proteins are characterized by their ability to form a cohesive viscoelastic mass when mixed with water. Because of their unique properties, they play a key role in the appearance and quality of different wheat-based foods, such as bread, pasta and pastry [1].
Although end-use quality of common wheat is influenced by growing conditions and genotype, the composition of glutenin is responsible for the major part of the variability in wheat quality. Glutenin is a polymeric protein consisting of disulfide linked glutenin subunits (GS) [1]. Structurally GS can be grouped into
according to known amino acid sequences, they have Mrs ranging
from 65,000 to 90,000. In addition to the overestimated Mrof all
HMW-GS, the relative mobilities of individual subunits in SDS-PAGE are not always directly related to differences in their Mr[5].
Therefore, other techniques, such as high-performance liquid chromatography (HPLC) and lab-on-a-chip capillary electropho-resis, but also mass spectrometry (MS), have been developed to identify and characterize HMW-GS [6,7]. Especially, matrix-assisted laser desorption/ionization time-of-flight (MALDI-TOF) MS has proven to be a sensitive technique to determine the molecular weights of intact HMW-GS [7]. At first it was difficult to distinguish mixtures of HMW-GS in a single MALDI-TOF analysis due to suppression phenomena resulting in poor resolution [8], but finally the molecular weights of different HMW-GS were determined with reasonable accuracy [7,9,10].
While MALDI-TOF MS is often used for direct identification of (simple) protein mixtures, which is the case for isolated HMW-GS, or in combination with two-dimensional gel electrophoresis, electrospray ionization (ESI)-MS is a liquid-based method and is compatible with typical chromatographic separations of biosam-ples. ESI produces a range of charged species for each bio-molecule, which increases the precision of mass assignments [11,12]. For gluten and other proteins, most applications for ESI-MS involve protein identification by proteolytic digestion followed by liquid chromatography and tandem MS of individual ions from the resulting peptide mixture. This ‘bottom-up’ or ‘shotgun’ approach has been used to verify HMW-GS sequences as derived from their genes [13,14], wheat gluten composition [15], but also gluten structures [16]. The bottom-up approach becomes chal-lenging with increasing complexity of the protein mixture. As a result, the identified peptides sometimes only represent a part of the full protein sequence, low MW proteins are not always detected, and there is a potential loss of data regarding isoforms
and post-translational modifications [11,17,18]. In addition, wheat prolamins, and especially HMW-GS, are large proteins and have long repetitive sequences with few tryptic cleavage sites, leading to a peptide pool with unfavorable MS/MS characteristics [3]. Hence, a ‘top-down’ approach, in which intact proteins are measured and (partially) sequenced, can be advantageous for primary structure determination and the detection of specific protein modifications [11]. For top-down proteomics ESI is preferred over MALDI as ion source, because mono-charged protein ions, such as those generated by a MALDI source, cannot be detected with high resolution [18]. Furthermore, in order to achieve the full potential of top-down approaches, the chromato-graphic separation of intact proteins should be brought to the level as now achieved in shotgun proteomics for routine tandem MS analysis [19]. Reversed-phase (RP-) HPLC has been widely applied to cereal proteins and has proven to be a highly efficient tool for the qualitative and quantitative investigation and isolation of intact gliadins and GS [20,21,22]. RP-HPLC has been used in combination with ESI-MS to identify gliadins and LMW-GS [23,24]. Nevertheless, the detection of intact HMW-GS with ESI-MS has not yet been reported, despite their key role in glutenin structure, wheat differentiation and quality. Proteomics of wheat, including a reliable detection of HMW-GS, combined with a full transcriptome analysis would offer an effective approach for controlling the genetic improvement of wheat [25]. A top-down approach using LC-ESI-MS can reveal the transcriptome protein structure including the positioning of post-translational modifica-tions [26]. Given their unique and high masses, a direct, accurate and sensitive detection of HMW-GS can also be used to monitor wheat contamination in foods, which is necessary for people on a gluten-free diet.
Earlier studies using LC-ESI-MS to identify intact gluten proteins, focused on isolated LMW-GS only [24] or entire gliadin and reduced glutenin fractions [23]. In the latter study, different gliadins and LMW-GS could be distinguished, but at the elution times of the HMW-GS no distinct molecular mass could be obtained [23]. Furthermore, it was reported that, unlike gliadin, the components of glutenin show a greater mass variability, which impeded comparison of proteins from different wheat cultivars [23]. Therefore, the aim of this study was first to isolate commonly occurring HMW-GS from flour to reduce the high complexity of a reduced glutenin mixture in LC-ESI-MS [23]. Then specific conditions for HMW-GS separation and identification using RP-HPLC-ESI-MS were determined.
Materials and Methods
Wheat Flour
Three common wheat cultivars (cvs.) with known HMW-GS composition were selected: Akteur (subunits Ax1, Bx7, By9, Dx5, Dy10), Contra (Bx6, By8, Dx2, Dy12) and Apache (Ax2*, Bx7, By9, Dx3, Dy12). Wheat kernels of the cv. Akteur (harvest 2009) and Apache (harvest 2011) were milled into white flour with a Bu¨hler Mill (Bu¨hler, Uzwil, Switzerland). Wheat kernels of the cv. ‘Contra’ (harvest 2009) were milled into white flour with a Quadrumat Junior Mill (Brabender, Duisburg, Germany). All flour samples were sifted through a 0.2 mm screen.
Chemicals and Reagents
The quality of all chemicals was of analytical grade or stated otherwise. Acetonitrile (ACN, LiChrosolv), Coomassie Brillant Blue R-250, formic acid (98–100%), glacial acetic acid, hydro-chloric acid (32%, w/w), methanol (LiChrosolv), 1-propanol (LiChrosolv), sodium azide, SDS, trichloroacetic acid, and
Figure 1. SDS-PAGE of isolated HMW-GS fractions from three wheat cultivars (cvs.).The subunit composition of wheat cvs. Contra (lane 2), Akteur (lane 3) and Apache (lane 4) is indicated with numbers according to the current nomenclature system [4]. Protein Mrmarkers
are given in lane 1 (from top: myosin,b-galactosidase, bovine serum albumin, ovalbumin, carbonic anhydrase).
tris(hydroxymethyl)aminomethane (Tris) were from Merck (Darm-stadt, Germany). Calcium chloride hexahydrate, sodium hydrox-ide ($98%), and trifluoroacetic acid (TFA, $98%) were from Sigma-Aldrich (Steinheim, Germany). 3-(N-morpholino)propane-sulfonic acid (MOPS) was from AppliChem (Darmstadt, Ger-many). Dithiothreitol (DTT), ethylenediaminetetraacetic acid (EDTA), phenol red, and serva blue G250 were from Serva
(Heidelberg, Germany). Water was deionized by a Millipore-O Milli-Q purification system (Merck Millipore, Billerica, MA, USA).
Determination of Flour Protein Content
Flour protein contents were determined in triplicate, using an adaptation of the AOAC Official Method 990.03 [27] to an
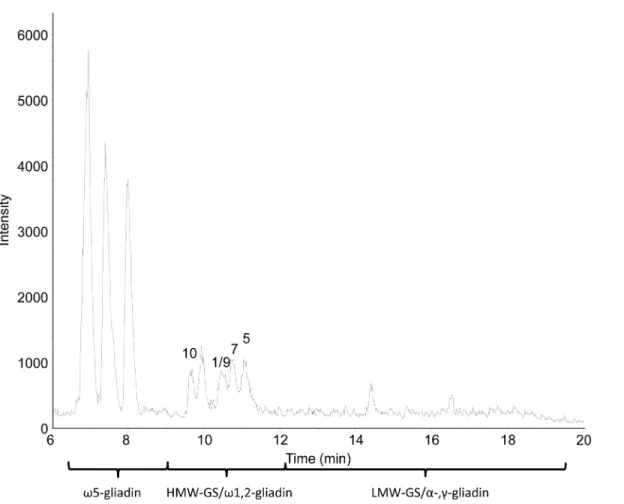
Table 1.Levels ofv5-gliadins and HMW-GS in flour and isolated HMW-GS fractions of the wheat cvs. Akteur, Contra and Apache and the respective protein yields in the HMW-GS fractions.
v5-gliadin1 HMW-GS Other wheat proteins
Wheat flour (% of total flour protein)
Akteur 6.3 7.0 86.7
Contra 4.0 7.5 88.5
Apache 5.0 6.2 88.8
Isolated HMW-GS (%)
Akteur 10.4 74.2 15.4
Contra 9.7 64.6 25.7
Apache 6.3 86.5 7.2
Protein yield in HMW-GS fraction (% of protein type in flour)
Akteur 14.2 91.9 1.6
Contra 25.6 91.7 3.2
Apache 8.5 93.2 0.6
1Including the glutenin-bound (vb-) gliadins. doi:10.1371/journal.pone.0058682.t001
Figure 2. RP-HPLC chromatogram (210 nm) of the isolated HMW-GS fraction of wheat cv. Akteur.HMW-GS are labeled with numbers according to their current nomenclature system [4].
automated Dumas protein analysis system (EAS variomax N/CN, Elt, Gouda, The Netherlands). A conversion factor of 5.7 was used to calculate protein from nitrogen content.
Determination of Flour Protein Composition
Flour protein compositions, and levels ofv5-gliadin and HMW-GS in particular, were determined by an adapted Osborne fractionation according to Wieser et al. [22]. Hereto, flour samples (100.0 mg) were extracted twice with 1.0 ml of a salt solution (0.4 mol/L NaCl, 0.067 mol/L HKNaPO4pH 7.6) (yielding the
albumin/globulin extract), three times with 0.5 ml 60% (v/v) ethanol (yielding the gliadin extract) and twice with 1.0 ml 0.05 mol/L Tris/HCl buffer (pH 7.5) containing 50% 1-propa-nol, 2.0 mol/L urea and 1.0% (w/v) DTT and kept under nitrogen (yielding the reduced glutenin extract). Protein extracts were then subjected to RP-HPLC with a Jasco X-LC system (Jasco, Easton, MD, USA). After filtration over polyethersulfone (0.45mm), protein extracts were loaded (10mL) on an Acclaim 300 C18column (Dionex, Du¨ren, Germany). The elution system
consisted of deionized water (A) and ACN (B), both with 0.1% TFA (v/v). Between analyses, the column was equilibrated at 24% B. For each run the following gradient was used based on Wieser et al. [22,28]: (i) isocratic at 0% B for 0.4 min; (ii) linear from 0 to 24% B over 0.1 min; (iii) linear from 24 to 56% B over 19.5 min; (iv) isocratic at 90% B for 4 min; (iv) linear from 90 to 0% B in 0.1 min; (v) isocratic at 0% B for 5.8 min. Proteins were eluted (60uC, flow rate: 0.2 mL/min) and detected at 210 nm.
a-Gliadin, c-gliadin, v5- and v1,2-gliadins, LMW-GS and HMW-GS were distinguished based on their elution order [22]. To determine the mass fraction of the different protein types, PWG-gliadin (Prolamin Working Group, Freising, Germany) was used as calibration reference [29].
Isolation of HMW-GS Fractions from Flour
HMW-GS were extracted from flour according to Marchylo et al. [20]. Flour (33 g) was stirred for 30 min at 60uC in 200 mL 50% (v/v) 1-propanol containing 1.0% DTT (w/v). After centrifugation (20 min at 4600g), the supernatant was collected and the residue was again extracted with 100 mL of the same solvent by stirring it for 30 min at 60uC. After centrifugation (20 min at 4600g), the combined supernatants (300 mL) were filtered over paper. HMW-GS were then selectively precipitated at ambient conditions by gradually adding 75 mL 100% 1-propanol to bring the 1-propanol concentration of the supernatant to 60.0% (v/v). The suspension was allowed to stand at ambient conditions for 30 min. The precipitate was then collected after centrifugation (20 min at 4600g) and removal of the supernatant. For further analysis by SDS-PAGE and RP-HPLC the precipitated proteins were freeze-dried. For LC-MS analysis, the collected precipitate was dried under vacuum with a rotational vacuum concentrator (Christ RVC 2–25, Martin Christ, Osterode am Harz, Germany) immediately after centrifugation.
Figure 3. Base peak mass chromatogram from RP-HPLC-ESI-MS of the isolated HMW-GS fraction of wheat cv. Akteur.The mobile phase contains 0.1% (v/v) TFA. HMW-GS are labeled with numbers according to the current nomenclature system [4].
SDS-PAGE of Isolated HMW-GS Fractions
SDS-PAGE was carried out according to Lagrain et al. [5] based on the method of Kasarda et al. [30] with a homogeneous NuPAGE 10% polyacrylamide - Bis-Tris [Bis(2-hydroxyethyl)-amino-tris(hy-droxymethyl)-methane-HCl] gel at pH 6.4, 1.0 mm610 well
(In-vitrogen, Carlsbad, CA, USA). The running buffer was MOPS-Tris (50 mmol/L MOPS, 50 mmol/L Tris, 3.5 mmol/L SDS, 1 mmol/ L EDTA, pH 7.7) containing DTT (5 mmol/L) as reducing agent added to the inside chamber. Freeze-dried HMW-GS (1.0 mg) were mixed with 1 mL of extraction buffer (293.3 mmol/L sucrose,
Figure 4. Mass spectra of wheat HMW-GS Dy10 (A) and Dx5 (B).The spectra are taken from the average of scans under the peaks with retention times 9.7 min (A) and 11 min (B) from the base peak mass chromatogram after RP-HPLC-ESI-MS of the isolated HMW-GS fraction from wheat cv. Akteur. The simulated mass spectra obtained by maximum entropy deconvolution are shown as insets.
246.4 mmol/L Tris, 69.4 mmol/L SDS, 0.51 mmol/L EDTA, 0.22 mmol/L serva blue G250, 0.177 mmol/L phenol red, 0.105 mmol/L HCl, pH 8.5) for 24 h under reducing conditions (DTT, 50 mmol/L). The protein suspension was then shaken for 10 min at 60uC and centrifuged at 5000gfor 5 min at 20uC. Five proteins with different Mr(myosin, 200 k;b-galactosidase, 116 k;
bovine serum albumin, 66 k; ovalbumin, 43 k; carbonic anhydrase, 29 k) were used as Mrmarkers. The sample volumes on the gel were
between 5 to 10mL per slot. Running time was 40 min at 200 V and 115 mA. After the run, proteins were fixed for 30 min in 12% (w/w) trichloroacetic acid and stained for 30 min with Coomassie Brilliant Blue R-250. Gels were first destained twice with methanol/water/ acetic acid (50/40/10, v/v/v) for 15 min and then overnight with water/methanol/acetic acid (80/10/10, v/v/v).
RP-HPLC of Isolated HMW-GS Fractions
Freeze-dried HMW-GS isolates were dissolved (20 min, 60uC) in 50% (v/v) 1-propanol containing 1.0% DTT (w/v) to obtain a concentration of 1.0 mg protein/mL. Protein solutions (10ml) were then subjected to RP-HPLC (see above). Protein composition of the HMW-GS isolates was also determined according to Wieser et al. [22] and mass fractions of the different protein types in the HMW-GS isolates were determined with PWG-gliadin as calibration reference. Yields of protein types, in particular HMW-GS and v5-type gliadins, were calculated by comparing their levels in flour to their levels in the HMW-GS isolate.
LC-MS of Isolated HMW-GS Fractions
Vacuum-dried HMW-GS isolates were dissolved in 30% ACN containing 0.4% (v/v) TFA to a concentration of 1.0 mg protein/ mL. LC-MS experiments were performed on an ESI-QTOF mass spectrometer (microTOF-Q, Bruker Daltonics, Bremen, Ger-many) coupled with an UltiMate 3000 HPLC (Dionex, Idstein, Germany) system equipped with an Xbridge BEH300 C43.5mm
column (2.16150 mm; Waters, Milford, MS, USA). The mobile
phase for LC separation was (A) 0.1% (v/v) formic acid or TFA in water and (B) 0.1% (v/v) formic acid or TFA in acetonitrile. The same gradient was used as for regular RP-HPLC (see above). The flow rate was 0.2 mL/min, injection volume was 20mL, and
column temperature was 60uC. The mass spectrometer was operated in the positive mode (capillary voltage:24000 V; end plate offset:2500 V). Nitrogen was used as drying (8.0 L/min, 180uC) and nebulizing gas (0.13 MPa). The scan range wasm/z
750 to 2,500 (quadrupole ion energy: 5.0 eV). Analysis of the LC-MS data files was performed using Bruker Daltonics DataAnalysis software. Mrwas calculated with related-ion deconvolution (mass
range: 5,000–100,000, maximum charge: 100, minimum peaks in compound: 3, maximum number of compounds: 10, envelope cut-off: 75%, Mr agreement: 0.05%) and maximum entropy
deconvolution (mass range: 5,000–100,000, instrument resolution power: 10,000).
Table 2.Relative average molecular masses (Mr) and
corresponding proteins detected in the isolated HMW-GS fractions of the cvs. Akteur, Contra and Apache as determined by RP-HPLC-ESI-MS with the mobile phase containing 0.1% (v/ v) TFA.
Wheat
cultivar RT (min) Mr1 Identification2
Akteur
6.9 54,838 (0.7) v5-gliadin
7.4 54,951 (0.5) v5-gliadin
8.0 51,527 (0.4) v5-gliadin
9.7 67,476 (0.6) HMW-GS Dy10
9.9 41,863 (0.6) v1,2-gliadin
10.4 87,697 (0.7) HMW-GS Ax1
73,519 (0.5) HMW-GS By9
10.7 82,528 (0.7) HMW-GS Bx7
11.0 88,114 (0.7) HMW-GS Dx5
Contra
7.0 54,836 (0.6) v5-gliadin
7.5 51,413 (0.5) v5-gliadin
8.1 51,526 (0.7) v5-gliadin
9.7 68,512 (0.8) HMW-GS Dy12
86,477 (0.6) HMW-GS Bx6
10.1 41,862 (0.7) v1,2-gliadin
10.5 75,239 (0.8) HMW-GS By8
11.2 87,105 (0.7) HMW-GS Dx2
Apache
6.9 54,837 (0.5) v5-gliadin
7.4 54,952 (0.6) v5-gliadin
8.0 51,528 (0.6) v5-gliadin
9.6 68,532 (0.7) HMW-GS Dy12
10.0 41,863 (0.6) v1,2-gliadin
10.4 86,338 (0.6) HMW-GS Ax2*
73,521 (0.7) HMW-GS By9
10.7 82,529 (0.7) HMW-GS Bx7
11.0 87,207 (0.6) HMW-GS Dx3
1Standard deviations are given between brackets. 2Based on M
ragreement with proteins from the wheat storage proteome [5,36]. doi:10.1371/journal.pone.0058682.t002
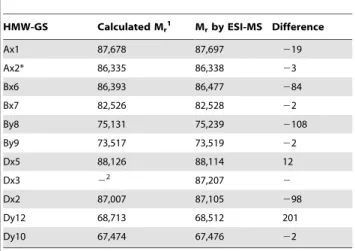
Table 3.Comparison of the theoretical relative molecular mass (Mr) of HMW-GS calculated from their known amino acid
sequences with their corresponding Mrdetermined by
RP-HPLC-ESI-MS.
HMW-GS Calculated Mr1 Mrby ESI-MS Difference
Ax1 87,678 87,697 219
Ax2* 86,335 86,338 23
Bx6 86,393 86,477 284
Bx7 82,526 82,528 22
By8 75,131 75,239 2108
By9 73,517 73,519 22
Dx5 88,126 88,114 12
Dx3 22 87,207 2
Dx2 87,007 87,105 298
Dy12 68,713 68,512 201
Dy10 67,474 67,476 22
1Based on results by Lagrain et al. [5].
Results and Discussion
Isolation and Composition of the HMW-GS Enriched Fraction
To reduce the complexity of a mixture of gluten proteins, HMW-GS were selectively isolated from wheat flour by their precipitation [20]. Figure 1 shows the Bis-Tris SDS-PAGE of the isolated proteins of cvs. Akteur, Contra and Apache that precipitated from the dissolved and reduced wheat proteins in 50% (v/v) 1-propanol containing 1% (w/v) DTT by adjusting the propanol concentration to 60% (v/v) at ambient conditions [20]. While classical Tris-glycine SDS-PAGE leads to anomalous migration orders of HMW-GS, the Bis-Tris SDS-PAGE system separates all HMW-GS according to their amino acid chain length [5]. In order to visualize the potential presence of proteins other than HMW-GS in the precipitate, a tenfold higher protein concentration compared to the one described in Lagrain et al. [5] was applied. Despite the high protein concentration on the gel, all subunits were well separated, except for subunits 9 and 10 in cv. Akteur. Both order and composition of HMW-GS from wheat cvs. Akteur, Contra and Apache were confirmed with the Bis-Tris gel shown in Figure 1. Furthermore, the protein pattern of the gel clearly indicated HMW-GS as the major protein fraction (Figure 1). To determine the quantity and yield of the proteins in the precipitated HMW-GS fraction, RP-HPLC was used according to Wieser et al. [22]. In this method proteins elute according to different surface hydrophobicity. This implies that,
for gluten proteins, each protein type is separated as a unique subgroup and can be quantified without major overlap [22]. RP-HPLC analysis of the Osborne protein fractions of flour revealed that about 7% of all proteins in flour were HMW-GS (Table 1). The protein elution pattern from RP-HPLC of an isolated GS fraction (cv. Akteur) is given in Figure 2 and confirms HMW-GS as the most important fraction in the precipitated protein fraction. Calculation of protein levels in the HMW-GS fractions from their RP-HPLC chromatograms further illustrates the successful isolation of HMW-GS. At least 65% of the total mass of precipitated proteins consisted of HMW-GS. More than 90% of HMW-GS present in flour were recovered in the precipitate (Table 1). An important part of other gluten proteins that co-precipitated with the HMW-GS (about 15 to 25% of the total mass of precipitated proteins) consisted of v5-gliadins, including the glutenin-bound (vb-gliadins or D-LMW-GS) v5-gliadins, while only trace amounts (,4%) of other (gluten) proteins precipitated. HMW-GS yields are consistent for the three wheat cultivars, but more proteins co-precipitated with the HMW-GS in the protein extract from cv. Contra than in the extracts from cvs. Akteur and Apache (Table 1). Overall, the above described method provided a fast, simple and efficient way to obtain relatively pure wheat HMW-GS fractions with high yields and suitable for further MS analysis.
Figure 5. Base peak chromatogram from RP-HPLC-ESI-MS of the isolated HMW-GS fraction of wheat cv. Akteur.The mobile phase contains 0.1% (v/v) formic acid. HMW-GS are labeled with numbers according to the current nomenclature system [4].
LC-MS of the HMW-GS Enriched Fraction
A high-resolution ESI-QTOF instrument was used for LC-MS. No satisfactory LC-MS results were obtained when redissolved freeze-dried HMW-GS were used. Without reducing agent, the freeze-dried HMW-GS fraction did not dissolve well in organic solutions [50% (v/v) 1-propanol or 30% (v/v) ACN]. With reducing agent, the proteins did not result in identifiable HMW-GS peaks in the MS base peak chromatogram (BPC) in either of the organic solvents (results not shown). The latter was also reported by Mamone et al. when they analyzed redissolved freeze-dried glutenin reduced with DTT by LS-ESI-MS [23]. To avoid the risk of sample reoxidation and the subsequent need of a reducing agent for redissolving a freeze-dried sample, samples were vacuum-dried immediately after precipitation and superna-tant removal. For ESI-MS analysis of proteins it is advantageous to dissolve them in an acidified mixture of water and an organic solvent [12]. Here, the protein fraction was dissolved in 30% (v/v) ACN containing 0.4% (v/v) TFA (1 mg/mL), because this particular sample preparation generated stable mass spectra in MALDI-TOF-MS [7]. The dissolved HMW-GS fraction was applied to LC-MS using a C4 column at 60uC and the same
mobile phases, flow rate and gradient conditions as in regular RP-HPLC. A C4column was chosen to avoid the risk of sample loss,
and concomitant intensity loss in MS, as reported for C18columns
used for regular RP-HPLC [19]. The use of a C4column indeed
led to higher peak intensities compared to the standard C18
column (results not shown). The C4column had a slightly negative
effect on peak resolution compared to the standard column, but it provided a comparable protein pattern (Figures 2 and 3). Very low intensities were noted for the gliadin/LMW-GS fraction. Re-markably, high peak intensities were present for thev5-gliadins, despite their low abundance. The opposite was observed for HMW-GS, which had rather low peak intensities in the BPC (Figure 3). This illustrates the complex relationship between the amount of protein present and its measured signal intensity, which is still poorly understood [31]. In these experimental conditions, the concentration of HMW-GS in the sample had to be at least 0.6 mg/mL (with an injection level of 20mL) to obtain highly resolved mass spectra with a sufficient intensity for deconvolution. A protein appeared as a cluster of multiply charged ions (Figure 4), from which the Mrwas calculated by determining the charge state
of each signal (related-ion deconvolution, Table 2). Additionally, protein Mr was also determined with maximum entropy
deconvolution, which is based on a mathematical algorithm for subtracting electronic noise and calculating the most probable molecular weight [32]. The result is then presented as a simulated mass spectrum (insets in Figure 4). Both deconvolution techniques resulted in the same Mrfor each protein. For cvs. Akteur and
Apache, eight peaks could be distinguished in the BPC which represented nine major proteins in each cultivar (Figure 3, Table 2). For cv. Contra seven peaks represented eight proteins (Table 2). All HMW-GS of cvs. Akteur, Contra and Apache were identified with very high accuracy, by comparing the Mr of the
proteins in the BPC with the Mrof the HMW-GS as calculated
from their amino acid sequences (Table 3). In general, the average Mrs obtained in this study by LC-ESI-MS agreed better with the
molecular masses calculated from the known amino acid sequences in comparison to those obtained with MALDI-TOF MS by Gao et al. [9]. The strong agreement between measured and calculated Mrfurther implies that HMW-GS underwent little
if any post-translational modifications, which confirms previous research [33,34]. For subunit Dx3 from common wheat no amino acid sequence has been reported in literature. It was shown earlier that Dx3 shows sequence homologies with Dx subunits from
Aegilops tauschii(Tausch’s goatgrass), which has contributed the D genome in wheat [5,9]. However, the Mr of Dx3 found in this
study (87,207) clearly differs from the protein Mrs calculated from
theDx3t(87,655) andDx4t(86,666) genes ofAegilops tauschii[35]. Thus, the unique primary structure of wheat Dx3 remains to be elucidated. Most HMW-GS eluted as single peaks in the BPC, except for subunits 1 or 2* and 9 on the one hand; and 6 and 12 on the other hand. Besides the Mrs reported in Table 3 for cv.
Akteur, also proteins with Mr66,917 (Figure 4A) and 81,871 were
detected with lower intensities at retention times (RTs) 9.7 and 10.7 min, respectively. Most likely, these proteins had the same sequences as subunits 10 and 7 except from a deletion of about 6 amino acids in the C-terminal part, as reported previously [13,14]. The MS method appeared to be particularly sensitive for v -gliadins. Besides the high intensities of thev5-gliadins (Figure 3), also a protein with Mr41,863 was observed co-eluting with the
HMW-GS, although visual inspection of the SDS-PAGE gel (Figure 1) or the RP-HPLC chromatogram measured at 210 nm (Figure 2) showed no such proteins. Based on its Mrand RT, the
protein was identified as v1,2-gliadin, probably glutenin-bound [22,36]. Again, very small amounts of protein elicited higher intensities than the far more abundant HMW-GS.
The rather low signal intensities of HMW-GS in the BPC compared to other gluten proteins, such asv-gliadins, despite their
Table 4.Relative average molecular masses (Mr) and
corresponding proteins present in the isolated HMW-GS fractions of the cv. Akteur as determined by RP-HPLC-ESI-MS with the mobile phase containing 0.1% (v/v) formic acid.
RT (min) Mr1 Tentative identification2
5.4 48,871 (0.4) v5-gliadin
5.6 54,835 (0.6) v5-gliadin
5.8 54,950 (0.6) v5-gliadin
67,476 (0.6) HMW-GS Dy10
6.2 51,527 (0.4) v5-gliadin
87,697 (0.7) HMW-GS Ax1
6.6 (6.5–7.2) 82,529 (0.7) HMW-GS Bx7
73,519 (0.5) HMW-GS By9
7.5 (7.3–8.1) 88,114 (0.8) HMW-GS Dx5
8.6 42,744 (0.2) v1,2-gliadin
8.8 41,862 (0.4) v1,2-gliadin
9.0 13,275 (0.2) a-amylase inhibitor
9.3 40,891 (0.4) v1,2-gliadin
9.6 41,834 (0.6) v1,2-gliadin
9.8 40,953 (0.6) v1,2-gliadin
10.0 30,175 (0.6) LMW-GS
10.7 39,336 (0.4) LMW-GS
10.9 13,335 (0.2) a-amylase inhibitor
11.2 34,004 (0.6) a-gliadin
11.3–12 13,190 (0.3) a-amylase inhibitor
12.8 35,196 (0.5) c-gliadin
13.3 38,645 (0.5) c-gliadin
15.8 31,051 (0.6) c-gliadin
1Standard deviations are given between brackets. 2Based on M
ragreement with proteins from the wheat storage proteome [5,23,24,36].
abundance in the sample, might explain the previous difficulties in their detection with ESI-MS from a reduced glutenin sample [23]. Moreover, the used mobile phases, which resulted in an optimal separation in RP-HPLC, contained the strong acid TFA. The latter is known as a strong ion-pairing agent that decreases the ion yield and suppresses the MS signal, which leads to lower responses for analytes compared to formic acid in the mobile phase [37,38]. The next section addresses the effect of formic acid in the mobile phase on the chromatographic separation and MS intensities of the proteins in an isolated HMW-GS fraction.
Effect of TFA Versus Formic Acid on the
Chromatographic Separation and Mass Intensities
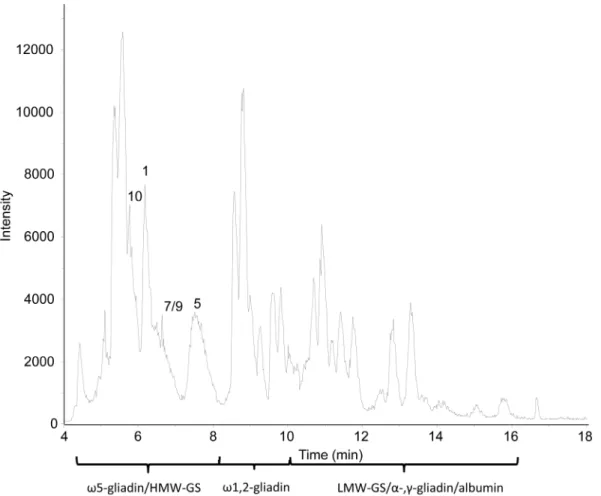
Figure 5 shows the BPC of the dissolved HMW-GS fraction of cv. Akteur after LC-MS using the C4 column under the same
conditions as in the previous measurements, except that the mobile phase contained 0.1% (v/v) formic acid instead of 0.1% (v/v) TFA. Both the overall peak intensities as well as the number of peaks were increased (Figure 5). To determine the exact retention order of gluten proteins when separated in the presence of formic acid, mass spectra of every peak in the BPC were deconvoluted into protein Mrs. The detected Mrs in the isolated HMW-GS
fraction of cv. Akteur are given in Table 4. When comparing Table 2 to 4, it is clear that more and other types of proteins were distinguished with formic acid instead of TFA in the mobile phase. Additional v5- andv1,2-gliadins were identified based on their Mrand RT. Other proteins were detected in the time interval
associated with the RT of LMW-GS,a-, andc-gliadins [22], and proteins were identified accordingly (Table 4). Also non-gluten proteins, such as a-amylase-inhibiting proteins, were recognized (Table 4). All these proteins formed the trace fraction (,4%) of other wheat proteins that co-precipitated during the isolation of
HMW-GS (Table 1) and could not be detected with SDS-PAGE (Figure 1). With formic acid in the eluent, the sensitivity of the MS detection clearly increased. This was also underlined by improved mass intensities of the detected proteins in the BPC. For example a twofold increase of intensity for thev5-type gliadins and even a 3-fold increase of intensity for HMW-GS Dx5 were observed (Figures 3 and 5).
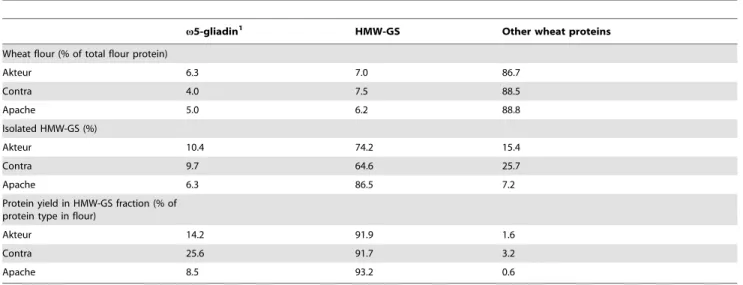
Nevertheless, the chromatographic separation of HMW-GS was worse when replacing TFA by formic acid in the mobile phase. Only subunit 5 appeared as a (broad) separate peak in the BPC (RT 7.3–8.1 in Figure 5). Subunits 7 and 9 co-eluted without forming clearly separated peaks in the BPC (RT 6.5–7.2 in Figure 5), whereas the elution range of subunits 1 and 10 overlapped with that ofv5-gliadins (Table 4). Due to this overlap, the identification of subunits 1 and 10 from the BPC with related-ion deconvolutrelated-ion was difficult, because their MS signals were suppressed by those of thev5-type gliadins which had higher MS intensities. Entropic deconvolution of the mass spectra taken from the average of scans under the peaks of thev5-gliadins revealed the location of the missing subunits, as illustrated in Figure 6. Similar observations were made for cvs. Contra and Apache, for which only subunits 2 and 3, respectively, could be identified in a separate peak. The other subunits also overlapped with thev 5-gliadins (results not shown). Despite the higher signal intensities, the chromatographic separation without the ion-pairing agent TFA was not sufficient to distinguish all HMW-GS separate from the other gluten protein types. Although the HMW-GS purity after isolation was high, the high signal intensities of other proteins present in low amounts interfered with the spectra of HMW-GS when no TFA was present in the mobile phase. Apparently, the excellent ion-pairing characteristics of TFA in the mobile phase were necessary, not only to separate the HMW-GS from the other
Figure 6. Mass spectra of wheat HMW-GS Ax1 andv5-gliadin.The spectra are taken from the average of scans under the peak with retention time 6.2 min from the base peak mass chromatogram after RP-HPLC-ESI-MS with 0.1% (v/v) formic acid in the mobile phase. The simulated mass spectra obtained by maximum entropy deconvolution are shown as insets.
wheat proteins, but also to separate the individual subunits from each other.
Conclusions
Intact HMW-GS can be identified from the wheat proteome by ESI-MS after isolation from flour, dissolution in water/ACN, and separation by RP-HPLC. A high resolution MS is required to obtain reliable values for the Mr of the proteins after deconvolu-tion. TFA rather than formic acid should be used in the mobile phase, because good chromatographic separation is a prerequisite to detect HMW-GS without interference of other protein types. Although they form only a minor fraction in HMW-GS isolates, but also in the wheat storage proteome,v-gliadins show a high response in LC-MS and can be detected with high sensitivity. Altogether, to detect HMW-GS from the wheat proteome, it is necessary to isolate or enrich HMW-GS from wheat flour beforehand to reach sufficient signal intensity in MS and to avoid
overlap with other wheat proteins during RP-HPLC. The present MS-compatible separation of intact HMW-GS allows MS fragmentation and fragment separation of each protein individu-ally and, hence, offers a basis for further top-down proteomics of the wheat storage proteome.
Acknowledgments
The authors would like to thank Sami Kaviani-Nejad (German Research Center for Food Chemistry, Freising, Germany) for excellent technical assistance and help with the MS measurements.
Author Contributions
Conceived and designed the experiments: BL MB. Performed the experiments: BL MB. Analyzed the data: BL MB IR. Contributed reagents/materials/analysis tools: PK. Wrote the paper: BL.
References
1. Delcour JA, Joye IJ, Pareyt B, Wilderjans E, Brijs K, et al. (2012) Wheat gluten functionality as a quality determinant in cereal-based food products. Ann Rev Food Sci Technol 3: 469–492.
2. Payne PI, Nightingale MA, Krattiger AF, Holt LM (1987) The relationship between HMW glutenin subunit composition and the bread-making quality of British-grown wheat-varieties. J Sci Food Agric 40: 51–65.
3. Di Stefano V, Avellone G, Bongiorno D, Cunsolo V, Muccilli V, et al. (2012) Applications of HPLC-MS for food analysis. J Chromatogr A 1259: 74–85. 4. Payne PI, Holt LM, Law CN (1981) Structural and genetic-studies on the
high-molecular-weight subunits of wheat glutenin.1. Allelic variation in subunits amongst varieties of wheat (Triticum-aestivum). Theor Appl Genet 60: 229–236. 5. Lagrain B, Rombouts I, Wieser H, Delcour JA, Koehler P (2012) A reassessment of the electrophoretic mobility of high molecular weight glutenin subunits of wheat. J Cereal Sci 56: 726–732.
6. Bean SR, Lookhart GL (2000) Electrophoresis of cereal storage proteins. J Chromatogr A 881: 23–36.
7. Zhang Q, Dong YM, An XL, Wang AL, Zhang YZ, et al. (2008) Characterization of HMW glutenin subunits in common wheat and related species by matrix-assisted laser desorption/ionization time-of-flight mass spectrometry (MALDI-TOF-MS). J Cereal Sci 47: 252–261.
8. Hickman DR, Roepstorff P, Shewry PR, Tatham AS (1995) Molecular weights of high-molecular-weight subunits of glutenin determined by mass-spectrometry. J Cereal Sci 22: 99–103.
9. Gao LY, Ma WJ, Chen J, Wang K, Li J, et al. (2010) Characterization and comparative analysis of wheat high molecular weight glutenin subunits by SDS-PAGE, RP-HPLC, HPCE, and MALDI-TOF-MS. J Agric Food Chem 58: 2777–2786.
10. Liu L, Wang AL, Appels R, Ma JH, Xia XC, et al. (2009) A MALDI-TOF based analysis of high molecular weight glutenin subunits for wheat breeding. J Cereal Sci 50: 295–301.
11. Kelleher NL, Lin HY, Valaskovic GA, Aaserud DJ, Fridriksson EK, et al. (1999) Top down versus bottom up protein characterization by tandem high-resolution mass spectrometry. J Am Chem Soc 121: 806–812.
12. Fenn JB, Mann M, Meng CK, Wong SF, Whitehouse CM (1989) Electrospray ionization for mass spectrometry of large biomolecules. Science 246: 64–71. 13. Cunsolo V, Foti S, Saletti R, Gilbert S, Tatham AS, et al. (2003) Structural
studies of glutenin subunits 1Dy10 and 1Dy12 by matrix-assisted laser desorption/ionisation mass spectrometry and high-performance liquid chroma-tography/electrospray ionisation mass spectrometry. Rapid Commun Mass Spectrom 17: 442–454.
14. Cunsolo V, Foti S, Saletti R, Gilbert S, Tatham AS, et al. (2004) Structural studies of the allelic wheat glutenin subunits 1Bx7 and 1Bx20 by matrix-assisted laser desorption/ionization mass spectrometry and high-performance liquid chromatography/electrospray ionization mass spectrometry. J Mass Spectrom 39: 66–78.
15. Qian YW, Preston K, Krokhin O, Mellish J, Ens W (2008) Characterization of Wheat Gluten Proteins by HPLC and MALDI TOF Mass Spectrometry. J Am Soc Mass Spectrom 19: 1542–1550.
16. Lutz E, Wieser H, Koehler P (2012) Identification of disulfide bonds in wheat gluten proteins by means of mass spectrometry/electron transfer dissociation. J Agric Food Chem 60: 3708–3716.
17. Stephenson JL, McLuckey SA, Reid GE, Wells JM, Bundy JL (2002) Ion/ion chemistry as a top-down approach for protein analysis. Curr Opin Biotechnol 13: 57–64.
18. Capriotti AL, Cavaliere C, Foglia P, Samperi R, Lagana A (2011) Intact protein separation by chromatographic and/or electrophoretic techniques for top-down proteomics. J Chromatogr A 1218: 8760–8776.
19. Wang Y, Balgley BM, Rudnick PA, Lee CS (2005) Effects of chromatography conditions on intact protein separations for top-down proteomics. J Chromatogr A 1073: 35–41.
20. Marchylo BA, Kruger JE, Hatcher DW (1989) Quantitative reversed-phase high-performance liquid chromatographic analysis of wheat storage proteins as a potential quality prediction tool. J Cereal Sci 9: 113–130.
21. Huebner FR, Bietz JA (1985) Detection of quality differences among wheats by high-performance liquid-chromatography. J Chromatogr 327: 333–342. 22. Wieser H, Antes S, Seilmeier W (1998) Quantitative determination of gluten
protein types in wheat flour by reversed-phase high-performance liquid chromatography. Cereal Chem 75: 644–650.
23. Mamone G, Ferranti P, Chianese L, Scafuri L, Addeo F (2000) Qualitative and quantitative analysis of wheat gluten proteins by liquid chromatography and electrospray mass spectrometry. Rapid Commun Mass Spectrom 14: 897–904. 24. Muccilli V, Cunsolo V, Saletti R, Foti S, Masci S, et al. (2005) Characterization of B- and C-type low molecular weight glutenin subunits by electrospray ionization mass spectrometry and matrix-assisted laser desorption/ionization mass spectrometry. Proteomics 5: 719–728.
25. Mamone G, Picariello G, Caira S, Addeo F, Ferranti P (2009) Analysis of food proteins and peptides by mass spectrometry-based techniques. J Chromatogr A 1216: 7130–7142.
26. McLafferty FW (2011) A Century of Progress in Molecular Mass Spectrometry. Annual Review of Analytical Chemistry, Vol 4 4: 1–22.
27. AOAC (1995) Official Methods of Analysis. Washington DC: AOAC. 28. Wieser H, Mueller KJ, Koehler P (2009) Studies on the protein composition and
baking quality of einkorn lines. Eur Food Res Technol 229: 523–532. 29. van Eckert R, Berghofer E, Ciclitira PJ, Chirdo F, Denery-Papini S, et al. (2006)
Towards a new gliadin reference material-isolation and characterisation. J Cereal Sci 43: 331–341.
30. Kasarda DD, Woodard KM, Adalsteins AE (1998) Resolution of high molecular weight glutenin subunits by a new SDS-PAGE system incorporating a neutral pH buffer. Cereal Chem 75: 70–71.
31. Aebersold R, Mann M (2003) Mass spectrometry-based proteomics. Nature 422: 198–207.
32. Ferrige AG, Seddon MJ, Jarvis S (1991) Maximum-entropy deconvolution in electrospray mass-spectrometry. Rapid Commun Mass Spectrom 5: 374–377. 33. Bollecker SSJ, Kaiser KP, Koehler P, Wieser H, Schofield JD (1998)
Re-examination of the glycosylation of high M-r subunits of wheat glutenin. J Agric Food Chem 46: 4814–4823.
34. Roels SP, Delcour JA (1996) Evidence for the non-glycoprotein nature of high molecular weight glutenin subunits of wheat. J Cereal Sci 24: 227–239. 35. Wang K, An XL, Pan LP, Dong K, Gao LY, et al. (2012) Molecular
characterization of HMW-GS1Dx3t
and1Dx4t
genes fromAegilops tauschiiand their potential value for wheat quality improvement. Hereditas 149: 41–49. 36. Dupont FM, Vensel WH, Tanaka CK, Hurkman WJ, Altenbach SB (2011)
Deciphering the complexities of the wheat flour proteome using quantitative two-dimensional electrophoresis, three proteases and tandem mass spectrometry. Proteome Science 9.
37. Apffel A, Fischer S, Goldberg G, Goodley PC, Kuhlmann FE (1995) Enhanced sensitivity for peptide-mapping with electrospray liquid-chromatography mass-spectrometry in the presence of signal suppression due to trifluoroacetic acid-containing mobile phases. J Chromatogr A 712: 177–190.