www.atmos-chem-phys.org/acp/5/1905/ SRef-ID: 1680-7324/acp/2005-5-1905 European Geosciences Union
Atmospheric
Chemistry
and Physics
Combustion characteristics of water-insoluble elemental and
organic carbon in size selected ambient aerosol particles
K. Wittmaack
GSF – National Research Centre for Environment and Health, Institute of Radiation Protection, 85758 Neuherberg, Germany Received: 1 March 2005 – Published in Atmos. Chem. Phys. Discuss.: 13 April 2005
Revised: 28 June 2005 – Accepted: 28 June 2005 – Published: 27 July 2005
Abstract.Combustion of elemental carbon (EC) and organic carbon (OC) contained in ambient aerosol matter was ex-plored using scanning electron microscopy (SEM) in combi-nation with energy dispersive X-ray analysis (EDX). To ease identification of the particles of interest and to avoid or at least reduce interaction with simultaneously sampled inor-ganic oxides and salts, the approach used in this work dif-fered in two ways from commonly applied procedures. First, rather than using a mixture of particles of vastly different sizes, as in PM10 or PM2.5, aerosol matter was collected in a 5-stage impactor. Second, the water soluble fraction of the collected matter was removed prior to analysis. Diesel soot particles, which appeared in the well-known form of chain-type aggregates, constituted the major fraction of EC. In con-trast, OC containing particles were observed in a variety of shapes, including a sizable amount of bioaerosol matter ap-pearing mostly in the size range above about 1µm. Dur-ing heatDur-ing in ambient air for 1 h, diesel soot particles were found to be stable up to 470◦C, but complete combustion oc-curred in a narrow temperature interval between about 480 and 510◦C. After diesel soot combustion, minute quantities of “ash” were observed in the form of aggregated tiny parti-cles with sizes less than 10 nm. These partiparti-cles could be due to elemental or oxidic contaminants of diesel soot. Combus-tion of OC was observed over a wide range of temperatures, from well below 200◦C to at least 500◦C. Incompletely burnt bioaerosol matter was still found after heating to 600◦C. The results imply that the EC fraction in aerosol matter can be overestimated significantly if the contribution of OC to a thermogram is not well separated.
Correspondence to:K. Wittmaack ([email protected])
1 Introduction
The purpose of this study was to extend the previous work with the aim of arriving at a detailed picture of the combus-tion characteristics of a variety of OC containing particles as well as of diesel soot, the latter often comprising the largest fraction of EC particulate matter. The results of such an in-vestigation might help to interpret the different peaks rou-tinely observed in thermograms of ambient aerosol matter at temperatures between 100 and 850◦C (Chow et al., 2001). A detailed peak assignment has not been possible in previous work.
The approach explored here differs in several ways from commonly used procedures for determining EC and OC in ambient aerosol matter. The standard approach is collect particles with aerodynamic diameters less than 10 or 2.5µm (PM10 or PM2.5, respectively) on quartz fibre filters (Hitzen-berger et al., 1999; Schmid et al., 2001; Mader et al., 2003; ten Brink et al., 2004) and to determine the combustion char-acteristics of the as-sampled aerosol matter, with or with-out determining the changes in optical transmission or re-flectance during the heating procedure (Cachier, 1998; Chow et al., 2001). EC and OC measurements on size fraction-ated aerosols collected in impactors are rare (Maenhaut et al., 2002). To the author’s knowledge, a detailed compari-son of the thermograms observed in different size ranges has only been reported once (Novakov et al., 2000).
The other difference to previous studies is that in this work the water soluble aerosol matter was extracted prior to anal-ysis and heat treatment. The procedure, tested (Wittmaack et al., 2002) and applied before (Wittmaack, 2004), has sev-eral advantages. First, many OC and EC containing particles, which may be covered by inorganic matter after prolonged sampling, become visible in SEM analysis. Second, combus-tion artefacts due to interaccombus-tion with inorganic matter (Chow et al., 2001) are removed or at least reduced. Related anal-yses on PM2.5 samples performed in the author’s laboratory by proton induced X-ray emission (PIXE), before and after soluble-matter extraction with water, revealed large to high solubility, not only for critical alkali elements (Novakov and Corrigan, 1995) like Na (∼90%) and K (∼60%) but also for transition elements like Zn (∼80%) and Fe (∼40%). Third, water soluble organic carbon (WSOC) is removed from the sample and may be analysed separately. The WSOC con-tains a significant fraction of medium-mass organic matter, often referred to as humic-like substances, HULIS (Kriv´acsy et al., 2000). The term, originally coined for organic mat-ter found in alkaline extracts of dust samples (Havers et al., 1998), is rather misleading. The mere fact that electrospray mass spectra of the extracted organic matter reveal a broad band of lines centred at about m/z 160 (Kriv´acsy et al., 2000) does not provide a justification for a wording that implies rea-sonably detailed knowledge of the composition of WSOC. Thorough electrospray mass spectrometric analyses of a va-riety of fulvic acids, the water soluble components of humic acids, revealed broad spectra extending from about m/z 100 to m/z 500 and beyond (Plancque et al., 2001). Similarly,
time-of-flight secondary ion mass spectra of solidified ful-vic acids were found to exhibit tails up to at least m/z 3000 (Szymczak et al., 2000). The proposed structure of fulvic acid molecules features a benezene ring substituted with car-boxyl groups and alkyl chains (Plancque et al., 2001).
In a study related to this work, Novakov et al. (2000) ex-amined the changes in the thermograms resulting from the re-moval of soluble matter in either acetone or water. A rather large (40 to 70%) loss of BC was observed with the water treated samples. A similar loss was not observed after ex-traction with acetone. The dislodgment of BC particles in water was tentatively attributed to the rapid dissolution of sulfate. It is worth noting that aerosol matter was collected on filters residing on perforated disks with holes having a diameter of 1 to 2 mm. Hence the sampled aerosol matter ac-cumulated to form a large set of hillock. This special feature might have been responsible for the particularly pronounced dislodgment of BC particles. In fact, a similar BC removal was never observed with normal uniform deposits on 37 or 47 mm quartz filters (Novakov, 2005)1.
2 Methods
In this study aerosol matter was sampled using a 5-stage Berner-type impactor (Hauke GmbH) operated at a flow rate of 80 l/min. The nozzles and the corresponding aerosol de-posits are arranged along a circle with a diameter of 50 mm. Annular aluminium foils, 12µm thick, with inner and outer diameters of 32 and 70 mm, respectively, served as impaction substrates. To avoid contamination problems during the sub-sequent analysis the foils were not greased. Sampling was carried out on the campus of GSF, located on the northern outskirts of Munich, during a 22.5 h period in May 2000.
The sampled aerosol deposits were treated as follows. The total mass of the aerosol deposits on each foil was first de-termined gravimetrically. Water-soluble matter was then re-moved by depositing the impaction foils face down in 10 ml of deionised water for 1 h. The concentration of inorganic ions was determined by ion chromatography (Wittmaack and Keck, 2004). After drying of the impaction foils, the mass of the residual water-insoluble deposits was also determined gravimetrically. The water extracts showed minor quantities of diesel soot particles dispersed in the solution. The esti-mated loss was well below 10%. Small sections containing between eight spots in stage 1 and one spot in stage 4 were cut from the impaction foils for separate heat treatment and analysis (for stage assignment, number of nozzles, nozzle di-ameter, and aerodynamic cut diameter see Fig. 1a). Each section was heated only once in ambient air, to temperatures between 200 and 600◦C, for 1 h. This procedure is some-what reminiscent of the two-step protocol used by Cachier et al. (1989) and the constant heat-rate protocol of Novakov
et al. (2000), both groups applying an oxidative environment from the beginning of sample heating. According to Cachier (1989) heating in an oxidative gas prevents charring due to pyrolysis of organic matter, a problem routinely encountered during intial heat treatment in pure helium. If charring had occurred in the experiments of this study, the produced black carbon (BC) should become observable as a distinct change of the carbon signal, at the same or almost the same temper-ature as EC.
Prior to SEM analysis the samples were covered with a conducting layer of sputter deposited platinum (nominal thickness 3 nm). SEM images were recorded using a model JSM-6300F scanning electron microscope (Jeol), equipped with a field emission electron gun operated at 5 kV. A model 6524 Si(Li) detector (Link Analytical) served for acquiring energy dispersive X-ray (EDX) spectra. To achieve optimum sensitivity for light elements, the detector was operated with an open window. EDX analysis was usually carried out while scanning the electron beam over an area of 60×42µm. Oc-casionally small-area analysis (4×3µm) was performed to determine the composition of individual mineral particles. For that purpose the beam energy was increased to 15 keV (window closed).
3 Results and discussion
3.1 Gross description of samples
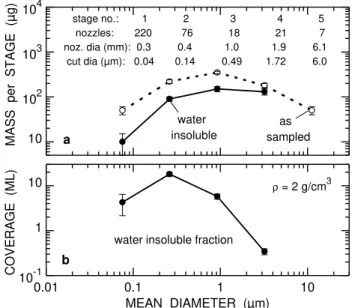
The size dependent differences between the aerosol deposits collected in the different impactor stages are illustrated in Fig. 1. The total mass after sampling ranged from 50 to 350µg per stage, the water insoluble mass from about 10 to 150µg (Fig. 1a). Different from stages 4 and 5, which contained a large amount of water insoluble mineral dust, the soluble fraction was typically 60% in stages 1–3 (mostly ammonium sulphate and nitrate). This result is in accordance with recent studies on PM2.5 matter (Wittmaack and Keck, 2004). Assuming that the residual insoluble aerosol mat-ter had a mean mass density of 2 g/cm3(Berner and Lrzer, 1980; Wittmaack, 2002a) and was uniformly distributed over an area equivalent of the respective nozzle area, the mean coverage per stage can be calculated in units of monolayers (ML), as shown in Fig. 1b (the thickness of one monolayer was set equal to the geometric mean aerodynamic diameter in the respective impactor stage). In stages 1 and 3 the de-posits were found to be about five ML thick, even thicker in stage 2 (about 18 ML), but only 0.3 ML in stage 4. Accord-ingly, the nominal areas of deposition should to be densely covered in stages 1–3, but only partially in stage 4. However, due to enhanced deposition near the jet axis, described in de-tail recently (Wittmaack, 2002b), the local thickness in the centre of the deposit was larger, possibly by up to a factor of two. The SEM and EDX data presented below are in accor-dance with this estimate. The fractional coverage in stage 5
10 102 103 104
a
stage no.: 1 2 3 4 5 nozzles: 220 76 18 21 7 noz. dia (mm): 0.3 0.4 1.0 1.9 6.1 cut dia (µm): 0.04 0.14 0.49 1.72 6.0
water insoluble
as sampled
MASS per STAGE (µ
g)
0.01 0.1 1 10
10-1 1 10
b
water insoluble fraction
ρ = 2 g/cm3
MEAN DIAMETER (µm)
COVERAGE (ML)
Fig. 1. Gross characterisation of the analysed aerosol samples in terms of(a)the mass per stage and(b)the mean number of layers in units of the mean particle diameter. The impactor specifications are listed in the top part of panel (a). For conversion of mass to mass concentration (µg/cm3), the data in panel (a) must be divided
by the volume of sampled air, i.e., 102 m3.
was found to be even smaller than in stage 4. Hence stage 5 was not included in the detailed analysis described below. 3.2 SEM analysis
Evidence for a significant concentration of diesel soot parti-cles in the ambient air at the GSF sampling site has already been presented before (Wittmaack, 2004; Wittmaack et al., 2005). Figure 2 shows examples of these densely packed carbon nanoparticles near the centre of deposits in impactor stage 4 (panel a, unheated; referred to as room temperature, RT) and stage 3 (panel b, after heating to 300◦C; in what fol-lows the term “after heating to” will be skipped for brevity, only the temperature of the heating cycle will be quoted). There is no detectable difference in the morphology of the nanoparticles for the RT and 300◦C samples. In the stage 3/510◦C sample (Fig. 2c), on the other hand, diesel soot par-ticles are no longer detectable, i.e. they have been lost by combustion. As a results the much larger mineral particles become clearly observable. EDX analysis showed that these particles are composed mostly of Si, Fe, and O, with addi-tional contributions due to K, Ti and Ca.
a
b
c
Fig. 2. SEM images showing diesel soot particles (a)in an as-prepared sample (stage 4),(b)after heating to 300◦C (stage 3) and
(c)to 510◦C (stage 3). The magnification is the same in all three panels.
in morphology of the two types of nanoparticles. Two high-resolution images of diesel soot particles observed at RT outside the central area of aerosol deposition in stages 1 and 2 are presented in Figs. 3a and b, respectively. Simi-lar chain aggregates have been described repeatedly (B´erub´e et al., 1999; Wentzel et al., 2003; Van Gulijk et al., 2004; Wittmaack, 2004). The important aspect to note with refer-ence to Figs. 3a and b is that the individual aggregated parti-cles feature distinctly different sizes, about 20 nm in panel a, but between 30 and 40 nm in panel b. Almost the same differ-ences in the size of diesel soot particles have been reported recently (Wentzel et al., 2003), but a reason for the difference could not be provided. More work appears to be necessary to fully understand the growth mechanism of diesel soot parti-cles. An emerging technique for advanced chemical charac-terisation of diesel soot is Raman microspectroscopy (Sadet-zky et al., 2005).
For comparison, the residues of combustion in stage 2/600◦C are shown in Fig. 3c. The individual particles in
a
b
c
Fig. 3
Fig. 3. High-resolution SEM images of diesel soot particles in as-prepared samples, (a)stage 1 and(b) stage 2. (c) Residues left behind in stage 2 after sample heating to 600◦C. The magnification is the same in all three panels.
the aggregates have sizes less than 10 nm. Owing to an es-timated resolution in the SEM analysis of 2–5 nm, the ac-tual size could well be less than 5 nm. Because of the very small amount of material contained in these particles, com-positional analysis is extremely difficult, if not impossible. EDX analysis at 5 keV showed very faint signals due to sili-con, barely above the bremsstrahlung background. The par-ticles could be the ash of diesel soot combustion. In fact, low concentrations of silicon in diesel soot have also been ob-served recently in transmission electron microscopy studies (Wentzel et al., 2003).
a
b
c
d
e
f
Fig. 4
Fig. 4.Low-resolution SEM image of stage-1 deposits,(a)RT (as-prepared), and after sample heating to different temperatures,(b)
200◦C,(c)400◦C,(d)440◦C,(e)480◦C, and(f)520◦C. The mag-nification is the same in all six panels.
has already been observed before with a different sample at 400◦C (Wittmaack, 2004), could be due to desorption or combustion of OC containing matter (see Sect. 3.3). After a further increase in temperature to 520◦C (f), the diesel soot particles have disappeared completely and only the residues discussed with reference to Fig. 3c are left behind. These findings imply that combustion of diesel soot EC in ambient air is characterised by a rather sharp threshold, somewhere between 490 and 510◦C.
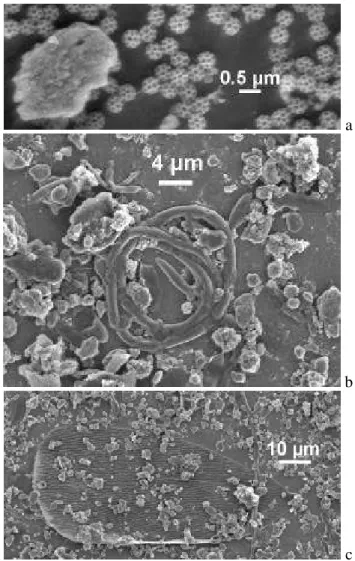
The concentration of diesel soot particles was found to be high in stages 1 and 2, intermediate in stage 3 and compara-tively low in stage 4. Concurrent with the decrease in diesel soot concentration, the contribution due to mineral particles increased (note again that water soluble matter had been re-moved). The aerosol matter collected in stage 4, however, ex-hibited a significant difference compared to stages 1–3. Stage 4 contained a large amount of material of biological origin. A few examples are presented in Fig. 5. The small spherical objects seen in Fig. 5a are known as brochosomes produced
a
b
c
Fig. 5
Fig. 5. Examples of bioaerosol matter observed in impactor stage 4,(a)brochosomes,(b)presumably a coiled hypha,(c)scale of an insect.
by insects. Recent studies revealed surprisingly high con-centrations of these bioaerosol particles in ambient air during the warm season (Wittmaack, 2005; Wittmaack et al., 2005). The coiled object in Fig. 5b could be a hypha, the product of a fungus; the huge, partially covered object in Fig. 5c is presumably the scale of an insect (Wittmaack et al., 2005).
a
b
c
Fig. 6.Other types of bioaerosol matter observed in impactor stage 4,(a)RT (as-prepared), and after sample heating to(b)430◦C and
(c)600◦C.
The results presented above imply that water-insoluble OC matter of biogenetic origin will be observed in thermograms over a wide range of temperatures, from below 300◦to 600◦C and more. Therefore, standard thermograms will be difficult to interpret, in particular when dealing with PM2.5 or even PM10 samples rather than with size fractionated matter. Ow-ing to the variability of the bioaerosol fraction in aerosol mat-ter, one would expect that PM samples collected during the warm season exhibit a more complex thermogram than sam-ples collected during the cold season.
3.3 EDX analysis
The results obtained by SEM imaging were substantiated by EDX compositional analysis. Owing to the complex mor-phology of the deposits and the differences in sample thick-ness, evaluation of absolute concentrations did not seem to be justified. Hence the elemental signals are discussed only in terms of the background corrected peak X-ray yields.
As an example, Fig. 7 shows the temperature dependence of the yields of C, O, Si, Al (all K-shell), and Pt (M-shell) for stage-1 aerosol deposits. In accordance with the SEM images
0 100 200 300 400 500 600
10 102 103 104
Al(blank) - Al
O
C Al
blank
5 keV e
-Si
Pt O
C
Al
40 - 140 nm
(Stage 1)
TEMPERATURE (°C)
X - RAY YIELD (counts)
Fig. 7.Temperature dependence of X-ray signals for stage-1 aerosol matter. The signals due to the conducting Pt layer are shown for comparison. The horizontal bars to the left indicate the signals mea-sured with a blank Al foil. The blank signal for Si was only 5±3 counts. The comparatively large Si-signal in an as-prepared section of the sample (23◦C) is probably due to a local contamination.
in Fig. 4, the C signal appears to remain essentially constant up to 440◦C, starts to decrease by about 30% at 480◦C and, between 480 and 520◦C, drops rapidly to the level measured with a blank Al substrate. Concurrently the Al signal in-creases almost to the blank level. There is, however, a differ-ence in that the Al signal exhibits an increase already at tem-peratures between about 300 to 400◦C. This change, which amounts to only about 5% of the blank level, is not detectable in the C data because relative changes of this magnitude are smaller than the statistical variations between different de-posits of the same impactor stage. Plotting the results for Al in the form of an [Al(blank) – Al] yield difference (diamonds with central crosses), the close correlation between the C and Al data becomes fully evident. The signals measured for O and Si were clearly above the blank level (by a factor of three to four), indicating that the water-insoluble aerosol deposits in stage 1 contained some non-EC matter, presumably min-eral oxides or OC (see below).
102 103 104
0.04-0.14 (St. 1) 0.14-0.49 (St. 2) 0.49-1.72 (St. 3) 1.72-6.0 (St. 4)
a
D (µm)Carbon
X-RAY YIELD (counts)
0 100 200 300 400 500 600
10 102 103
b
Aluminium
TEMPERATURE (°C)
Fig. 8.Comparison of the temperature dependence of X-ray signals measured in the four different size ranges specified at the top,(a)
carbon and(b)aluminium.
after heating to 480◦C. The tentative interpretation is that these losses are due to the combustion of water-insoluble OC contained in the aerosol sample. This OC is not evident in the form of particles identifiable by SEM. Instead the OC matter may be present in the form of a “hazy background” in the SEM images and possibly also as a thin layer on the diesel soot particles. Changes in morphology similar to those in Fig. 4 have previously been associated with the removal of adsorbed contaminants (Wittmaack, 2004).
The Al substrate signal was also detectable in stage 3 (open diamonds in Fig. 8b) even though the estimated thick-ness was quite large (∼1060µg/cm2). This apparent discrep-ancy is probably due to the fact that, owing to the compar-atively high concentration of mineral particles, the deposit contained a significant number of microscopic holes and clefts through which the beam could penetrate (Wittmaack et al., 2002). The high Al signal observed in stage 4, on the other hand, is due to the fact that the sample was only partially covered with various types of aerosol matter (see Figs. 5 and 6). The results for stages 3 and 4 indicate a sig-nificant loss of carbon at lower temperatures than in the case of stages 1 and 2. This difference is attribute to the increas-ing fraction of bioaerosol matter contained in the deposits.
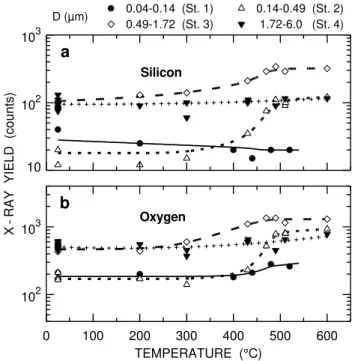
10 102 103
a
D (µm)Silicon
X
-RAY YIELD (counts)
0 100 200 300 400 500 600
102 103
0.04-0.14 (St. 1) 0.14-0.49 (St. 2) 0.49-1.72 (St. 3) 1.72-6.0 (St. 4)
b
TEMPERATURE (°C)
Oxygen
Fig. 9.The same as Fig. 8, but for(a)silicon and(b)oxygen.
In fact, a large loss of carbonaceous matter was observed in stage 4 already at 200◦C, see Fig. 8a. Even though diesel soot particles could be found in stage 4, the contribution to the total carbon content of the sample amounted to only a few percent so that the step-like combustion of EC around 500◦C got lost in the background signal. This finding may also be considered as evidence that charring of particles in stage 4 (and 3) was negligible.
The results for O and Si in Fig. 9 complete the picture outlined above. The small signals observed in stage 1 sug-gest that the concentration of mineral dust was quite small. In stage 4, on the other hand, most of the mineral particles were not covered with carbonaceous matter (see Figs. 5 and 6) so that the O and Si signals reflecting their presence exhib-ited only a rather small increase due to combustion related losses. These losses, however, are clearly evident in stages 2 and 3, and the temperature dependence is in accordance with the results in Fig. 8. The relative changes are consid-erably smaller than for Al, the reason being that the mineral particles producing the O and Si signals were presumably distributed fairly uniformly within the deposited layer so that a sizable fraction of these particles could be detected by the probing beam even before removal of carbonaceous matter by combustion.
3.4 Comparison with previous work
significant or event large amount of OC is removed at temper-atures between 350 and 470◦C or (even higher). The results in Fig. 8 substantiate this observation. Hence a combustion temperature of 340◦C, as used by Cachier et al. (1989), is much too low to fully separate BC from OC. Further sup-port in this respect comes from the fact that, in the “car-bon conference” round robin study (Schmid et al., 2001), the EC data reported by group #7 (using the Cachier method) were always well above the low-concentration set of data re-ported by other groups. The ”true” EC content of the anal-ysed samples might come close to the very low concentra-tions reported by group #8. The approach used by this group involved combustion in a helium/oxygen mixture at temper-atures up to 340◦C, followed by sample heating to 650◦C in (nominally) pure helium at 650◦C. All the carbon removed up to this step was ascribed to OC. BC was subsequently determined by combustion at 650◦C in helium/oxygen. The main uncertainty in this approach may be due to (i) the pres-ence of catalytic components in the aerosol matter surround-ing the carbonaceous substances and (ii) low-level oxygen impurities that could have contaminated the pure helium dur-ing the long-term (25-min) heatdur-ing procedure.
The thermograms reported by the Berkeley group (No-vakov et al., 2000; Kirchstetter et al., 2001) suggest that an appreciable amount of OC is released at the same tempera-ture as BC, i.e. between about 460 and 560◦C. Hence by way of fitting a Gaussian curve to the high-temperature end of the thermogram without accounting for an OC background one will overestimate the EC content. According to the re-sults described here, EC in the form of diesel soot particles exhibits combustion within a narrow temperature range (30– 40◦C), small compared to the half width of the nominal BC peak (80◦C) observed during heating at a rate of 20◦C/min. The high rate may mask some of the structure that could be-come observable at significantly lower heating rates.
Probably the most important problem associated with pre-vious attempts to distinguish between OC and EC in aerosol matter is due to sampling on filter, notably in the case of PM10 (Lavanchy et al., 1999; Mader et al., 2003). The complex mixture of inorganic compounds with carbonaceous matter in the form of nanoparticle combustion products, uncountable types of organic molecules and many differ-ent bioaerosols will result in very complex thermograms. The problem becomes evident from calibration experiments which showed, for example, that 11 to 17% of a humic acid test sample might be identified as EC (Lavanchy et al., 1999). Very severe positive OC artefacts, by as much as a factor of two, can occur in filter sampling due to the adsorption of am-bient organic gases (Kirchstetter et al., 2001; Mader et al., 2003). Such problems will be significantly reduced or even fully avoided by impactor sampling. The other big advantage of using impactors is that different types of carbonaceous matter (e.g. nanoaparticles and bioaerosols) will become rea-sonably well separated so that thermograms should become less difficult to interpret.
4 Conclusions
This study has provided further evidence that SEM in combi-nation with EDX is an indispensable tool for characterising ambient aerosol matter in terms of morphology, origin and combustion behaviour. To ease distinction between the OC and EC particles, initial removal of water soluble matter is highly advisable. Care needs to be taken to make sure that EC particles are not dislodged from the aerosol deposit to be-come suspended in the water. Analysis of the water-insoluble fraction of aerosol deposits collected in an impactor revealed very pronounced size dependent differences in composition. Carbonaceous matter was observed mostly in the form of diesel soot carbon nanoparticles (EC) and various types of material of biogenetic origin (OC). The diesel soot particles featured step-like combustion centred around 500◦C. Com-bined with gravimetric data, the SEM results suggest that the EC fraction in water-insoluble aerosol matter was very large (70%) in the size range below 140 nm and large be-low 500 nm. However, the estimated contribution to the total PM1.7 mass was small, i.e. only between 5 and 8%. Bioaerosols and other OC matter not fully identified by SEM disappeared by evaporation and combustion over a compar-atively wide range of temperatures, from below 200◦C to 500◦C or more. Some types of bioaerosol matter require combustion temperatures well above 600◦C. Carbon com-bustion signals due to these bioaerosols might missleadingly be attributed to EC.
Acknowledgements. Thanks are due to U. Heinzmann who pro-vided access to the scanning electron microscope, to H. Wehnes for skilfully taking the SEM images and the EDX spectra, and to J. Schnelle-Kreis for assistance with sampling.
Edited by: U. P¨oschl
References
Berner, A. and L¨urzer, C.: Mass size distributions of traffic aerosols at Vienna, J. Chem Phys., 84, 2079–2083, 1980.
B´erub´e, K. A., Jones, T. P., Williamson, B. J., Winters, C., Morgan, A. J., and Richards, R. J.: Physicochemical characterisation of diesel exhaust particles: Factors for assessing biological activity, Atmos. Environ., 33, 1599–1614, 1999.
Cachier, H., Bremond, M. P., and Buat-M´enard, P.: Determination of atmospheric soot carbon with a simple thermal method, Tellus 41B, 379–390, 1989.
Cachier, H.: Carbonaceous Combustion Aerosols, in: Atmospheric Particles, edited by: Harrison, R. M. and Van Grieken, R., John Wiley and Sons, Chichester, Chapter 9, 1998.
Chow, J., Watson, J. G., Crow, D., Lowenthal, D. H., and Merri-field, T.: Comparison of IMPROVE and NIOSH carbon mea-surements, Aerosol Sci. Technol., 34, 23–34, 2001.
Hitzenberger, R., Jennings, S. G., Larson, S. M., Dillner, A., Cachier, H., Galambos, Z., Rouc, A., and Spain, T. G.: Inter-comparison of measurement methods for black carbon aerosol, Atmos. Environ., 33, 2823–2833, 1999.
Ishiguro, T., Takatori, Y., and Akihama, K.: Microstructure of diesel soot particles probed by electrom micrscopy: First observation of inner core and outer shell, Combustion and Flame, 108, 231–234, 1997.
Kirchstetter, T. W., Corrigan, C. E., and Novakov, T.: Laboratory and field investigation of the adsorption of gaseous organic com-pounds onto quartz filter, Atmos. Environ., 35, 1663-1671, 2001. Kriv´acsy, Z., Kiss, G., Varga, B., Galambos, I., S´arv´ari, Z., Ge-lencs´er, A., Moln´ar, ´A., Fuzzi, S., Facchini, M. C., Zappoli, S., Andracchio, A., Alsberg, T., Hansson, H. C., and Persson, L.: Study of humic-like substances in fog and interstitial aerosol by size-exclusion chromatography and capillary electrophoresis, Atmos. Environ., 34, 4273–4281, 2000.
Lavanchy, V. M. H., G¨aggeler, H. W., Nyeki, S., and Baltensperger, U.: Elemental carbon (EC) and black carbon (BC) measurements with a thermal method and an aethalometer at the high-alpine research station Jungfraujoch, Atmos. Environ., 33, 2759–2769, 1999.
Mader, B. T., Schauer, J. J., Seinfeld, J. H., Flagan, R. C., Yu, J. Z., Yang, H., Lim, H.-J., Turpin, B. J., Deminter, J. T., Heidemann, G., Bae, M. S., Quinn, P., Bates, T., Eatough, D. J., Huebert, B. J., Bertram, T., and Howell, S.: Sampling methods used for the collection of particle-phase organic and elemental carbon during ACE-Asia, Atmos. Eniviron., 37, 1435–1449, 2003.
Moln´ar, A., M´esz´aros, E., Hansson, H. C., Karlsson, H., Gelencs´er, A., Kiss, G. Y., and Kriv´acsy, Z.: The importance of organic and elemental carbon in the fine atmospheric aerosol particles, Atmos. Environ., 33, 2745–2750, 1999.
Novakov, T. and Corrigan, C. E.: Thermal characterization of biomass smoke particles, Microchim. Acta, 119, 157–166, 1995. Novakov, T., Bates, T. S., and Quinn, P. K.: Shipboard measure-ments of concentrations and properties of carbonaceous aerosols during ACE-2, Tellus 52B, 228–238, 2000.
Plancque, G., Amekraz, B., Moulin, V., Toulhat, P., and Moulin, C.: Molecular structure of fulvic acids by electrospray with quadrupole time-of-flight mass spectrometry, Rapid Commun. Mass Spectrom., 15, 827–835, 2001.
Putaud, J.-P., Raes, F., Van Dingenen, R., Br¨uggemann, E., Fac-chini, M.-C., Decesari, S., Fuzzi, S., Gehrig, R., H¨uglin, C., Laj, P., Lorbeer, G., Maenhaut, W., Mihalopoulos, N., M¨uller, K., Querol, X., Rodriguez, S., Schneider, J., Spindler, G., ten Brink, H., Tørseth, K., and Wiedensohler, A.: A European aerosol phe-nomenology – 2: chemical characteristics of particulate matter at kerbside, urban, rural and background sites, Atmos. Environ., 38, 2579–2595, 2004.
Sadetzky, A., Muckenhuber, H., Grothe, H., Niessner, R., and P¨oschl, U.: Raman microspectroscopy of soot and related car-bonaceous materials: Spectral analysis and structural informa-tion, Carbon, 43, 1731–1742, 2005.
Schmid, H., Laskus, L., Abraham, H. J., Baltensperger, U., La-vanchy, V., Bizjak, M., Burba, P., Cachier, H., Crow, D., Chow, J., Gnauk, T., Even, A., ten Brink, H. M., Giesen, K.-P., Hitzen-berger, R., Hueglin, C., Maenhaut, W., Pio, C., Carvalho, A., Putaud, J.-P., Toom-Sauntry, D., and Puxbaum, H.: Results of the “carbon conference” international aerosol carbon round robin test stage I, Atmos. Environ., 35, 2111–2121, 2001.
Szymczak, W., Wolf, M., and Wittmaack, K.: Characteristation of fulvic acids and glycyrrhizic acid by time-of-flight secondary ion mass spectrometry, Acta Hydrochim. Hydrobiol., 28, 350–358, 2000.
Ten Brink, H., Maenhaut, W., Hitzenberger, R., Gnauk, T., Spindler, G., Even, A., Chi, X., Bauer, H., Puxbaum, H., Putaud, J.-P., Tursic, J., and Berner, A.: Intercomp2000: the comparability of methods in use in Europe for measuring the carbon content of aerosols, Atmos. Environ., 38, 6507–6519, 2004.
Van Gulijk, C., Marijnissen, J. C. M., Makkee, M., Moulijn, J. A., and Schmidt-Ott, A. : Measuring diesel soot with a scanning mo-bility particles sizer and an electrical low-pressure impactor: per-formance assessment with a model for fractal-like agglomerates, J. Aerosol Sci. 35, 633–655, 2004.
Wentzel, M., Gorzawski, H., Naumann, K.-H., Saathoff, H., and Weinbruch, S.: Transmission electron microscopical and aerosol dynamical characterization of soot aerosols, J. Aerosol. Sci., 34, 1347–1370, 2003.
Wittmaack, K.: Advanced evaluation of size-differential distribu-tions of aerosol particles, J. Aerosol Sci., 33, 1009–1025, 2002a. Wittmaack, K.: Impact and growth phenomena observed with sub-micrometer atmospheric aerosol particles collected on polished silicon at low coverage, Atmos. Environ. 36, 3963–3971, 2002b. Wittmaack, K., Menzel, N., Wehnes, H., and Heinzmann, U.: Phase separation and regrowth of aerosol matter collected after size fractionation in an impactor, Atmos. Environ., 36, 5877–5886, 2002.
Wittmaack, K. and Keck, L.: Thermodesorption of aerosol matter on multiple filters of different materials for a more detailed eval-uation of sampling artefacts, Atmos. Environ., 38, 5205–5215, 2003.
Wittmaack, K.: Characterization of carbon nanoparticles in ambient aerosols by electron microscopy and model calculations, J. Air Waste Manag. Assoc., 54, 1091–1098, 2004.
Wittmaack, K.: Brochosomes produced by leafhoppers – a widely unknown, yet highly abundant species of bioaerosols in ambient air, Atmos. Environ., 39, 1173–1180, 2005.