www.atmos-chem-phys.net/15/3097/2015/ doi:10.5194/acp-15-3097-2015
© Author(s) 2015. CC Attribution 3.0 License.
Chemical and stable carbon isotopic composition of PM
2
.
5
from
on-road vehicle emissions in the PRD region and implications for
vehicle emission control policy
S. Dai1,2, X. Bi1, L. Y. Chan1, J. He1,3, B. Wang3, X. Wang1, P. Peng1, G. Sheng1, and J. Fu1
1State Key Laboratory of Organic Geochemistry and Guangdong Key Laboratory of Environmental Resources Utilization
and Protection, Guangzhou Institute of Geochemistry, Chinese Academy of Sciences, Guangzhou 510640, China
2University of Chinese Academy of Sciences, Beijing 100049, China
3Institute of Atmospheric Environmental Safety and Pollution Control, Jinan University, Guangzhou 510632, China
Correspondence to:X. Bi ([email protected])
Received: 21 August 2014 – Published in Atmos. Chem. Phys. Discuss.: 20 November 2014 Revised: 16 February 2015 – Accepted: 17 February 2015 – Published: 18 March 2015
Abstract.Vehicle emissions are a major source of urban air pollution. In recent decade, the Chinese government has in-troduced a range of policies to reduce vehicle emissions. In order to understand the chemical characteristics of PM2.5
from on-road vehicle emissions in the Pearl River Delta (PRD) region and to evaluate the effectiveness of control policies on vehicle emissions, the emission factors of PM2.5
mass, elemental carbon (EC), organic carbon (OC), water-soluble organic carbon (WSOC), water-water-soluble inorganic ions (WSII), metal elements, organic compounds and sta-ble carbon isotopic composition were measured in the Zhu-jiang tunnel of Guangzhou, in the PRD region of China in 2013. Emission factors of PM2.5mass, OC, EC and WSOC
were 92.4, 16.7, 16.4 and 1.31 mg vehicle−1km−1 respec-tively. Emission factors of WSII were 0.016 (F−)∼4.17 (Cl−)mg vehicle−1km−1, contributing about 9.8 % to the PM2.5 emissions. The sum of 27 measured metal
ele-ments accounted for 15.2 % of PM2.5 emissions. Fe was
the most abundant metal element, with an emission fac-tor of 3.91 mg vehicle−1km−1. Emission factors of organic compounds includingn-alkanes, polycyclic aromatic hydro-carbons, hopanes and steranes were 91.9, 5.02, 32.0 and 7.59 µg vehicle−1km−1, respectively. Stable carbon isotopic composition δ13C value was−25.0 ‰ on average. An iso-topic fractionation of 3.2 ‰ was found during fuel combus-tion. Compared to a previous study in Zhujiang tunnel in 2004, emission factors of PM2.5mass, EC, OC, WSII except
Cl− and organic compounds decreased by 16.0∼93.4 %,
which could be attributed to emission control policy from 2004 to 2013. However, emission factors of most of the metal elements increased significantly, which could be partially at-tributed to the changes in motor oil additives and vehicle con-ditions. There are no mandatory national standards to limit metal content from vehicle emissions, which should be a con-cern of the government. A snapshot of the 2013 characteris-tic emissions of PM2.5and its constituents from the on-road
vehicular fleet in the PRD region retrieved from our study would be helpful for the assessment of past and future imple-mentations of vehicle emission control policy.
1 Introduction
differences in fuel qualities, engine conditions and opera-tion practices, the PM emissions from vehicles varied over regions and time.
The Pearl River Delta (PRD) region, located on the southern coast of China, has experienced serious atmo-spheric pollution with its rapid urbanization and industrial-ization in the last few decades. Vehicle emissions account for approximately 25∼30 % of total fine PM in the PRD region (http://epaper.southcn.com/nfdaily/html/2014-01/03/ content_7261687.htm). Peer-reviewed papers have reported emission factors and chemical characteristic of PM2.5from
vehicle emissions in the PRD region by means of tunnel studies in the Zhujiang (Guangzhou) and Wutong (Shen-zhen) tunnels (He et al., 2006, 2008; X. F. Huang et al., 2006). However, the sampling in these studies was conducted in 2004. The Environmental Protection Agency of Guang-dong revised the motor-vehicle-exhaust-pollution prevention and control regulations of Guangdong in 2008 and released the “PRD Regional Air Quality Management Plan” and “A Clean Air Plan” in 2010 to improve the relevant air quality through policies and measures. The emission standards for newly registered vehicles were tightened to China IV stan-dards and better-quality gasoline and diesel were supplied in 2013. Therefore, the characteristics of PM emissions from vehicles in the PRD region might have changed throughout these years.
Tunnel experiments and chassis dynamometer tests were widely used to measure various pollutants emitted from ve-hicles (He et al., 2006; Heeb et al., 2003). However, dy-namometer test is limited because it cannot account for vehi-cle fleet composition and emission characteristics related to break and tire wear and resuspension of road dust (Thorpe and Harrison, 2008). Tunnel studies have been demonstrated to be a suitable setup to measure PM emissions from on-road mixed fleets (Chiang and Huang, 2009; Laschober et al., 2004; Pio et al., 2013).
This study was carried out in a roadway tunnel located in the PRD region. We report here the emission factors of PM2.5
mass, organic carbon (OC), elemental carbon (EC), water-soluble inorganic ions (WSII), metal elements, water-water-soluble organic carbon (WSOC), organic compounds and stable car-bon isotopic composition. WSOC has the potential to modify the hygroscopicity of particles, PM size and cloud conden-sation nuclei activities (Shulman et al., 1996); however, it is often ignored in previous studies owing to the hydropho-bic nature of the organic aerosol from primary vehicle emis-sions. Stable carbon isotope (δ13C) is very useful for tracing sources (Lopez-Veneroni, 2009; Widory, 2006), and it was also less reported for vehicular exhaust emissions (Ancelet et al., 2011; Widory, 2006). The objectives of this study are (1) to obtain comprehensive information on the chemical and stable carbon isotopic composition of PM2.5emissions from
on-road vehicles in the PRD region; (2) to compare our re-sults with the previous study conducted in the same tunnel in 2004; (3) to evaluate the effectiveness of the implementation
of vehicle emission control policies from 2004 to 2013 in the PRD region. Although the fleet composition in this tunnel was probably different from the vehicle composition in the PRD region, it does not affect the conclusions in this paper.
2 Experimental
2.1 Tunnel sampling
PM2.5 samples were collected from 10 to 14 August 2013
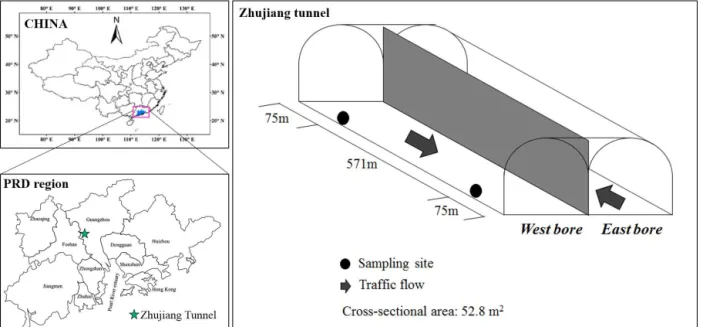
from the roadway tunnel (Zhujiang tunnel) located in Guangzhou, China. It has two bores, each of which has three lanes with traffic in the same direction, as shown in Fig. 1. Two high-volume PM2.5samplers (GUV-15HBL1, Thermo,
USA) were placed at a distance of 75 m from the entrance and 75 m from the exit. The vehicle speed in the Zhujiang tunnel was 18 to 45 km h−1, with an average vehicle speed of 33.4 km h−1during the sampling. The PM samples were collected at about 1.13 m3min−1 through the quartz fiber filters (QFFs, 20.3 cm×25.4 cm, Whatman). Other devices such as diffusion denuders and foam plugs were not used due to the difficulties in applying these devices. Consequently, volatilization losses or adsorption artifacts may occur on the filter for semi-volatile organic compounds, especially for the low molecular weight compounds due to their high volatility (Kavouras et al., 1999). However, the calculation of emis-sion factors was based on the concentration differences be-tween the exit and entrance of the tunnel; thus, the potential losses or adsorption artifacts of semi-volatile organic com-pounds would be partly deducted. Field blank samples were also collected by loading filters into the samplers but with-out pulling air through. The ventilation system of the tunnel was turned off during the sampling period; thus, the disper-sion of air pollutants in the tunnel was mainly due to the pis-ton effect arising from the traffic flow. The sampled filters were wrapped with annealed aluminum foil and stored in a refrigerator at−40◦C until analysis. The meteorological pa-rameters were synchronously recorded. A video camera was placed at the exit to record the passing vehicles during the sampling periods. The videotapes were then used to deter-mine the vehicle counts and to classify the vehicles into three categories, namely, diesel vehicles (DV) (heavy-duty trucks, light-duty trucks and large passenger cars), gasoline vehicles (GV) (small cars and motorcycles) and liquefied petroleum gas vehicles (LPGV) (buses and taxis). The average traffic density during sampling was 1797 per hour with DV, GV and LPGV proportions of 13.7±2.7 %, 59.8±8.8 % and 26.5±7.9 %, respectively. More details of the vehicle counts and meteorological conditions are summarized in Table S1 in the Supplement.
2.2 Chemical analysis
The PM2.5 mass concentrations were determined
sam-Figure 1.Sampling schematic diagram of the Zhujiang tunnel.
pling. The samples were conditioned in an electronic hy-grothermostat for 24 h at 25◦C and 50 % relative humidity
before weighing. Then, samples were analyzed for OC/EC, WSOC, WSII, metal elements, organic compounds and sta-ble carbon isotope. The experimental methods of the chemi-cal analysis are available in the Supplement.
2.3 Calculation of emission factor
Average emission factor was calculated for each sampling period on the basis of the concentration difference between the exit and entrance of the tunnel by the following equation (Handler et al., 2008):
EF=(Cout−Cin)V /N L,
where EF is the emission factor of a species in unit of mg vehicle−1km−1or µg vehicle−1km−1,N is the number of vehicles passing through the tunnel,Lis the distance be-tween inlet and outlet sampling locations,CoutandCin are
the measured species concentration at the tunnel outlet and inlet, respectively, andV is the corresponding air volume cal-culated from the cross-sectional area of the tunnel, the aver-age wind speed and the sampling duration of each filter. The average concentrations of all measured species at the inlet and outlet sampling locations and the corresponding emis-sion factors in this study are presented in Tables S2–4.
3 Results and discussion
3.1 Characteristics of PM2.5emissions from vehicles in
the PRD region
3.1.1 PM2.5mass, OC, EC, WSOC, WSII, metal
elements
The PM2.5 mass emission factors ranged from
79.8 to 107 mg vehicle−1km−1, with an aver-age of 92.4±8.9 mg vehicle−1km−1. Average OC and EC emission factors were 16.7±1.9 and 16.4±2.1 mg vehicle−1km−1, respectively, and they accounted for 18.1±2.1 and 17.7±2.2 % of PM2.5 mass emissions. The ratio of OC to EC in the Zhujiang tunnel ranged from 0.77 to 1.35, with an average of 1.03. Previous studies have shown that the OC/EC ratio is useful to separate gasoline engine emissions from diesel emissions. Higher values (> 2) are associated with GV and LPGV exhaust, and lower values (0.3 to∼0.9) are associated with DV exhaust (Cadle et al., 1999; Cheng et al., 2010; Gillies and Gertler, 2000). Therefore, the low OC/EC ratios in this study, which are closer to that from DV exhaust, indicate that diesel vehicles played an important role in the PM2.5
et al., 2008; Ho et al., 2006). At the outlet of the tunnel, the concentration of WSOC was 8.00 µg m−3, representing 17.9 % of OC. The WSOC had been reported to contribute on average 20 % to OC in the exit of Marseille roadway tun-nel (El Haddad et al., 2009), in which background influence was included. The calculated emission factor of WSOC in this study ranged from 0.5 to 2.8 mg vehicle−1km−1 with an average of 1.31 mg vehicle−1km−1, which represents 7.84 % of that of OC. Such a WSOC fraction is considerably lower than that previously measured for biomass burning particles (71 %) (Mayol-Bracero et al., 2002). However, it could influence the hygroscopicity of particles and the formation of secondary aerosols (Ho et al., 2006; Rogge et al., 1993b; Weber et al., 2007) and is worthy of more attention and in-depth research.
The sum of WSII comprised about 9.8 % of the PM2.5
emissions, with emission factors of 4.17, 0.104, 0.609, 2.88, 0.165, 0.177 and 0.953 mg vehicle−1km−1 for Cl−, NO−
3,
SO2−4 , Na+, NH+4, Mg2+and Ca2+, respectively. The other WSII had a minor contribution (< 0.1 mg vehicle−1km−1). In total, 27 measured metal elements contributed 15.2 % to the PM2.5emissions. Fe was the most abundant element, with
an emission factor of 3.91 mg vehicle−1km−1, followed by Na 3.53 mg vehicle−1km−1, Al 3.15 mg vehicle−1km−1, Ca 1.93 mg vehicle−1km−1, Mg 0.496 mg vehicle−1km−1 and K 0.338 mg vehicle−1km−1, which accounted for 4.2, 3.8, 3.4, 2.1, 0.5 and 0.4 % of PM2.5 mass emissions,
respec-tively. These six elements contributed 95.0 % to the total metal emissions. Emission factors of other metals ranged from 0.0001 (Ag) to 0.25 (Ba) mg vehicle−1km−1, with a sum of 0.71 mg vehicle−1km−1. It is worth noting that emis-sion factors of elements Na, K, Mg and Ca were signifi-cantly higher than those of their corresponding water-soluble parts (Table S3). The differences can be attributed to the water-insoluble matter carrying these metal elements, such as calcium and magnesium carbonates and Na-, K- and Mg-bearing aluminosilicate species (Pio et al., 2013).
PM2.5mass was also obtained by summing OM, EC,
ge-ological component, sea salt and major water soluble inor-ganic ions (NH+4, SO2−4 , NO−3). OC was multiplied by 1.4 to estimate mass of OM (He et al., 2008). The geological com-ponent of 35 mg vehicle−1km−1was estimated based on the Al emission data as presented in Table S3. A typical road dust Al composition is 9 % on average (Tiittanen et al., 1999). Sea salt of 9 mg vehicle−1km−1was estimated by Na, assuming sea salt contains 32 % of Na. Thus, the average PM2.5
recon-structed mass was 91.8 % of the gravimetric value. This dis-crepancy can be attributed to the uncertainties in the weigh-ing process, the estimation methods and uncalculated com-ponents.
3.1.2 Organic compounds
The average emission factors and abbreviated names of 67 individual organic compounds identified in the Zhujiang
tun-nel, includingn-alkanes, polycyclic aromatic hydrocarbons (PAHs), hopanes and steranes are listed in Table S4. These organic compounds accounted for 0.59 % of the OM and 0.11 % of the PM2.5mass emissions. The distributions of
or-ganic molecular markers associated with PM2.5 are known
to be source indicative despite their small mass fractions (Schauer et al., 1996; Simoneit, 1986).n-Alkanes are an im-portant class of organic compounds in atmospheric aerosols, and their homologue distribution may indicate different pol-lution sources (Rogge et al., 1993a). In this study, the n-alkane traces were dominated by C11–C36 with no odd–even carbon number predominance and the maximum was at C24, consistent with the characteristics of vehicle emissions re-ported by Simoneit (1984, 1985). The emission factors of individualn-alkanes were in the range of 0.22 (C13)∼13.3 (C24) µg vehicle−1km−1(Table S4).
There has been a worldwide concern to PAHs due to their known carcinogenic and mutagenic properties. PAHs are thought to be the result of incomplete combustion. In total, 15 priority PAHs (the results of naphthalene have not been discussed in this study due to its low recovery) were identified and quantified. The emission factor of total PAHs varied from 4.56 to 5.54 µg vehicle−1km−1 in this study. The emission factor of benzo[a]pyrene (BaP), which is often used as an indicator of PAHs and regarded by the World Health Organization as a good index for whole PAH carcinogenicity, was in the range of 0.37 to 0.46 µg vehicle−1km−1. The emission factors for other compounds ranged from 0.006 (acenaphthene) to 0.89 (pyrene) µg vehicle−1km−1 (Table S4). Pyrene (PYR)was the most abundant compound, followed by chrysene (CHR), benzo[ghi]perylene (BghiP) and benz[a]anthracene (BaA), which is different from biomass burning and coal combus-tion (Huang et al., 2014; Shen et al., 2012). PAHs diagnostic ratios have been used as a tool for identifying pollution emission sources including ANT/(ANT +PHE), FLA/ (FLA + PYR), BaA/(BaA+CHR), BbF/(BbF+BkF), IcdP/(IcdP+BghiP) and BaP/(BaP+BghiP) (To-biszewski and Namiesnik, 2012; Yunker et al., 2002; Zhang et al., 2005). We summarized PAH ratios mentioned above in Fig. 2 for three combustion sources including vehicle emissions, biomass burning and coal combustion. On the whole, the six ratios in this study are similar to the other tunnel experiments, though environmental conditions of tunnels are different to some extent. It is also suggested that the ratio of FLA/(FLA+PYR) and IcdP/(IcdP+BghiP) might be more suitable to distinguish vehicle emissions from biomass burning and coal combustion.
Figure 2. ANT/(ANT+PHE), FLA/(FLA+PYR), BaA/(BaA+CHR), BbF/(BbF+BkF), BaP/(BaP+BghiP) and IcdP/(IcdP+BghiP) ratios for three source emissions. ANT: anthracene, PHE: phenanthrene, FLA: fluoranthene, PYR: pyrene, BaA: benz[a]anthracene, CHR: chrysene, BbF: benzo[b]fluoranthene, BkF: benzo[k]fluoranthene, BaP: benzo[a]pyrene, BghiP: benzo[ghi]perylene, IcdP: indeno[cd]pyrene. The vehicle emission composition is from data collected in roadway tunnels (this study; He et al., 2006, 2008; Ancelet et al., 2011; Ho et al., 2009; Oda et al., 2001). The biomass burning profiles are obtained from nine straws (Shen et al., 2011), 26 firewood (Shen et al., 2012), three plant leaves and branches (Sheesley et al., 2003) and two biomass burning briquettes (Sheesley et al., 2003). The coal combustion profiles are obtained from the average value of PAH ratios from the combustion of five coals (Shen et al., 2011) and main coal-mining regions in China (Zhang et al., 2008).
of 0.46∼9.14 µg vehicle−1km−1 and 12 steranes homo-logues in the range of 0.31∼0.97 µg vehicle−1km−1 were identified in this study. 17α(H),21β(H)-hopane (HP30) was the most abundant component with the emission factor of 9.14 µg vehicle−1km−1. The emission factor of total hopanes was 32.0 µg vehicle−1km−1. Emissions of the S hopanes for the extended 17α(H),21β(H)-hopane homo-logues > C31 were always higher than those of the corre-sponding R pairs. All these characteristics of hopanes in the Zhujiang tunnel are consistent with those in gasoline and diesel exhausts (Rogge et al., 1993a; Simoneit, 1985) and in other tunnel studies (see Fig. S1 in the Supplement). Emission factors of individual sterane ranged from 0.31 to 0.97 ng vehicle−1km−1, and the sum of their emission fac-tors was 7.58 µg vehicle−1km−1. The most abundant homo-logue was C29αββ-stigmastane (20R) (29αββR), followed by 29αααS and 29αββS.
3.1.3 Stable carbon isotope
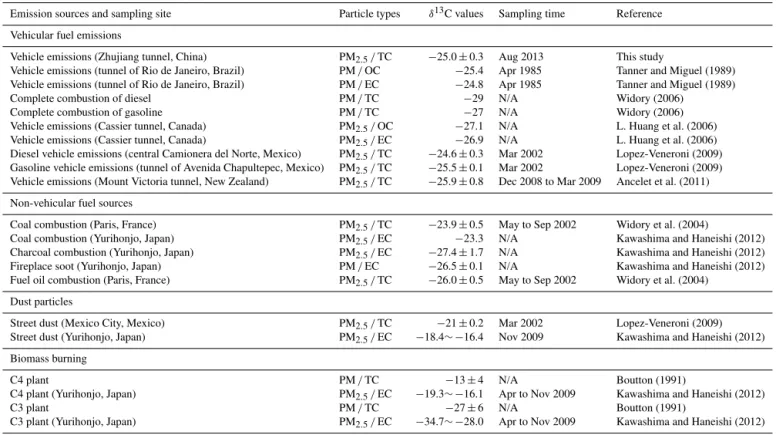
Stable carbon isotope analysis of vehicle emissions in Zhu-jiang tunnel yielded δ13C values ranging from −25.5 to −24.7 ‰ with an average value of −25.0±0.2 ‰ and is comparable to previously reported ranges of −29 to
−24.6 ‰ (Table 1) for vehicular fuel emissions. Generally, the variation inδ13CFuel could affect theδ13C of
hydrocar-bons (Keppler et al., 2004; Yamada et al., 2009). In the PRD region, theδ13C values of gasoline and diesel were on aver-age−28.6±0.6 ‰ and−27.8±0.2 ‰; small variations of fuelδ13C were observed (Hu et al., 2014). We calculated the isotopic differences betweenδ13CPM2.5 andδ
13C
Fuel, which
represent the apparent isotopic fractionation occurring dur-ing fuel burndur-ing. It expressed as113C (‰) and is defined by the following equation (Yamada et al., 2009).
113CPM2.5−Fuel=
δ13C
PM2.5+1000 δ13C
Fuel+1000 −1
×1000
In this study, the value of113CPM2.5−Fuel ranged from 2.7 to 3.5 ‰ with an average of 3.2 ‰, indicating that an iso-topic fractionation occurred during fuel combustion. Com-paring the stable isotopic carbon value of vehicular fuel emissions with other particulate emission sources (see Ta-ble 1), different emission sources showed different staTa-ble carbon isotopic composition. For total carbon in PM2.5
Table 1.δ13C values (‰) of PM from vehicle emissions in this study and other emission sources.
Emission sources and sampling site Particle types δ13C values Sampling time Reference
Vehicular fuel emissions
Vehicle emissions (Zhujiang tunnel, China) PM2.5/TC −25.0±0.3 Aug 2013 This study
Vehicle emissions (tunnel of Rio de Janeiro, Brazil) PM/OC −25.4 Apr 1985 Tanner and Miguel (1989) Vehicle emissions (tunnel of Rio de Janeiro, Brazil) PM/EC −24.8 Apr 1985 Tanner and Miguel (1989) Complete combustion of diesel PM/TC −29 N/A Widory (2006)
Complete combustion of gasoline PM/TC −27 N/A Widory (2006) Vehicle emissions (Cassier tunnel, Canada) PM2.5/OC −27.1 N/A L. Huang et al. (2006) Vehicle emissions (Cassier tunnel, Canada) PM2.5/EC −26.9 N/A L. Huang et al. (2006) Diesel vehicle emissions (central Camionera del Norte, Mexico) PM2.5/TC −24.6±0.3 Mar 2002 Lopez-Veneroni (2009) Gasoline vehicle emissions (tunnel of Avenida Chapultepec, Mexico) PM2.5/TC −25.5±0.1 Mar 2002 Lopez-Veneroni (2009) Vehicle emissions (Mount Victoria tunnel, New Zealand) PM2.5/TC −25.9±0.8 Dec 2008 to Mar 2009 Ancelet et al. (2011) Non-vehicular fuel sources
Coal combustion (Paris, France) PM2.5/TC −23.9±0.5 May to Sep 2002 Widory et al. (2004)
Coal combustion (Yurihonjo, Japan) PM2.5/EC −23.3 N/A Kawashima and Haneishi (2012) Charcoal combustion (Yurihonjo, Japan) PM2.5/EC −27.4±1.7 N/A Kawashima and Haneishi (2012) Fireplace soot (Yurihonjo, Japan) PM/EC −26.5±0.1 N/A Kawashima and Haneishi (2012) Fuel oil combustion (Paris, France) PM2.5/TC −26.0±0.5 May to Sep 2002 Widory et al. (2004)
Dust particles
Street dust (Mexico City, Mexico) PM2.5/TC −21±0.2 Mar 2002 Lopez-Veneroni (2009) Street dust (Yurihonjo, Japan) PM2.5/EC −18.4∼ −16.4 Nov 2009 Kawashima and Haneishi (2012) Biomass burning
C4 plant PM/TC −13±4 N/A Boutton (1991)
C4 plant (Yurihonjo, Japan) PM2.5/EC −19.3∼ −16.1 Apr to Nov 2009 Kawashima and Haneishi (2012)
C3 plant PM/TC −27±6 N/A Boutton (1991)
C3 plant (Yurihonjo, Japan) PM2.5/EC −34.7∼ −28.0 Apr to Nov 2009 Kawashima and Haneishi (2012)
Table 2.Vehicle emission standards and limits for PM and NOximplemented in Guangzhou after 2000.
Emission standard Yeara Limit for PM Limit for NOx
g km−1b g kWh−1c g km−1b g kWh−1c
China I 2001 0.14∼0.40 0.40∼0.68 – 8.0∼9.0
China II 2004 0.08∼0.20 0.15 – 7.0
China III 2007 0.05∼0.10 0.10∼0.21 0.15∼0.78 5.0 China IV 2010 0.025∼0.060 0.02∼0.03 0.08∼0.39 3.5
aYear of implementation;bfor light-duty vehicles;cfor compression ignition and gas-fueled positive ignition engines
of vehicles.
emissions is not significantly different from that of coal and fuel oil combustion. However, they are obviously different from other sources, like dust particles (−21∼ −18.4 ‰), C3 plants (−19.3∼ −13 ‰) and C4 plants (−34.7∼ −27 ‰). Therefore,δ13C might be used to distinguish the fossil fuel combustion from other sources.
3.2 Comparison to previous studies conducted in the
same tunnel
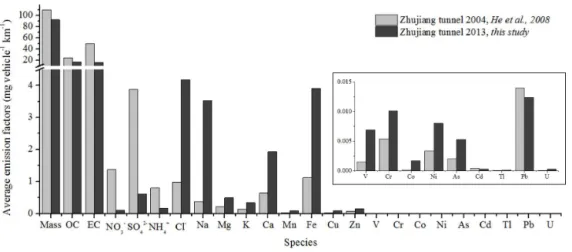
To investigate the variation of chemical emission characteris-tics from vehicles in the PRD region over the past decade, we compared the chemical emission characteristics of this study to that of previous study (He et al., 2008) for the same tunnel in 2004 (see Figs. 3 and 4). Figure 3 shows that PM2.5mass,
OC and EC decreased significantly from 2004 to 2013. The
reason can be partly attributed to the implementation of pol-lution control measures for Chinese vehicle emissions. Dur-ing this 9-year period, vehicle emission standards have raised two levels (from China II in 2004 to China IV in 2013) (Ta-ble 2). Additionally, comparing the fleet composition of 2013 to 2004 in Zhujiang tunnel, we found that the proportion of DV and GV decreased while LPGV increased. LPG is a type of clean energy, and LPGV is known to emit much less PM mass than GV and DV (Allen et al., 2001; Myung et al., 2014; Yang et al., 2007). LPG could be combusted more com-pletely than gasoline and diesel. Changes mentioned above contributed greatly to the decrease of emission factors of OC and EC (31.3 and 66.9 %) and PM2.5 mass (16.0 %) from
2004 to 2013. However, the emissions of PM2.5mass, OC
Table 3.Vehicle fuel standards and limits for sulfur content (mg kg−1)implemented in Guangzhou after 2000.
Standard China I China II China III China IV
limit yeara limit year limit year limit year
Gasoline 1000 2001 500 2005 150 2006 50 2010 Diesel 2000 2002 500 2003 350 2010 50 2013
LPG – – 270b 2003 – – 50 2013
aYear of implementation;bunit: mg m−3.
other countries (see Table S5). The implication of these high emission levels is that both the fuel quality and engine tech-nologies in the PRD region need to be further improved.
It is also found from Fig. 3 that emission factors of NO−3, SO2−4 and NH+4 decreased from 2004 to 2013. Improvement of fuel quality resulted in decreasing of sulfate emission fac-tor from 3.87 to 0.61 mg vehicle−1km−1, since the amount of sulfur in fuel is slashed by 81.5∼95 % in China IV (2013) compared to that in China II (2004) (Table 3). The emis-sion levels of nitrate and ammonium were about one-tenth of those observed in 2004, possibly because NOx emission
standards tightened from 2004 to 2013 (Table 2), leading to lower production of ammonium nitrate. The emission fac-tor of chloride is significantly higher than that obtained from Zhujiang tunnel in 2004 and other tunnels. Chloride was found up to 74 mg vehicle−1km−1 in PM10 in the Howell
tunnel due to the application of salt to melt ice on roadways in the winter (Lough et al., 2005). However, it is not appli-cable in Guangzhou. The good correlation between Cl−and Na+(r2=0.992) indicates that resuspension of sea salt par-ticles combined with vehicle emission PM might be a major source (He et al., 2008).
Emission factors of most of the metal elements increased in Zhujiang tunnel from 2004 to 2013 with the exception of Cd and Pb. Na emissions increased 3.16 mg vehicle−1km−1
in 2013 from 2004. Na correlated weakly with Cl− (r2=
0.374) and Na+ (r2=0.429). This indicates that Na
emis-sions had other sources and was not only from the resuspen-sion of sea salt particles. The other four most abundant ele-ments including Fe, Ca, Mg and K increased 1 to 3 times, probably because of resuspended road dust. However, the wind speed in 2013 was not found to be significantly higher than that in 2004 (3.8 m s−1in 2013 vs. 3.0 m s−1in 2004). This minor difference in wind speed could not account for the large increase. Furthermore, examination of the number of vehicles per hour in 2013 and 2004 suggests that there were fewer vehicles per hour in 2013. Therefore, a more plausi-ble explanation is that there was a lot more dust on the road in 2013. Other sources would also cause the increased emis-sions of these elements, such as oil additives (Mg, Ca, Cu, Zn) (Cadle et al., 1997), the wear of engines (Fe) (Cadle et al., 1997; Garg et al., 2000) and brakes and tires (Al, Fe,Cu, Mn, Cd, Ni, Pb and Zn) (Garg et al., 2000; Pio et al., 2013).
Additionally, emissions of Zn, Cu, Mn, Cr, Ni, V, As, Co, U and Tl increased 0.5 to 4.5 times. Although the sum of these elements did not exceed 0.5 % of PM2.5 mass, they
are important for health effects. Lower emission factors of Pb (0.01±0.0007 mg vehicle−1km−1)in 2013 than in 2004 could be a result of the phasing out of leaded gasoline across China in the late 1990s.
Figure 4 shows a comparison of organic compound emis-sions in Zhujiang tunnel between 2004 and 2013. The n-alkane homologues exhibited a smooth hump-like distribu-tion with the most abundance at C24, as shown in Fig. 4a. Such a distribution pattern was similar to patterns observed in Zhujiang tunnel in 2004. However, there are some dif-ferences. Firstly, the highest abundantn-alkane shifted from C23 in 2004 to C24 in 2013. This difference might be ex-plained by the shift of gas–particle partitioning as alka-nes of < C26 are semi-volatile. However, thet test showed that the temperatures were not significantly different (p= 0.14) between this study (33.0±2.3◦C) and that in 2004
(31.8±1.0◦C). Thus, the differences ofC
maxcannot be
re-garded as a result of temperature differences. Furthermore, Cmax was found to be C24 in every test of this study
al-though the temperature ranged from 28.6 to 36.1◦C. It was reported that then-alkane in the highest abundance was C20 for DV and C25 or C26 for GV in dynamometer tests (Rogge et al., 1993a; Schauer et al., 1999, 2002). As the emissions collected in tunnel studies present a composite result of emis-sions from a mixed vehicle fleet, the lower fraction of DV in 2013 was more likely the cause of the shift of Cmax.
dif-Figure 3.Comparison of PM2.5, OC, EC, WSII and metal emissions in Zhujiang tunnel sampling in 2004 and 2013.
Figure 4.Comparison of organic compounds emissions in Zhujiang tunnel sampling in 2004 and 2013.
ferent tunnel studies were very similar (see Fig. S1). This suggests that the hopane emission characteristics might be independent of the fleet composition. This is a reasonable result given that hopanes originate from the lubricating oil used in DV, GV and LPGV rather than from the fuel (He et al., 2008; Phuleria et al., 2006). Owing to the fact that more units in heavy-duty vehicles need lubrication, emission factors of hopanes attributable to heavy-duty vehicles were higher than those attributable to light-duty vehicles (Phule-ria et al., 2006). Reduction of the proportion of heavy-duty vehicles (buses, heavy-duty trucks, large passenger cars) in fleet composition in 2013 (11.3 %) compared to that in 2004 (20 %) might be the reason that emission factors of hopanes decreased.
3.3 Implications for vehicle emission control policy
Vehicle emission control strategies and policies adopted by Guangdong province can be classified as emission control on vehicles, fuel-quality improvements and alternative fuel uti-lization. PM emission standards for newly registered vehicles were tightened from China II in 2004 to China IV in 2013 (Table 2). The reduction of on-road high-PM-emitting vehi-cles, the phasing in of lower-PM-emitting vehicles and more environmentally friendly on-road vehicles with more ad-vanced engines following the implementation of these emis-sion standards were effective for decreasing PM emisemis-sions. Emission factors of PM decreased by 16 % from 2004 to 2013. Also for NOx, the emission limit was reduced to about
half from 2004 to 2013. This change in emission standards that limit NOx emissions is a major factor in the decrease
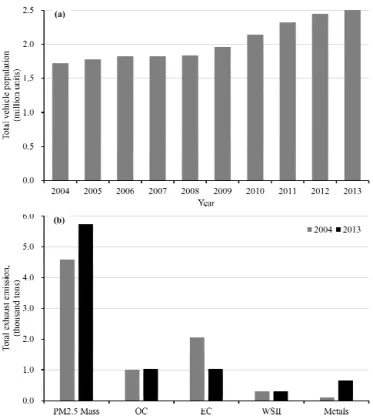
grad-Figure 5. (a)Growth in total vehicle population in Guangzhou dur-ing 2004–2013.(b) Total exhaust emissions of PM2.5 mass, OC,
EC, WSII and metal in 2004 and 2013.
ually taken the place of diesel and gasoline as the fuel of taxis and buses after 2004; these vehicles now seldom use diesel and gasoline as fuel (http://www.southcn.com/news/ gdnews/nanyuedadi/200707040173.htm). The application of clean fuel led to nearly complete combustion and resulted in much lower emissions from taxis and buses. In general, our results suggest that these strategies are effective to reduce emission factors of PM2.5 mass, as well as OC, EC, WSII
and organic compounds in PM2.5. However, the total
vehi-cle population increased year by year. As shown in Fig. 5a, the total vehicle population increased by 49.1 % from 2004 to 2013. Total emissions of vehicle exhaust of PM2.5 mass
(calculated as emission factors multiply by annual average driving distance per car and vehicle population; Wu et al., 2012) increased by 25.2 % from 2004 to 2013 (Fig. 5b). Con-sequently, it is demonstrated that more stringent emission standards are higher quality of fuel and more utilization of clean fuels are necessary to offset the impacts induced by the growth in vehicle population and to improve air quality in the PRD region. Additionally, owing to a lack of mandatory na-tional standards limiting metal content in vehicle emissions, the emissions of the majority of metals increased from 2004 to 2013 (Figs. 3 and 5b). In China, heavy metals, including As, Cr, Cu, Ni and Tl, are listed as key substances to be pref-erentially monitored in the atmospheric environment (SEPA, 2003); thus, the increase of metal elements should raise the awareness of the government due to their health concern.
4 Conclusions
PM2.5 samples were collected between 10 and 14 August
2013 in Zhujiang tunnel, Guangzhou, to acquire a compre-hensive snapshot of the chemical characteristics of vehicle emissions. The average emission factors of PM2.5mass, EC,
OC, WSOC, WSII, metal elements, organic compounds and stable carbon isotope were measured. Stable carbon isotope δ13C values indicate that an isotopic fractionation of 3.2 ‰ occurred during fuel combustion. Compared to a previous study in Zhujiang tunnel in 2004, emission factors of PM2.5
mass, EC, OC and major WSII decreased due to control-policy-induced changes from 2004 to 2013: change of fleet composition, implementation of more stringent gasoline and diesel emission standards, improvement in fuel quality and clean fuel used for taxis and buses. The shift inn-alkanes distribution and decreased PAHs emissions were due to the lower proportion of DV in 2013 than in 2004, and the de-crease in emission factors of hopanes was due to the re-duction of the proportion of heavy-duty vehicles. Our study shows that control polices for vehicles emissions by the gov-ernment were effective to decrease the emission factors of PM2.5, EC, OC and WSII from on-road vehicular fleets.
However, the increase in emissions of most metal elements should raise the awareness of the government, since metal el-ements, especially heavy metals, could affect human health. Also, in order to offset the impacts of the growth of the vehi-cle population and to improve air quality in the PRD region, more stringent and aggressive emission control policies are necessary.
The Supplement related to this article is available online at doi:10.5194/acp-15-3097-2015-supplement.
Acknowledgements. This work was supported by the “Strategic Priority Research Program (B)” of the Chinese Academy of Sciences (XDB05020205), the Foundation for Leading Talents from Guangdong province government and the National Nature Science Foundation of China (No. 41405131). J. Fu is grateful for the support of the “Team Project of the Guangdong Natural Science Foundation, China” (S2012030006604). This is contribution no. 2042 from GIGCAS.
Edited by: B. N. Duncan
References
Ancelet, T., Davy, P. K., Trompetter, W. J., Markwitz, A., and Weatherburn, D. C.: Carbonaceous aerosols in an urban tunnel, Atmos. Environ., 45, 4463–4469, 2011.
Boutton, T. W.: Stable carbon isotope ratios of natural materials II, Atmospheric, terrestial, marine, and freshwater environments, in: Carbon Isotope Techniques, edited by: Coleman D. C. and Fry B., Academic Press, San Diego, 173–186, 1991.
Cadle, S. H., Mulawa, P. A., Ball, J., Donase, C., Weibel, A., Sage-biel, J. C., Knapp, K. T., and Snow, R.: Particulate emission rates from in use high emitting vehicles recruited in Orange County, California, Environ. Sci. Technol., 31, 3405–3412, 1997. Cadle, S. H., Mulawa, P. A., Hunsanger, E. C., Nelson, K., Ragazzi,
R. A., Barrett, R., Gallagher, G. L., Lawson, D. R., Knapp, K. T., and Snow, R.: Composition of light-duty motor vehicle ex-haust particulate matter in the Denver, Colorado area, Environ. Sci. Technol., 33, 2328–2339, 1999.
Cheng, Y., Lee, S. C., Ho, K. F., Chow, J. C., Watson, J. G., Louie, P. K. K., Cao, J. J., and Hai, X.: Chemically-speciated on-road PM2.5motor vehicle emission factors in Hong Kong, Sci. Total
Environ., 408, 1621–1627, 2010.
Chiang, H. L. and Huang, Y. S.: Particulate matter emissions from on-road vehicles in a freeway tunnel study, Atmos. Environ., 43, 4014–4022, 2009.
Ding, X., Zheng, M., Yu, L. P., Zhang, X. L., Weber, R. J., Yan, B., Russell, A. G., Edgerton, E. S., and Wang, X. M.: Spatial and seasonal trends in biogenic secondary organic aerosol tracers and water-soluble organic carbon in the southeastern United States, Environ. Sci. Technol., 42, 5171–5176, 2008.
El Haddad, I., Marchand, N., Dron, J., Temime-Roussel, B., Quivet, E., Wortham, H., Jaffrezo, J. L., Baduel, C., Voisin, D., Be-sombes, J. L., and Gille, G.: Comprehensive primary particu-late organic characterization of vehicular exhaust emissions in France, Atmos. Environ., 43, 6190–6198, 2009.
Garg, B. D., Cadle, S. H., Mulawa, P. A., Groblicki, P. J., Laroo, C., and Parr, G. A.: Brake wear particulate matter emissions, Envi-ron. Sci. Technol., 34, 4463–4469, 2000.
Gillies, J. A., and Gertler, A. W.: Comparison and evaluation of chemically speciated mobile source PM2.5 particulate matter profiles, J. Air Waste Manage., 50, 1459–1480, 2000.
Handler, M., Puls, C., Zbiral, J., Marr, I., Puxbaum, H., and Lim-beck, A.: Size and composition of particulate emissions from motor vehicles in the Kaisermuhlen-Tunnel, Vienna, Atmos. En-viron., 42, 2173–2186, 2008.
He, L. Y., Hu, M., Huang, X. F., Zhang, Y. H., Yu, B. D., and Liu, D. Q.: Chemical characterization of fine particles from on-road vehicles in the Wutong tunnel in Shenzhen, China, Chemosphere, 62, 1565–1573, 2006.
He, L. Y., Hu, M., Zhang, Y. H., Huang, X. F., and Yao, T. T.: Fine particle emissions from on-road vehicles in the Zhujiang Tunnel, China, Environ. Sci. Technol., 42, 4461–4466, 2008.
Heeb, N. V., Forss, A. M., Saxer, C. J., and Wilhelm, P.: Methane, benzene and alkyl benzene cold start emission data of gasoline-driven passenger cars representing the vehicle technology of the last two decades, Atmos. Environ., 37, 5185–5195, 2003. Ho, K. F., Lee, S. C., Cao, J. J., Li, Y. S., Chow, J. C., Watson, J.
G., and Fung, K.: Variability of organic and elemental carbon, water soluble organic carbon, and isotopes in Hong Kong, At-mos. Chem. Phys., 6, 4569–4576, doi:10.5194/acp-6-4569-2006, 2006.
Ho, K. F., Ho, S. S. H., Lee, S. C., Cheng, Y., Chow, J. C., Wat-son, J. G., Louie, P. K. K., and Tian, L.: Emissions of gas- and particle-phase polycyclic aromatic hydrocarbons (PAHs) in the Shing Mun Tunnel, Hong Kong, Atmos. Environ., 43, 6343– 6351, 2009.
Hu, P., Wen, S., Liu, Y. L., Bi, X. H., Chan, L. Y., Feng, J. L., Wang, X. M., Sheng, G. Y., and Fu, J. M.: Carbon isotopic characteriza-tion of formaldehyde emitted by vehicles in Guangzhou, China, Atmos. Environ., 86, 148–154, 2014.
Huang, L., Brook, J. R., Zhang, W., Li, S. M., Graham, L., Ernst, D., Chivulescu, A., and Lu, G.: Stable isotope measurements of carbon fractions (OC/EC) in airborne particulate: A new dimen-sion for source characterization and apportionment, Atmos. En-viron., 40, 2690–2705, 2006.
Huang, W., Huang, B., Bi, X. H., Lin, Q. H., Liu, M., Ren, Z. F., Zhang, G. H., Wang, X. M., Sheng, G. Y., and Fu, J. M.: Emission of PAHs, NPAHs and OPAHs from residential honeycomb coal briquette combustion, Energ. Fuel., 28, 636–642, 2014. Huang, X. F., Yu, J. Z., He, L. Y., and Hu, M.: Size distribution
char-acteristics of elemental carbon emitted from Chinese vehicles: Results of a tunnel study and atmospheric implications, Environ. Sci. Technol., 40, 5355–5360, 2006.
Jin, T. S., Qu, L., Liu, S. X., Gao, J. J., Wang, J., Wang, F., Zhang, P. F., Bai, Z. P., and Xu, X. H.: Chemical characteristics of particu-late matter emitted from a heavy duty diesel engine and correla-tion among inorganic and PAH components, Fuel, 116, 655–661, 2014.
Kavouras, I. G., Lawrence, J., Koutrakis, P., Stephanou, E. G., and Oyola, P.: Measurement of particulate aliphatic and polynuclear aromatic hydrocarbons in Santiago de Chile: source reconcilia-tion and evaluareconcilia-tion of sampling artifacts, Atmos. Environ., 33, 4977–4986, 1999.
Kawashima, H., and Haneishi, Y.: Effects of combustion emissions from the Eurasian continent in winter on seasonal delta C-13 of elemental carbon in aerosols in Japan, Atmos. Environ., 46, 568– 579, 2012.
Keppler, F., Kalin, R. M., Harper, D. B., McRoberts, W. C., and Hamilton, J. T. G.: Carbon isotope anomaly in the major plant C1 pool and its global biogeochemical implications,
Biogeo-sciences, 1, 123-131, doi:10.5194/bg-1-123-2004, 2004. Kweon, C. B., Foster, D. E., Schauer, J. J., and Okada, S.: Detailed
chemical composition and particle size assessment of diesel en-gine exhaust, SAE Technical Paper Series, No. 2002-01-2670, doi:10.4271/2002-01-2670, 2002.
Laschober, C., Limbeck, A., Rendl, J., and Puxbaum, H.: Particu-late emissions from on-road vehicles in the Kaisermühlen-tunnel (Vienna, Austria), Atmos. Environ., 38, 2187–2195, 2004. Lopez-Veneroni, D.: The stable carbon isotope composition of
PM2.5and PM10in Mexico City Metropolitan Area air, Atmos.
Environ., 43, 4491–4502, 2009.
Lough, G. C., Schauer, J. J., Park, J. S., Shafer, M. M., Deminter, J. T., and Weinstein, J. P.: Emissions of metals associated with motor vehicle roadways, Environ. Sci. Technol., 39, 826–836, 2005.
composition and importance of the polyacidic fraction, J. Geo-phys. Res., 107, 8091, doi:10.1029/2001JD000522, 2002. Myung, C. L., Ko, A., Lim, Y., Kim, S., Lee, J., Choi, K., and Park,
S.: Mobile source air toxic emissions from direct injection spark ignition gasoline and LPG passenger car under various in-use vehicle driving modes in Korea, Fuel Process. Technol., 119, 19– 31, 2014.
Oda, J., Nomura, S., Yasuhara, A., and Shibamoto, T.: Mobile sources of atmospheric polycyclic aromatic hydrocarbons in a roadway tunnel, Atmos. Environ., 35, 4819–4827, 2001. Phuleria, H. C., Geller, M. D., Fine, P. M., and Sioutas, C.:
Size-resolved emissions of organic tracers from light-and heavy-duty vehicles measured in a California roadway tunnel, Environ. Sci. Technol., 40, 4109–4118, 2006.
Pio, C., Mirante, F., Oliveira, C., Matos, M., Caseiro, A., Oliveira, C., Querol, X., Alves, C., Martins, N., Cerqueira, M., Camoes, F., Silva, H., and Plana, F.: Size-segregated chemical composition of aerosol emissions in an urban road tunnel in Portugal, Atmos. Environ., 71, 15–25, 2013.
Rogge, W. F., Hildemann, L. M., Mazurek, M. A., Cass, G. R., and Simoneit, B. R. T.: Sources of Fine Organic Aerosol .2. Noncata-lyst and CataNoncata-lyst-Equipped Automobiles and Heavy-Duty Diesel Trucks, Environ. Sci. Technol., 27, 636–651, 1993a.
Rogge, W. F., Mazurek, M. A., Hildemann, L. M., Cass, G. R., and Simoneit, B. R. T.: Quantification of Urban Organic Aerosols at a Molecular-Level – Identification, Abundance and Seasonal-Variation, Atmos. Environ. A-Gen., 27, 1309–1330, 1993b. Schauer, J. J., Rogge, W. F., Hildemann, L. M., Mazurek, M. A.,
Cass, G. R., and Simoneit, B. R. T.: Source apportionment of airborne particulate matter using organic compounds as tracers, Atmos. Environ., 30, 3837–3855, 1996.
Schauer, J. J., Kleeman, M. J., Cass, G. R., and Simoneit, B. R. T.: Measurement of emissions from air pollution sources. 2. C-1 through C-30 organic compounds from medium duty diesel trucks, Environ. Sci. Technol., 33, 1578–1587, 1999.
Schauer, J. J., Kleeman, M. J., Cass, G. R., and Simoneit, B. R. T.: Measurement of emissions from air pollution sources. 5. C-1-C-32 organic compounds from gasoline-powered motor vehicles, Environ. Sci. Technol., 36, 1169–1180, 2002.
SEPA: State Environmental Protection Administration, Air And Waste Gas Monitor Analysis Method, China Environmental Sci-ence Press, Beijing, 4–12, 2003.
Sheesley, R. J., Schauer, J. J., Chowdhury, Z., Cass, G. R., and Si-moneit, B. R. T.: Characterization of organic aerosols emitted from the combustion of biomass indigenous to South Asia, J. Geophys. Res., 108, 4285, doi:10.1029/2002JD002981, 2003. Sheesley, R. J., Schauer, J. J., Zheng, M., and Wang, B.:
Sensitiv-ity of molecular marker-based CMB models to biomass burning source profiles, Atmos. Environ., 41, 9050–9063, 2007. Shen, G. F., Tao, S., Wang, W., Yang, Y. F., Ding, J. N., Xue, M.
A., Min, Y. J., Zhu, C., Shen, H. Z., Li, W., Wang, B., Wang, R., Wang, W. T., Wang, X. L., and Russell, A. G.: Emission of Oxy-genated Polycyclic Aromatic Hydrocarbons from Indoor Solid Fuel Combustion, Environ. Sci. Technol., 45, 3459–3465, 2011. Shen, G. F., Tao, S., Wei, S. Y., Zhang, Y. Y., Wang, R., Wang, B., Li, W., Shen, H. Z., Huang, Y., Chen, Y. C., Chen, H., Yang, Y. F., Wang, W., Wang, X. L., Liu, W. X., and Simonich, S. L. M.: Emissions of Parent, Nitro, and Oxygenated Polycyclic
Aro-matic Hydrocarbons from Residential Wood Combustion in Ru-ral China, Environ. Sci. Technol., 46, 8123–8130, 2012. Shulman, M. L., Jacobson, M. C., Carlson, R. J., Synovec, R. E., and
Young, T. E.: Dissolution behavior and surface tension effects of organic compounds in nucleating cloud droplets, Geophys. Res. Lett., 23, 277–280, 1996.
Simoneit, B. R. T.: Organic-Matter of the Troposphere .3. Charac-terization and Sources of Petroleum and Pyrogenic Residues in Aerosols over the Western United-States, Atmos. Environ., 18, 51–67, 1984.
Simoneit, B. R. T.: Application of Molecular Marker Analysis to Vehicular Exhaust for Source Reconciliations, Int. J. Environ. Anal. Chem., 22, 203–233, 1985.
Simoneit, B. R. T.: Characterization of Organic-Constituents in Aerosols in Relation to Their Origin and Transport - a Review, Int. J. Environ. Anal. Chem., 23, 207–237, 1986.
Song, S. J., Wu, Y., Jiang, J. K., Yang, L., Cheng, Y., and Hao, J. M.: Chemical characteristics of size-resolved PM2.5at a roadside
environment in Beijing, China, Environ. Pollut., 161, 215–221, 2012.
Tanner, R. L. and Miguel, A. H.: Carbonaceous Aerosol Sources in Rio De Janeiro, Aerosol Sci. Technol., 10, 213–223, 1989. Thorpe, A. and Harrison, R. M.: Sources and properties of
non-exhaust particulate matter from road traffic: A review, Sci. Total Environ., 400, 270–282, 2008.
Tiittanen, P., Timonen, K. L., Ruuskanen, J., Mirme, A., and Pekka-nen, J.: Fine particulate air pollution, resuspended road dust and respiratory health among symptomatic children, Eur Respir J, 13, 266–273, 1999.
Tobiszewski, M. and Namiesnik, J.: PAH diagnostic ratios for the identification of pollution emission sources, Environ. Pollut., 162, 110–119, 2012.
Wang, H. L., Zhuang, Y. H., Wang, Y., Sun, Y., Yuan, H., Zhuang, G. S., and Hao, Z. P.: Long-term monitoring and source apportion-ment of PM2.5/PM10 in Beijing, China, J. Environ. Sci-China,
20, 1323–1327, 2008.
Weber, R. J., Sullivan, A. P., Peltier, R. E., Russell, A., Yan, B., Zheng, M., de Gouw, J., Warneke, C., Brock, C., Hol-loway, J. S., Atlas, E. L., and Edgerton, E.: A study of secondary organic aerosol formation in the anthropogenic-influenced southeastern United States, J. Geophys. Res., 112, D13302, doi:10.1029/2007JD008408, 2007.
Widory, D.: Combustibles, fuels and their combustion products: A view through carbon isotopes, Combust. Theor. Model., 10, 831– 841, 2006.
Widory, D., Roy, S., Le Moullec, Y., Goupil, G., Cocherie, A., and Guerrot, C.: The origin of atmospheric particles in Paris: a view through carbon and lead isotopes, Atmos. Environ., 38, 953–961, 2004.
Wu, Y. Y., Zhao, P., Zhang, H. W., Wang, Y., and Mao, G. Z.: Assessment for Fuel Consumption and Exhaust Emissions of China’s Vehicles: Future Trends and Policy Implications, Sci. World J., 591343, 1–8, 2012.
Yamada, K., Hattori, R., Ito, Y., Shibata, H., and Yoshida, N.: Car-bon isotopic signatures of methanol and acetaldehyde emitted from biomass burning source, Geophys. Res. Lett., 36, L18807, doi:10.1029/2009GL038962, 2009.
before and after conversion of automobiles from gasoline power to liquefied petroleum gas/gasoline dual-fuel retrofits, Environ. Sci. Technol., 41, 8471–8476, 2007.
Yu, L. D., Wang, G. F., Zhang, R. J., Zhang, L. M., Song, Y., Wu, B. B., Li, X. F., An, K., and Chu, J. H.: Characterization and Source Apportionment of PM2.5in an Urban Environment in Beijing, Aerosol Air Qual. Res., 13, 574–583, 2013.
Yunker, M. B., Macdonald, R. W., Vingarzan, R., Mitchell, R. H., Goyette, D., and Sylvestre, S.: PAHs in the Fraser River basin: a critical appraisal of PAH ratios as indicators of PAH source and composition, Org. Geochem., 33, 489–515, 2002.
Zhang, X. L., Tao, S., Liu, W. X., Yang, Y., Zuo, Q., and Liu, S. Z.: Source diagnostics of polycyclic aromatic hydrocarbons based on species ratios: A multimedia approach, Environ. Sci. Tech-nol., 39, 9109–9114, 2005.