)mpact of the NYSE Shocks on the European Developed
Capital Markets
Ramona Dumitriu
rdumitriu@ugal.ro
Razvan Stefanescu
rstefanescu@ugal.ro
Dunarea de Jos University of Galati, Romania
This paper explores the impact of the large stock prices increases positive shocks and decreases negative shocks from the New York Stock Exchange on the returns and volatility of some European developed capital markets. We found that more than a half of shocks from these European stock markets were related to the shocks from US capital market. The results of GARC( models suggest that only the negative shocks from New York Stock Exchange increased the volatility of the European developed capital markets.
Keywords: Shocks, )nternational stock markets linkages, Volatility transmission JEL Classification: F , G , G
1. Introduction
The study of the linkages among international capital markets is useful from the perspective of stock prices prediction and of the financial risk management by international portfolio diversification. The significant positive correlation of stock returns is among the main premises of some models applied in the prediction of stocks returns. On the other hand, the international portfolio diversification strategies are based on the premise of weak linkages between the evolution of domestic and foreign assets prices Grubel, ; Levy & Sarnat, ; Grauer & (akansson, ; French & Poterba, ; De Santis & Gerard, . )n the last decades, the financial integration strengthened the linkages among the international capital markets Brennan & Cao, ; Stulz, ; Bekaert et al, ; Kaminsky & Schmukler, ; Goetzmann et al, ; Bekaert et al, . Obviously, this evolution increased the role of the prediction based on linkages between capital markets but hampered the international portfolio diversification strategies.
Together with the expected returns, the stock prices volatility is one of the main aspects of the decisions to invest in capital markets Poterba & Summers, ; French et al, ; Engle & Ng, ; Glosten et al, . )n the financial integration context, the volatility transmission among the international capital markets intensified (amao et al, ; King & Wadhwani, ; Solnik et al,
; Miyakoshi, .
Some researches focused on the particularities of the co-movement of international financial market in stressful circumstances. They found that, during turbulent periods, the linkages between international markets could suffer significant changes Lee & Kim, ; Forbes & Rigobon, ; Bae et al, ; Connolly & Wang, ; Barberis et al, ; Lasfer et al, ; Ehrmann, . The large stock prices increases or decreases, known as positive or negative shocks, are among the main symptoms of the turbulent periods. Such shocks could influence the investors, inducing them behaviors that are significantly different to those from quiet periods Longin & Solnik, ; Lasfer et al, ; Rigobon, ; Menezes & Dionísio, ; Charles & Darné, . )n these circumstances, a shock from an important international market, such as the New York Stock Exchange NYSE , which usually generates many breaking news in the international mass media, could significantly affects the returns and the volatility of other developed and emerging markets.
Average DJ)A , one of the most representative indexes of NYSE, on the returns and volatility of some indexes from European developed capital markets.
The rest of the paper is organized as follows: the second part describes the data and methodology employed to investigate the impact of NYSE shocks on European developed capital markets, the third part presents the empirical results and the fourth part concludes.
2. Data and Methodology
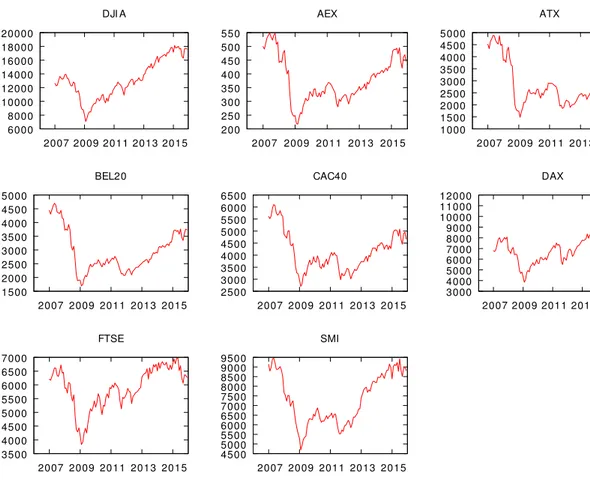
)n our investigation on the impact of NYSE shocks on the European capital developed markets we employ the closing daily values of eight indexes: Dow Jones )ndustrial Average DJ)A from NYSE, AEX from the Euronext Amsterdam, ATX from the Vienna Stock Exchange, BEL from Euronext Brussels, CAC from the Euronext Paris, DAX from the Frankfurt Stock Exchange, FTSE from the London Stock Exchange and SM) from S)X Swiss Exchange. The sample of data, provided by Yahoo! Finance, covers the period January – December . During this period for all the eight stock markets theascendant and descendant trends alternated Figure .
6 0 0 0 8 0 0 0 1 0 0 0 0 1 2 0 0 0 1 4 0 0 0 1 6 0 0 0 1 8 0 0 0 2 0 0 0 0
2 0 0 7 2 0 0 9 2 0 1 1 2 0 1 3 2 0 1 5 DJI A
2 0 0 2 5 0 3 0 0 3 5 0 4 0 0 4 5 0 5 0 0 5 5 0
2 0 0 7 2 0 0 9 2 0 1 1 2 0 1 3 2 0 1 5 AEX
1 0 0 0 1 5 0 0 2 0 0 0 2 5 0 0 3 0 0 0 3 5 0 0 4 0 0 0 4 5 0 0 5 0 0 0
2 0 0 7 2 0 0 9 2 0 1 1 2 0 1 3 2 0 1 5 ATX
1 5 0 0 2 0 0 0 2 5 0 0 3 0 0 0 3 5 0 0 4 0 0 0 4 5 0 0 5 0 0 0
2 0 0 7 2 0 0 9 2 0 1 1 2 0 1 3 2 0 1 5 BEL2 0
2 5 0 0 3 0 0 0 3 5 0 0 4 0 0 0 4 5 0 0 5 0 0 0 5 5 0 0 6 0 0 0 6 5 0 0
2 0 0 7 2 0 0 9 2 0 1 1 2 0 1 3 2 0 1 5 CAC4 0
3 0 0 0 4 0 0 0 5 0 0 0 6 0 0 0 7 0 0 0 8 0 0 0 9 0 0 0 1 0 0 0 0 1 1 0 0 0 1 2 0 0 0
2 0 0 7 2 0 0 9 2 0 1 1 2 0 1 3 2 0 1 5 DAX
3 5 0 0 4 0 0 0 4 5 0 0 5 0 0 0 5 5 0 0 6 0 0 0 6 5 0 0 7 0 0 0
2 0 0 7 2 0 0 9 2 0 1 1 2 0 1 3 2 0 1 5 FTSE
4 5 0 0 5 0 0 0 5 5 0 0 6 0 0 0 6 5 0 0 7 0 0 0 7 5 0 0 8 0 0 0 8 5 0 0 9 0 0 0 9 5 0 0
2 0 0 7 2 0 0 9 2 0 1 1 2 0 1 3 2 0 1 5 SMI
Figure 1 - Evolutions of eight indexes between and
For each index, we compute the simple return Ri,t , expressed in percents, by the formula:
100
1 , 1 , , ,×
−
=
− − t i t i t i t iP
P
P
R
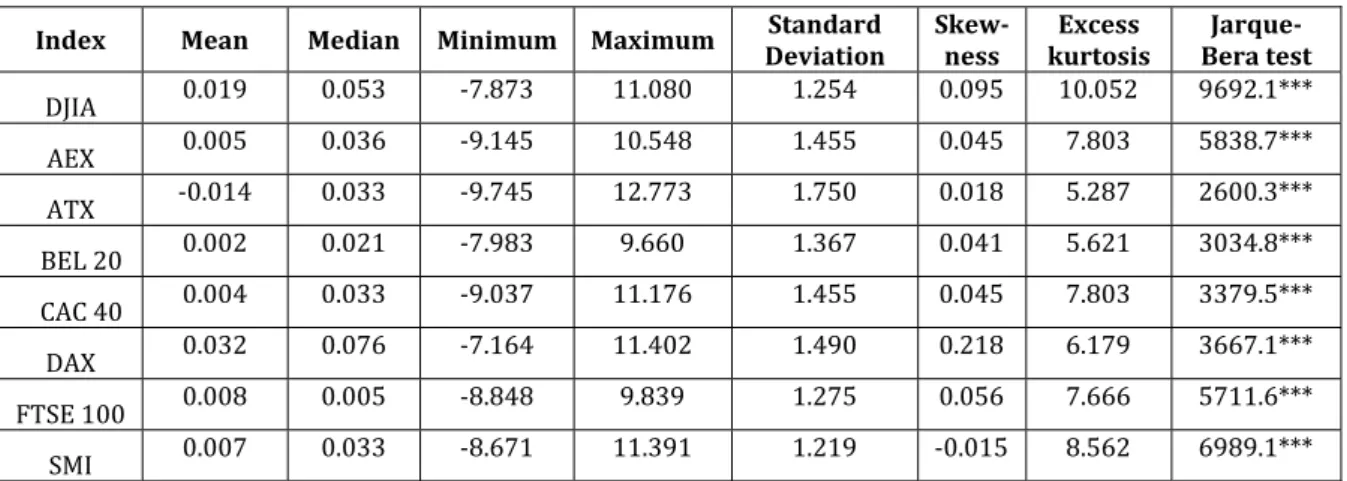
Table 1 – Descriptive statistics of the eight indexes simple returns
Index Mean Median Minimum Maximum Standard Deviation
Skew- ness
Excess kurtosis
Jarque-Bera test
DJ)A . . - . . . ***
AEX . . - . . . ***
ATX - . . - . . . ***
BEL . . - . . . ***
CAC . . - . . . ***
DAX . . - . . . ***
FTSE . . - . . . ***
SM) . . - . . . - . . . ***
The descriptive statistics of the eight indexes simple returns reveal some differences among them. DAX and DJ)A have the largest averages of the returns, while the mean for the ATX returns is negative. ATX and DAX experienced the largest volatility, while DJ)A and SM) have the smallest standard deviations. The values of the Jarque-Bera test suggest the non-normality of the returns for all eight indexes Table .
For each index, we consider that a positive shock occurs when the simple return is larger than %, while a negative shock occurs when the simple return is lower than - %. We consider that a shock from a European capital market is related to a shock from NYSE that occurs in the same days or preceded it by less than two working days.
We investigate the impact of NYSE shocks on the volatility of seven European capital markets by GARC( models with two dummy variables:
- PSt, taking value one if in the day t a positive shock occurs on NYSE and zero otherwise; - NSt, taking value one if in the day t a negative shock occurs on NYSE and zero otherwise.
We test the stationarity of the eight indexes returns using Augmented Dickey – Fuller ADF unit root tests with intercept asdeterministic term Dickey & Fuller, . The number of lags of ADF regressions is chosen by Akaike )nformation Criteria. The classic GARC( model includes two equations expressing the conditional mean and the conditional variance equation Engle, ; Bollersev, .
The first equation has the form:
t n
k
EUR k t i k t
t EUR
t
i
PS
NS
R
R
=
µ
+
µ
×
+
µ
×
+
∑
ξ
+
ε
=
−
1
, 2
1 0
,
(
*
)
where:
- EUR t i
R
, is the simple return of the European index i;- is a constant term;
- is a coefficient which reflects the impact of the positive shocks on the EUR t i
R
, ;- is a coefficient which reflects the impact of the negative shocks on the
R
iEUR,t ;- k is a coefficient of the k-order lagged simple returns of the European index; - n represents the number of lagged simple returns of the European index; - εt is the error term.
)
*
(
*
21 1
2 2
1 2
, l t l
p
l q
k
k t k t
t t
i
PS
NS
−= =
−
∑
∑
+
+
×
+
×
+
=
ω
ν
ν
α
ε
β
σ
σ
where:
- 2
t
σ
is the conditional variance of theR
iEUR,t ;- ω is a constant term;
- is a coefficient which reflects the impact of the positive shocks on the EUR t i
R
, volatility;- is a coefficient which reflects the impact of the negative shocks on the EUR t i
R
, volatility;- k k = , , …q are the coefficients associated to the squared values of error term lagged values from the conditional mean equation;
- q is the number of error term lagged values;
- l l = , , …p are coefficients associated to the lagged values of the conditional variance; - p is the number of lagged values of conditional variance.
The values of q and p are chosen by Akaike )nformation Criteria.
For each GARC( model we investigate the presence of the ARC( in the errors by performing Lagrange Multiplier LM tests.
3. Empirical Results
The numbers of shocks identified for DJ)A and the seven European indexes are presented in the Table . The positive and negative shocks from DJ)A are less numerous than those from the European indexes.
Table 2 - Positive and negative shocks identified for the eight indexes
Index Positive shocks Negative shocks
DJ)A AEX ATX BEL CAC
DAX FTSE
SM)
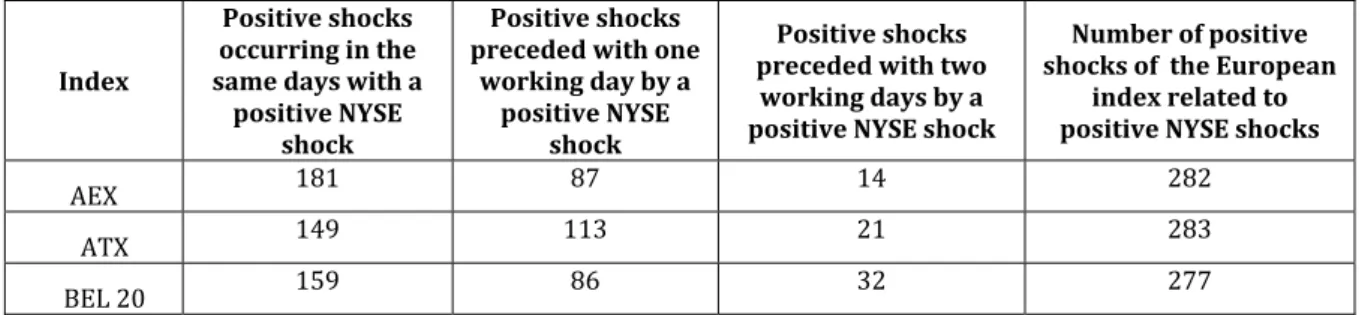
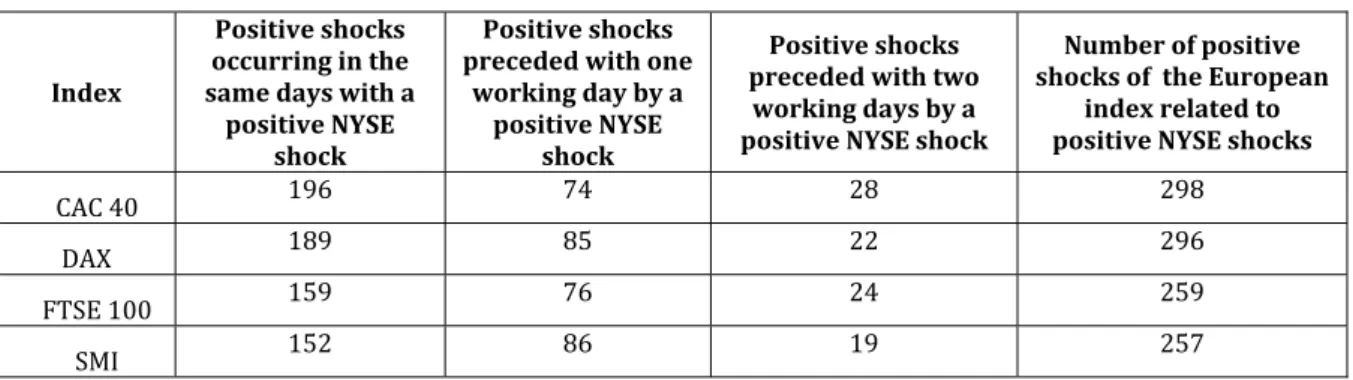
For each European index, we found that more than a half of the positive shocks were related to positive DJ)A shocks Table . Most of them occurred in the same days with the shocks from US capital market.
Table 3 - Positive shocks of European indexes related to positive NYSE shocks
Index
Positive shocks occurring in the same days with a positive NYSE
shock
Positive shocks preceded with one
working day by a positive NYSE
shock
Positive shocks preceded with two
working days by a positive NYSE shock
Number of positive shocks of the European
index related to positive NYSE shocks
Index
Positive shocks occurring in the same days with a positive NYSE
shock
Positive shocks preceded with one
working day by a positive NYSE
shock
Positive shocks preceded with two
working days by a positive NYSE shock
Number of positive shocks of the European
index related to positive NYSE shocks
CAC DAX FTSE
SM)
More than a half of the negative shocks of European indexes are related to negative NYSE shocks Table . Most of them occurred in the same days with the negative shocks of DJ)A.
Table 4 - Negative shocks of European indexes related to negative NYSE shocks
Index
Negative shocks occurring in the same days with a negative NYSE
shock
Negative shocks preceded with one
working day by a negative NYSE
shock
Negative shocks preceded with two
working days by a negative NYSE shock
Number of negative shocks of the European
index related to negative NYSE shocks
AEX ATX BEL CAC
DAX FTSE
SM)
The results of the ADF tests, presented in the Table , indicate the stationarity of the eight indexes returns.
Table 5 - Results of ADF tests for the indexes returns
Index Number of lags Test statistics
DJ)A - . ***
AEX - . ***
ATX - . ***
BEL - . ***
CAC - . ***
DAX - . ***
FTSE - . ***
SM) - . ***
Note: *** means significant at . level.
Table 6 - Coefficients of the GARC( conditional mean equations
Index 0 1 2 1
AEX . ***
.
. *** .
- . *** .
x
ATX .
.
. *** .
- . *** .
. **
.
BEL . **
.
. *** .
- . *** .
x
CAC . ***
.
. *** .
- . *** .
x
DAX . ***
.
. *** .
- . *** .
x
FTSE . **
.
. *** .
- . *** .
x
SM) . **
.
. *** .
- . *** .
. *** .
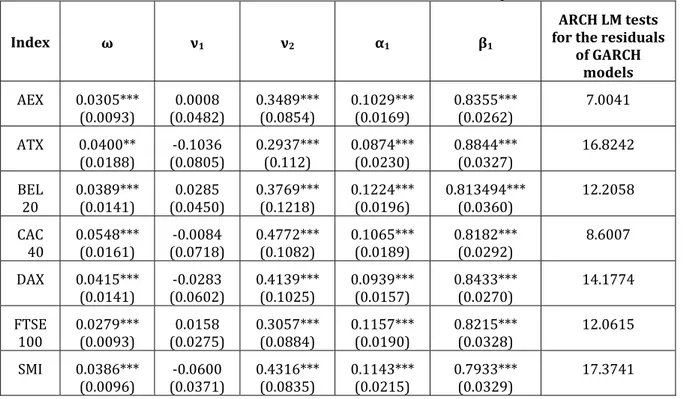
Notes: Standard errors are in brackets; ***, ** mean significant at . and . levels, respectively. The coefficients of the GARC( conditional variance equations indicate, for the volatility of each European index simple returns, a significant impact of the variable NSt Table . )nstead, no significant influence of the variable PSt was revealed.
Table 7 - Coefficients of the GARC( conditional variance equations
Index ω 1 2 1 1
ARCH LM tests for the residuals
of GARCH models
AEX . ***
. .. . . *** . . *** . . *** .
ATX . **
. - .. . . *** . . *** . . *** .
BEL . ***
. .. . . *** . . *** . . *** .
CAC . ***
. - .. . . *** . . *** . . *** .
DAX . ***
. - .. . . *** . . *** . . *** .
FTSE . ***
. .. . . *** . . *** . . *** .
SM) . ***
. - .. . . *** . . *** . . *** .
4. Conclusions
)n this paper we investigate the impact of NYSE shocks on the returns and volatility of seven European developed capital markets between and . More likely, some circumstances of this period, especially the crisis, influenced the impact of NYSE shocks on the European stock markets.
We found that more than a half of the shocks from these European stock markets were related to DJ)A shocks. The GARC( model results also suggest a significant impact of the DJ)A shocks on the European developed capital markets simple returns. )n these circumstances, NYSE shocks could be employed in the short term forecast of the European developed stock markets evolutions. They could be also used in the identification of buy or sell signals for some investment strategies.
The GARC( models revealed that negative DJ)A shocks increased the volatility of the European developed capital markets simple returns, while the positive shocks had no significant effects on the conditional variance. These results, which suggest that investors are more sensitive to the bad news from NYSE than to the good news, should be taken into consideration in the analysis of the risks associated to short term investments on the European developed stock markets.
References
1. Akaike, H. (1969). Fitting autoregressive models for prediction. Annals of the Institute of Statistical Mathematics,
21(1), 243-247.
2. Akaike, H. (1973). Information theory and an extension of the maximum likelihood principle, in B. Petrov and
F. Csáki (eds), 2nd International Symposium on Information Theory, Académiai Kiadó, Budapest, 267-281.
3. Bae, K. H., Karolyi, G. A. & Stulz, R. M. (2003). A new approach to measuring financial contagion. Review of
Financial Studies, 16(3), 717-763.
4. Barberis, N., Shleifer, A. & Wurgler, J. (2005). Comovement. Journal of Financial Economics, 75(2), 283-317.
5. Bekaert, G., Harvey, C. R. & Lumsdaine, R. L. (2002). Dating the integration of world equity markets. Journal of
Financial Economics, 65(2), 203-247.
6. Bekaert, G., Hodrick, R. J. & Zhang, X. (2009). International stock return comovements. The Journal of Finance,
64(6), 2591-2626.
7. Bollerslev, T. (1986). Generalized autoregressive conditional heteroskedasticity. Journal of Econometrics, 31(3),
307-327.
8. Box, G. E. P., Jenkins, G. M. & Reinsel, G. C. (1994), Time Series Analysis, Forecasting and Control, Third Edition,
Prentice Hall, Englewood Clifs, New Jersey.
9. Brennan, M. J. & Cao, H. H. (1997). International portfolio investment flows. The Journal of Finance, 52(5),
1851-1880.
10. Charles, A. & Darné, O. (2014). Large shocks in the volatility of the Dow Jones Industrial Average index: 1928–
2013. Journal of Banking & Finance, 43, 188-199.
11. Connolly, R. A. & Wang, F. A. (2003). International equity market comovements: Economic fundamentals or
contagion?. Pacific-Basin Finance Journal, 11(1), 23-43.
12. De Santis, G. & Gerard, B. (1997). International asset pricing and portfolio diversification with time varying risk.
The Journal of Finance, 52(5), 1881-1912.
13. Dickey, D. A. & Fuller, W. A. (1979). Distribution of the estimators for autoregressive time series with a unit root.
Journal of the American Statistical Association, 74(366a), 427-431.
14. Dumitriu, R. & Stefanescu, R. (2015), Volatility Transmission from S&P 500 to the Bucharest Stock Exchange
Indexes, Vanguard Scientific Instruments in Management , 10 (1), 19-31.
15. Engle, R. F. (1982). Autoregressive conditional heteroscedasticity with estimates of the variance of United
Kingdom inflation. Econometrica: Journal of the Econometric Society, 987-1007.
16. Engle, R. F. & Ng, V. K. (1993). Measuring and testing the impact of news on volatility. The Journal of Finance,
48(5), 1749-1778.
17. Ehrmann, M., Fratzscher, M., & Rigobon, R. (2011). Stocks, bonds, money markets and exchange rates: measuring
international financial transmission. Journal of Applied Econometrics, 26(6), 948-974.
18. Forbes, K. J., & Rigobon, R. (2002). No contagion, only interdependence: measuring stock market comovements.
The Journal of Finance, 57(5), 2223-2261.
19. French, K. R. & Poterba, J. M. (1991). Investor diversification and international equity markets. NBER Working
Paper No. 3609.
20. French, K. R., Schwert, G. W. & Stambaugh, R. F. (1987). Expected stock returns and volatility. Journal of Financial
Economics, 19(1), 3-29.
21. Glosten, L. R., Jagannathan, R. & Runkle, D. E. (1993). On the relation between the expected value and the
volatility of the nominal excess return on stocks. The Journal of Finance, 48(5), 1779-1801.
22. Goetzmann, W. N., Li, L., & Rouwenhorst, K. G. (2005). Long-term global market correlations, NBER Working
Paper No. 8612.
23. Grauer, R. R., & Hakansson, N. H. (1987). Gains from international diversification: 1968–85 returns on portfolios
24. Grubel, H. G. (1968). Internationally diversified portfolios: welfare gains and capital flows. The American Economic Review, 58(5), 1299-1314.
25. Hamao, Y., Masulis, R. W. & Ng, V. (1990). Correlations in price changes and volatility across international stock
markets. Review of Financial Studies, 3(2), 281-307.
26. Hartmann, P., Straetmans, S. & De Vries, C. G. (2004). Asset market linkages in crisis periods. Review of
Economics and Statistics, 86(1), 313-326.
27. Kaminsky, G., & Schmukler, S. (2003). Short-run pain, long-run gain: the effects of financial liberalization, NBER
Working Paper No. 9787.
28. King, M. A., & Wadhwani, S. (1990). Transmission of Volatility between Stock Markets. Review of Financial
Studies, 3(1), 5-33.
29. Kotkatvuori-Örnberg, J., Nikkinen, J. & Äijö, J. (2013). Stock market correlations during the financial crisis of
2008–2009: Evidence from 50 equity markets. International Review of Financial Analysis, 28, 70-78.
30. Lasfer, M. A., Melnik, A., & Thomas, D. (2003). Stock Price Reaction in Stressful Circumstances: An International
Comparison. Journal of Financial Economics, 40.
31. Lasfer, M., Lin, S. & Muradoglu, Y. G. (2007). Market Behaviour of Foreign Versus Domestic Investors Following a
Period of Stressful Circumstances. The Second Annual Conference on Asia-Pacific Financial Markets (CAFM) of the Korean Securities Association (KSA).
32. Lee, S. B., & Kim, K. J. (1993). Does the October 1987 crash strengthen the co-movements among national stock
markets?. Review of Financial Economics, 3(1), 89.
33. Levy, H., & Sarnat, M. (1970). International diversification of investment portfolios. The American Economic
Review, 668-675.
34. Ljung, G. M., & Box, G. E. (1978). On a measure of lack of fit in time series models. Biometrika, 65(2), 297-303.
35. Longin, F., & Solnik, B. (2001). Extreme correlation of international equity markets. The Journal of Finance,
56(2), 649-676.
36. Menezes, R., & Dionísio, A. (2011). Globalization and long-run co-movements in the stock market for the G7: An
application of VECM under structural breaks. Chinese Science Bulletin, 56(34), 3707-3716.
37. Miyakoshi, T. (2003). Spillovers of stock return volatility to Asian equity markets from Japan and the US. Journal
of International Financial Markets, Institutions and Money, 13(4), 383-399.
38. Poterba, J. M. & Summers, L. H. (1984). The persistence of volatility and stock market fluctuations. NBER
Working Paper No. 1462 (Also Reprint No. r0820).
39. Rigobon, R. (2003). On the measurement of the international propagation of shocks: is the transmission stable?.
Journal of International Economics, 61(2), 261-283.
40. Schwert, G. W. (2011). Stock volatility during the recent financial crisis. NBER Working Paper No. 16976.
41. Solnik, B., Boucrelle, C. & Le Fur, Y. (1996). International market correlation and volatility. Financial Analysts
Journal, 52(5), 17-34.
42. Stefanescu, R. & Dumitriu, R. (2015). Impact of the Shocks from NYSE on the Romanian Capital Markets. Risk in
Contemporary Economy, 371-376.
43. Stulz, R. M. (1999). Globalization, corporate finance, and the cost of capital. Journal of Applied Corporate
Finance, 12(3), 8-25.
44. Taylor, S. J. (1994). Modeling stochastic volatility: A review and comparative study. Mathematical Finance, 4(2),