THE BUSINESS ENVIRONMENT AND THE CURRENT LEVEL IN
EDUCATIONAL FORMATION FOR OLT COUNTY AGRICULTURE
Emil MARINESCU
University of Agricultural Sciences and Veterinary Medicine, Bucharest, Romania, Phone/Fax: 00 40 744 6474 10;E-mail:[email protected], [email protected]
Corresponding author: [email protected]
Abstract
The work seeks to underscore its correlative aspect of business initiatives and labor force training from Olt County rural areas. The high schools and alumni structure analysis for the agricultural and veterinary profile of Olt County, shows a variation in the number of agricultural high schools, but an annual discrepancy between the students enrolled number and the graduates number. Simultaneously, from the holdings dimension analysis, it can be seen the accented character of a subsistence agriculture. In the analysis performed it may also be indicated the farming business manifestation / rural areas. Through all these, it can be synthesized the fact that business development in agriculture is related to the need to monitor the total business entrepreneurs evolution, along with their training level.
Key words: active units, business ideas, enterprises, high school level, rural community, professional training, profile
INTRODUCTION
Given the potentials and rural environment diversity, most business ideas are based on a structure that has a high degree of diversification (require smaller or largerinvestment, depending on the nature and work extent). Because they are strictly correlated with the results obtained in labor force training, for which in the Olt County rural, education issues are still limited. These is due to reduced physical access opportunities, poor learning conditions, poverty as well as the relatively education high cost (including the basic education) that a rural community significant proportion cannot afford. It may be added the qualified teachers relatively low proportion in rural areas compared to urban areas.
MATERIALS AND METHODS
From the methodological point of view , through comparative analyzes , we aimed to describe, through a characteristics (variables), the active enterprises differences / structural homogeneity , the rural high schools profile of Olt County in the 2006-2011 dynamics. The
methodological system was focused on sides that took into account the investigation specific aspects of rural active units, along with the professional training system.
For rural firms from Olt County it was taken into account the determination of some indicators in respect to their distribution and dynamics.
The main issues were initially structured as a number of active enterprises / school units but also correlated in scope and employees number terms.
All these were included in appropriate indicators, which for Olt County were calculated during the period between years 2006 and 2011. There have been references to the annual level expressed in absolute and relative values, the analysis continued by making comparisons to the total and the first reference year (2006).
RESULTS AND DISCUSSIONS
1. The business environment and active enterprises dynamics in Olt county rural areas. Also, inOlt county rural areas, the results obtained
ină thОă company’să rОstructuringă anНă privatizationă
field during the previous years led to the respectively process continuation. A special emphasis was focused on modernizing the activities development of economic agents in the productive sector.
However the rural firms situation in Olt County, shown in Fig. 1 is actually a structure that can be mentioned: trade and motor vehicles repair (53.3%), followed by constructions (12.5%), agriculture (10.6%) and manufacturing (10 , 9%).
Fig.1. Rural firms distribution in Olt County
Source:Rural entrepreneurship diagnosis, Rural dynamization by sustainable employment ,
Economic activities diagnosis for the opportunities diversification in rural employment, Dr. &es, AGROSTAR 2010.[3]
On activity codes (according to the figures given in Table 1) shows that the highest number is for companies in the food products retail, beverages and tobacco. Further it can be signaled, the companies that are operating in constructions, in bars (including beverage service activities) and trade intermediation.
Table 1. Rural firms number structure in Olt County (on activity areas codes).
Activity Fields Company No.
4711 retailing food, tobacco and drinks 539
4120 Construction services for residential and
nonresidential buildings 209
5630 Bars and other beverage serving activities 156
4619 Trade mediation 145
Source: Rural entrepreneurship diagnosis, Rural dynamization by sustainable employment ,
Economic activities diagnosis for the opportunities diversification in rural employment, Dr. &es, AGROSTAR 2010.[3]
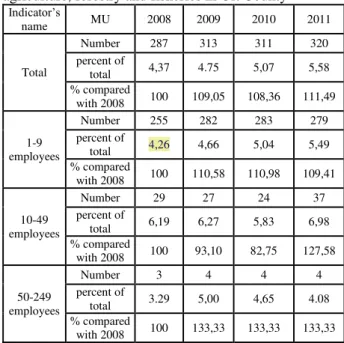
By deepening the analysis it was found that a profitable knowledge source of business ideas was and is fructified by the enterprises / units active existence in Olt county rural area. Below are presented indicators that reflect the employees number in the annual structure for the period 2008-2011, which are analyzed differently for enterprises / units active in agriculture, forestry and fisheries in Olt county. In summary, the active enterprises number structure in agriculture, forestry and fisheries, shown in Table 2, which is divided intoăgroupsăofăОmployООs’ănumbОr,ăpointsăoută the following:
- The active enterprises total number is growing (from a total of 287 in 2008 to 320 in 2011), the increase compared to 2008 being of 11.49%. But, unlike the county total this number still represents a much lower level (between 4.37 and 5.58%);
- Regarding the grouping by employees number, it can be seen that the highest companies number have up to 9 employees (in the last year 2011 these firms hold 87.18% of the existing rural and 5.49% of the total county ). Successively, the enterprises from the groups of 10-49 and 50-249 employees have the lowest percentage levels.
Table 2. The active enterprises dynamics in agriculture, forestry and fisheries in Olt County
InНicator’să
name MU 2008 2009 2010 2011
Total
Number 287 313 311 320
percent of
total 4,37 4.75 5,07 5,58 % compared
with 2008 100 109,05 108,36 111,49
1-9 employees
Number 255 282 283 279
percent of
total 4,26 4,66 5,04 5,49 % compared
with 2008 100 110,58 110,98 109,41
10-49 employees
Number 29 27 24 37
percent of
total 6,19 6,27 5,83 6,98 % compared
with 2008 100 93,10 82,75 127,58
50-249 employees
Number 3 4 4 4
percent of
total 3.29 5,00 4,65 4.08 % compared
Simultaneously in the period 2008-2011 dynamics it can be seen a slight increase both in total and for each of the groups analyzed. The analysis was continued towards the active local units knowledge in agriculture, forestry and fishing, for which, in the same annual growth rate.
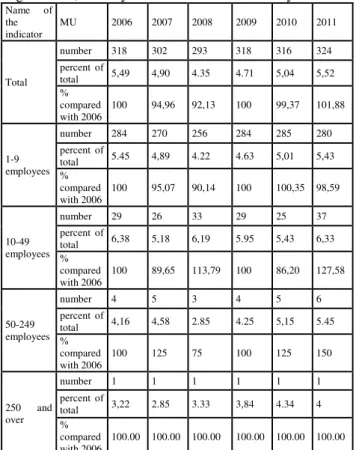
The data presented in Table 3 revealed the following:
- as total active local unitsnumber are increasing, only in thepastyear 2011 which comparedto 2006 isupto +1.88%. Also, there can be signaled annual rates oscillations, that through the comparisons against 2006 can be observed declines for most years;
Table 3. The dynamics of local units active in the agriculture, forestry and fisheries in Olt County
Name of the indicator
MU 2006 2007 2008 2009 2010 2011
Total
number 318 302 293 318 316 324
percent of
total 5,49 4,90 4.35 4.71 5,04 5,52 %
compared with 2006
100 94,96 92,13 100 99,37 101,88
1-9 employees
number 284 270 256 284 285 280
percent of
total 5.45 4,89 4.22 4.63 5,01 5,43 %
compared with 2006
100 95,07 90,14 100 100,35 98,59
10-49 employees
number 29 26 33 29 25 37
percent of
total 6,38 5,18 6,19 5.95 5,43 6,33 %
compared with 2006
100 89,65 113,79 100 86,20 127,58
50-249 employees
number 4 5 3 4 5 6
percent of
total 4,16 4,58 2.85 4.25 5,15 5.45 %
compared with 2006
100 125 75 100 125 150
250 and over
number 1 1 1 1 1 1
percent of
total 3,22 2.85 3.33 3,84 4.34 4 %
compared with 2006
100.00 100.00 100.00 100.00 100.00 100.00
Processed according to the data from the Statistical Yearbook of Olt County, INS, Olt County Statistics 2012 Edition[1]
- in the employees number structure / local unit there is an analyzed differentiation that can be shown as follows: for the group 1 to 19 employees, where are registered most of active local units representing 5.43% of county all such units and 86 ,41% of agriculture, forestry and fishing such units; the others groups, or 10-49, 50-249 and 250
and above, represents a much lower number, even if the comparison percentage to the total county is at a level between 6.63 and 4.0%. From these indicators analysis is identified a domain still considered less efficient compared with the existing resources.
The property small areas and the owners reluctance and information lack on the benefits of groups and associations farmers formation across the accessing grants possibilities through the National Rural Development or Community Financial Instruments makes Olt county agriculture and not only, to evolve at a pace inefficient in costs and benefits terms [4].
In summary it can be said that in Olt county, regarding the agriculture, hunting and fishing, evolution of the enterprises / units active number on class size / national economy activity in 2004-2008 showed the following structural changes [4] :
- The Contraction activities for agriculture, hunting and fishing with approx. 13 percent per total , the biggest drop being recorded for large enterprises. Agricultural enterprises represented only 4.42% of all enterprises at the 2008 level;
- The constant increase of fisheries and pisciculture microenterprises, although the share from the total is insignificant;
- Increasing the micro enterprises number with extractive activities;
- a 35.53% increase in manufacturing enterprises number due to a 46.56% increase in the micro enterprises number and a 24.35% increase at medium enterprises . Also, the large and very large enterprises number decreased by approx. 17 and 18%, respectively.
time in Corabia , there is tradition in cereals trade and taking into account the existence of a cereals port will enable the potential amplification of the cross-border trade in cereals.
2. The educational training current level for agriculture in Olt County. Based on the appearance in 2010 of the Local Development Plan, which brings together administrative areas, an important role is for attracting population in rural areas, primarily by improving living conditions in rural areas, but also by creating jobs. For these reasons, in this work was considered necessary to know the structural aspect problems of both profile high schools number, and students number, teachers, along with the communal library network.
The structure of high school education in rural areas in OltCounty, is a first issue of educational training. The data shown in Table 4, it can delineate the main issues to total comparative county (urban + rural) and in the 2006-2011 dynamics concerning:
Table 4. High school education in rural Olt County
Name of the
indicator U. M. 2006 2007 2008 2009 2010 2011 High schools total
(urban + rural) No. 26 26 26 34 33 33
Students enrolled (urban + rural)
No.
15962 15896 15992 17672 18939 20761
Graduate students-total (urban + rural)
No.
4070 4413 3715 4503 4223 -
Teaching staff (urban + rural)
No.
1161 1087 1151 1055 1135 1299
Total high schools (rural)
No. 5 4 4 10 8 8
percent of total high schools
19,23 15,38 15,38 29,41 24,24 24,24
% compared to 2006
100 80 80 200 160 160
Students enrolled (rural)
Number 789 639 606 835 956 1299 percent of
total students
4.94 4,01 3,78 4.72 5,04 6.25
% compared to 2006
100 80,98 76,80 105,83 121,16 164,63
Teaching staff (rural)
Number 56 47 47 51 65 77
percent of total DC power.
4,82 4,32 4.08 4,83 5. 5,92
% compared to 2006
100 83,92 83,92 91,07 116,07 137.5
Processed according to the data from the Statistical Yearbook of Olt County, INS, County Department of statistics, the 2012 Edition[1]
- Total high schools numberin rural areas is increasing (from 4 to 8 such schools), representing 24.24% of all high schools in the county in 2011;
- The enrolled students number in the total high schools mentioned is between 3.78% and 6.25%, even if the increase is in 2011 compared to 2006 is with +64.63% higher; - Teachers as number vary between 47 and 77, which to the total county percentage level is between 4.08% and 5.92%.
In this dynamic the comparison made for the rural high schools of Olt county is highlighted showing an increase in the high schools number (60.0%), students number (64.63%), but for teachers this increase is much lower (37.5%).
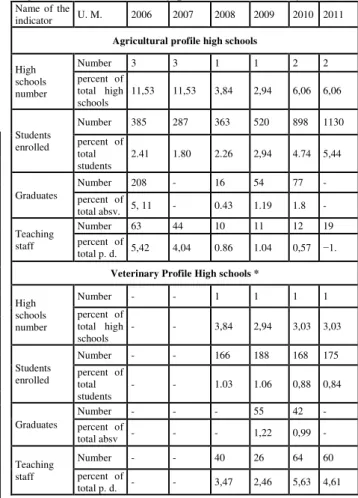
Table. 5 - The high schools and graduates structure of agriculture and veterinary profile in Olt County
Name of the
indicator U. M. 2006 2007 2008 2009 2010 2011
Agricultural profile high schools
High schools number
Number 3 3 1 1 2 2
percent of total high schools
11,53 11,53 3,84 2,94 6,06 6,06
Students enrolled
Number 385 287 363 520 898 1130
percent of total students
2.41 1.80 2.26 2,94 4.74 5,44
Graduates
Number 208 - 16 54 77 -
percent of
total absv. 5, 11 - 0.43 1.19 1.8 -
Teaching staff
Number 63 44 10 11 12 19
percent of
total p. d. 5,42 4,04 0.86 1.04 0,57 −1.
Veterinary Profile High schools *
High schools number
Number - - 1 1 1 1
percent of total high schools
- - 3,84 2,94 3,03 3,03
Students enrolled
Number - - 166 188 168 175
percent of total students
- - 1.03 1.06 0,88 0,84
Graduates
Number - - - 55 42 -
percent of
total absv - - - 1,22 0,99 -
Teaching staff
Number - - 40 26 64 60
percent of
total p. d. - - 3,47 2,46 5,63 4,61 * The years 2006 and 2007 are not given.
Processed according to the data from the Statistical Yearbook of Olt County, INS, County Department of statistics, the 2012 Edition[1]
Table 5 presents the situation, which for the period 2006-2011, can be highlighted the following issues:
- A variation in the number of agricultural high schools, a situation analyzed by a total county percentage comparison represents a level between only 2.94 and 11.53%. Report a yearly discrepancies between the students enrolled number and the graduates number to which it is found that the students enrolled number is increasing, but the graduates number decreasing, tendency indicated also at teachers;
- Veterinary profile high schools (being only one unit of its kind in the county), are represented by anannually growing number of students enrolled (though compared to the total county represents between 1.80 and 5.44 %), but decreasing on graduates (compared to total county level is much lower, between 0.43 and 5.11%). Even in this case the teaching staff, had an upward trend for which in the last year has seen a number of 60. From the mentioned above, it appears that the structure and forms of agricultural profile high schools influence on the rural population has an important role in alleviating the training and labor employment (with referrals to the forms and functionality of secondary education with agriculture and veterinary profile, and documenting the communal library existence ).
CONCLUSIONS
Rural territory economic profile in Olt County, especially the correlation between business ideas and the population educational outline, shown in the paper, reveals the following conclusions:
-Active rural locative units of Oltcounty, analyzed on activity codes signify the existence of the largest number which belongs to retail trade food firms, beverages and tobacco. It is found that the active enterprises total number in the agriculture, forestry and fishing, is growing, but compared to the total in the county this number still represents a much lower level. For the rural in Olt county, has resulted the need to know business ideas,
business types structure, a situation that was, is and must remain fructified by enterprises activity / active units.
-Educational formation for agriculture in Olt County, has amplified the need to establish structures on education issues. But, they are still limited in rural areas due to reduced opportunities for physical access, poor learning conditions, poverty, and the relatively high cost of education (including the basic education) that a significant proportion of the rural community cannot afford.
-It was observed an increase in the high schools number, students number , but an increase in a lower rhythm for the teaching staff. The high schools and graduates structure analysis for agricultural and veterinary profile of OltCounty, signifies a agricultural high schools number variation, but an annual discrepancy between the students enrolled number and the graduates number. All these because the local rural area from Olt County faces numerous gaps in educational training, these represent one of the main reasons why the disparities between urban and rural areas in terms of all its components: rural economy, the potential demographic, health, school, culture, etc.
-To reduce these disparities, one solution is to develop and implement integrated strategies for rural development by local communities, with the starting point, the needs that can be identified at local level and the endogen potential.
REFERENCES
[1]Olt County Statistical Yearbook, INS, Olt County Statistics, 2012 edition
[2]Olt County Agriculture, Recolta.eu, 25 November 2010, AgriculturО%ă 20juНОţului%ă 20Olt%ă 20%ă 20Recolta_eu% 20 -% 20Cotidia