BGD
6, 2837–2861, 2009Impact of anthropogenic ocean
acidification
K. Walther et al.
Title Page
Abstract Introduction
Conclusions References
Tables Figures
◭ ◮
◭ ◮
Back Close
Full Screen / Esc
Printer-friendly Version
Interactive Discussion Biogeosciences Discuss., 6, 2837–2861, 2009
www.biogeosciences-discuss.net/6/2837/2009/ © Author(s) 2009. This work is distributed under the Creative Commons Attribution 3.0 License.
Biogeosciences Discussions
Biogeosciences Discussionsis the access reviewed discussion forum ofBiogeosciences
Impact of anthropogenic ocean
acidification on thermal tolerance of the
spider crab
Hyas araneus
K. Walther, F. J. Sartoris, C. Bock, and H. O. P ¨ortner
Alfred-Wegener-Institute for Polar and Marine Research, Department Integrative Ecophysiology, Am Handelshafen 12, 27570 Bremerhaven, Germany
Received: 16 February 2009 – Accepted: 25 February 2009 – Published: 10 March 2009
Correspondence to: K. Walther ([email protected])
BGD
6, 2837–2861, 2009Impact of anthropogenic ocean
acidification
K. Walther et al.
Title Page
Abstract Introduction
Conclusions References
Tables Figures
◭ ◮
◭ ◮
Back Close
Full Screen / Esc
Printer-friendly Version
Interactive Discussion Abstract
Future scenarios project combined developments of elevated CO2concentrations and global warming and their impact on marine ecosystems. The synergistic impact of both factors was addressed by studying the effect of CO2accumulation on thermal tolerance of the cold-eurythermal spider crabHyas araneus. Animals were exposed to present
5
day normocapnia (380 ppm CO2), CO2 levels expected towards 2100 (710 ppm) and beyond (3000 ppm). Heart rate and haemolymph PO2 (PeO2) were measured during progressive short term cooling from 10 to 0◦C and during warming from 10 to 25◦C. An increase of PeO2occurred during cooling with highest values reached at 0◦C under all three CO2levels. Heart rate increased during warming until a critical temperature (Tc)
10
was reached. The putativeTcunder normocapnia was presumably>25◦C, from where
it fell to 23.5◦C under 710 ppm and then 21.1◦C under 3000 ppm. At the same time, thermal sensitivity, as seen in the Q10 values of heart rate, rose with increasing CO2 concentration in the warmth. Our results suggest a narrowing of the thermal window of Hyas araneusunder moderate increases in CO2levels by exacerbation of the heat or
15
cold induced oxygen and capacity limitation of thermal tolerance.
1 Introduction
The ongoing increase of CO2 in the atmosphere is a key driver of global warming (IPCC, 2001, 2007) and causes an inrease in accumulation of CO2in the oceans lead-ing to an acidification. Caldeira and Wickett (2005) modelled different future scenarios
20
for CO2 concentrations in the atmosphere and ocean. By 2100 they projected atmo-spheric and surface ocean levels of 710 ppm CO2and for the year 2300 much beyond depending on the use of fossil fuel resources. Values reached may potentially comprise 3000 ppm CO2. This leads to questions about the potential impact of ocean acidifica-tion on marine ecosystems in times of ocean warming (cf. P ¨ortner et al., 2005, 2008).
25
stud-BGD
6, 2837–2861, 2009Impact of anthropogenic ocean
acidification
K. Walther et al.
Title Page
Abstract Introduction
Conclusions References
Tables Figures
◭ ◮
◭ ◮
Back Close
Full Screen / Esc
Printer-friendly Version
Interactive Discussion ies on the influence of CO2 on crustaceans were conducted with a different focus and
used concentrations of about 10 000 ppm CO2 (Cameron, 1978, 1985; Cameron and Iwama, 1987; Metzger et al., 2007; Pane and Barry, 2007; Wickins, 1984) or realistic scenarios (Spicer et al., 2007). For reliable conclusions concerning the impact of CO2 on the physiology and fitness of crustaceans in the near future, it is necessary to
in-5
clude realistic CO2 concentrations in those studies, as postulated for 2100 (710 ppm) or beyond (3000 ppm).
The present study investigates the impacts of CO2 and temperature on the physi-ology of Hyas araneus in the context of the thermal tolerance concept originally de-veloped by Frederich and P ¨ortner (2000) for Maja squinado. The thermal tolerance
10
window as characterized by temperature dependent haemolymph oxygen partial pres-sure (PeO2), heart and ventilation rates comprises the temperature range of aerobic performance (or scope). The thermal optimum is the temperature where performance is maximal, supported by high haemolymph oxygen tension, and maximum scope (i.e. increase above maintenance) for heart and ventilation rates. The earliest limits of the
15
thermal tolerance range with ecological effect (P ¨ortner and Knust, 2007) are set by high and low pejus temperatures (Tp). An increased temperature leads to rising oxygen de-mand that can be met by oxygen supply through enhanced ventilation and heart rate (Zainal et al., 1992). The upperTpindicates the point, where ventilation and heart rate level offto remain constant. Haemolymph oxygen partial pressure decreases within the
20
subsequent pejus range, as a result of a mismatch developing between the rising oxy-gen demand for maintenance and the limited capacities of ventilation and circulation in oxygen supply. Beyond pejus range, a critical temperature defines the onset of anaer-obic metabolism, where accumulation of L-lactate, succinate and inorganic phosphate sets in and aerobic scope is minimized (Zainal et al., 1992; Stillmann and Somero,
25
accu-BGD
6, 2837–2861, 2009Impact of anthropogenic ocean
acidification
K. Walther et al.
Title Page
Abstract Introduction
Conclusions References
Tables Figures
◭ ◮
◭ ◮
Back Close
Full Screen / Esc
Printer-friendly Version
Interactive Discussion mulation (Frederich and P ¨ortner, 2000; Melzner et al., 2006). As PeO2 levels depend
on oxygen consumption and are controlled by ventilation and heart rate the determi-nation of critical temperatures in different crab species (Ahsanullah and Newell, 1971; Cuculescu et al., 1998; Stillman and Somero, 1996; Worden et al., 2006) from heart rate measurements would then match critical thermal limits according to the concept
5
of oxygen and capacity limited thermal tolerance.
The impact of moderate elevations in CO2 on thermal window may be small in the thermal optimum but may exert stronger effects on thermal limits as hypothesized ear-lier (P ¨ortner et al., 2005; P ¨ortner and Farrell, 2008). The reduction in aerobic scope towards thermal extremes will decrease functional capacity and fitness and may
mini-10
mize survival in the field once animals are exposed to thermal extremes (P ¨ortner and Knust, 2007).
Little is known about the interaction of CO2 and temperature tolerance of cold-eurythermal invertebrates. For an analysis of the impact of CO2 on crustaceans, the spider crabHyas araneus(L.) was chosen as a model. Hyas araneus is distributed in
15
the North Atlantic from the North Sea, near Helgoland, Germany, to the Arctic around Svalbard, Norway (Christiansen, 1969). The mean ambient temperature of the North Sea ranges from 3◦C to 18◦C throughout the year (Wiltshire and Manly, 2004), whereas in Svalbard waters Hyas araneus is exposed to temperatures between 0◦C and 6◦C (Svendsen et al., 2002). The present study investigates the thermal window of the
20
Hyas araneus population around Helgoland in the context of the large temperature fluctuations experienced by the species in the North Sea. One further question ad-dressed in this study is to what extent CO2 affects the thermal tolerance range and whether this effect sets in under expected CO2accumulation scenarios in atmosphere and surface waters.
BGD
6, 2837–2861, 2009Impact of anthropogenic ocean
acidification
K. Walther et al.
Title Page
Abstract Introduction
Conclusions References
Tables Figures
◭ ◮
◭ ◮
Back Close
Full Screen / Esc
Printer-friendly Version
Interactive Discussion 2 Materials and methods
2.1 Animals
AdultHyas araneus (L.) were caught between August and October 2007 around Hel-goland, Germany. The animals (carapace length: 68.8±2.8 mm) were held in tanks with aerated re-circulating natural seawater at 10±0.2◦C, 32–33‰ salinity, pH 8.0 and
5
a 12 h light cycle at the Alfred Wegener Institute in Bremerhaven, Germany, for at least 4 weeks before the beginning of the experiments. The animals were fed twice a week with pieces of mussels (Mytilus edulis). A thermostat (Lauda, T1200) ensured tight temperature control in the experimental setup tank. The temperature ramp start-ing from a control temperature of 10◦C was coded using the wintherm plus program
10
(Version 2.2) of the thermostat. The water was cooled from 10◦C to 0◦C and warmed continuously from 10◦C to 25◦C at a rate of 1◦C per h. The accuracy of the temperature
ramp was 1±0.2◦C/h for cooling and 1±0.1◦C/h for warming protocols.
2.2 Surgical procedures
Prior to experimentation animals were prepared for continuous simultaneous
measure-15
ments of haemolymph oxygen partial pressure (PeO2) and heart rate. Briefly, two holes were drilled through the carapace, one directly over the heart, avoiding injury to the hypodermis. This hole was covered with latex dam to prevent haemolymph loss. The sleeve of an inflexible venipuncture needle (after Strauss, BRAUN, Germany) was used as an adapter for fixation of the oxygen optode. This adapter was fixed with dental
20
wax over the drilled hole. A second hole was drilled behind the optode preparation for fixation of the Doppler probe used for heart rate measurements.
2.3 Oxygen measurements
Measurements of PeO2were carried out with microoptodes (NTH-PSt1-L5lTF-PC3,1-NS 35x1,20-YOP, PreSens GmbH, 93053 Regensburg, Germany). Data were recorded
BGD
6, 2837–2861, 2009Impact of anthropogenic ocean
acidification
K. Walther et al.
Title Page
Abstract Introduction
Conclusions References
Tables Figures
◭ ◮
◭ ◮
Back Close
Full Screen / Esc
Printer-friendly Version
Interactive Discussion on-line by use of temperature compensation via TX2-A oxygen monitors and software
(Oxy View TX2 C 4.02) (PreSens Regensburg, Germany). Optodes were calibrated in air-saturated millipore water (100%) and in oxygen-free seawater, using sodium disul-fide (0%). The tip of the optode was inserted through the adapter and latex dam into the pericardial sinus and fixed with parafilm. Oxygen values were recorded as % air
5
saturation and converted to PeO2.
2.4 Heart rate measurements
Measurements of heart rate were carried out with a non-invasive laser Doppler per-fusion monitor (LDPM PeriFlux System 5000, Perimed AB, J ¨arf ¨alla, Sweden) similar to Lannig et al. (2008). Prior to the experiments, the probe was two-point calibrated.
10
The laser Doppler signal was monitored by chart 5 (AD instruments). Heart rates (beats/min) were derived from regular changes in the laser Doppler signal caused by fluctuating haemolymph flow. Laser Doppler values were averaged for individual tem-perature steps (0.1◦C for the warming ramp, 0.2◦C for the cooling ramp).
2.5 CO2incubations
15
After the implantation of the sensors, animals were allowed to recover for 24 h in 75-liter seawater tanks at 10◦C. During the experiments animals were exposed to different CO2 concentration (normocapnia, 710 ppm, 3000 ppm) in the seawater. For normocapnic conditions (380 ppm CO2) seawater was bubbled with air. For exposure to different CO2 concentrations W ¨osthoff gas mixing pumps (Typ 2M303/a-F-T, 5kM303/a-F,
5kM402-20
F) were used to mix CO2-free air with CO2. During exposure to 3000 ppm CO2 water, water pH dropped from 8.0 to 7.3 (expected pH value calculated as 7.29). Equilibra-tion with 710 ppm CO2concentration caused a pH decrease from 8.0 to 7.8 (expected value calculated as pH 7.80). Prior to exposure to the temperature ramp animals were exposed for 24 h to 10◦C at each particular CO
2 concentration. New acid-base
equi-25
BGD
6, 2837–2861, 2009Impact of anthropogenic ocean
acidification
K. Walther et al.
Title Page
Abstract Introduction
Conclusions References
Tables Figures
◭ ◮
◭ ◮
Back Close
Full Screen / Esc
Printer-friendly Version
Interactive Discussion survived experimentation.
2.6 Data analysis
Data are presented as means±SE. Statistical significance was tested using one-way ANOVA and post hoc Tukey tests (GraphPad Software, Prism 4). Discontinuities in the slopes of heart rate changes vs. temperature were calculated from intersections
5
of fitted two-phase regressions according to the minimum sum of squares and were presented as breakpoints and critical temperatures (Tc). Linear regression lines were calculated with Prism 4 (GraphPad Software). Nonlinear regression curves were fitted using Boltzmann sigmoidal equation at Prism 4 (GraphPad Software).Q10values were calculated from heart rates after De Wachter and Wilkens (1996): Q10=(fH2/fH1) exp
10
[10/(t2−t1)] witht=temperature andfH=heart rate.
3 Results
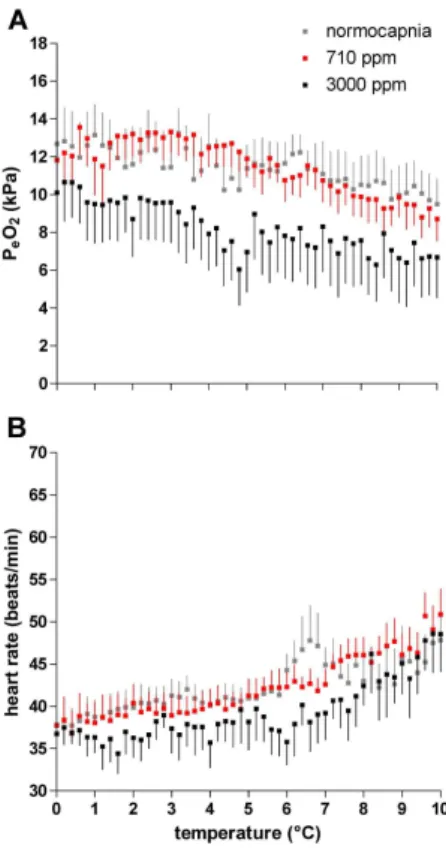
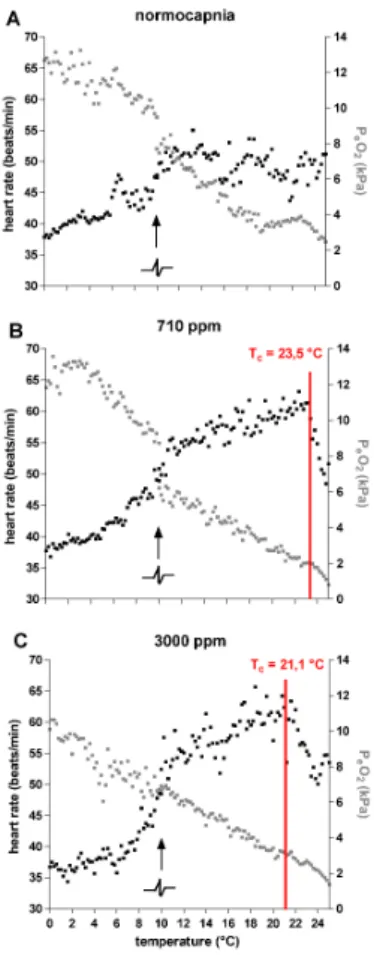
Acute cooling from 10◦C to 0◦C resulted in a slight increase of PeO2 under all three conditions, i.e. normocapnia, 710 ppm, as well as 3000 ppm CO2, starting from values of PeO2 which fell with rising CO2 levels (Fig. 1a). Under normocapnia mean PeO2
15
ranged from 9.49 kPa at 10◦C to 13.24 kPa at 0◦C, under 710 ppm values ranged from 8.72 kPa to 13.56 kPa and, under 3000 ppm, from 6.05 kPa to 10.65 kPa. The PeO2 values of crabs incubated under 3000 ppm were significantly lower than in animals under both normocapnia and 710 ppm (ANOVA,p<0.001).
Heart rate decreased between 10◦C and 6◦C with different slopes depending on
20
CO2 concentration (Fig. 1b). The heart rate of crabs incubated under 3000 ppm CO2 fell more strongly than in animals incubated under 710 ppm and normocapnia. The statistical comparison of the three data sets obtained between 10◦C and 0◦C revealed a significant difference between animals under normocapnia and 3000 ppm as well as between those under 710 ppm and 3000 ppm (ANOVA, p<0.001). Hyas araneus
BGD
6, 2837–2861, 2009Impact of anthropogenic ocean
acidification
K. Walther et al.
Title Page
Abstract Introduction
Conclusions References
Tables Figures
◭ ◮
◭ ◮
Back Close
Full Screen / Esc
Printer-friendly Version
Interactive Discussion specimens incubated under 3000 ppm displayed a lower heart rate than those
un-der 710 ppm or normocapnia. Heart rate remained more or less constant between 6 and 0◦C under all conditions, at a rate of 37.2±1.2 beats/min under 3000 ppm, 39.64±1.4 beats/min under 710 ppm and 40.27±1.4 beats/min under normocapnia.
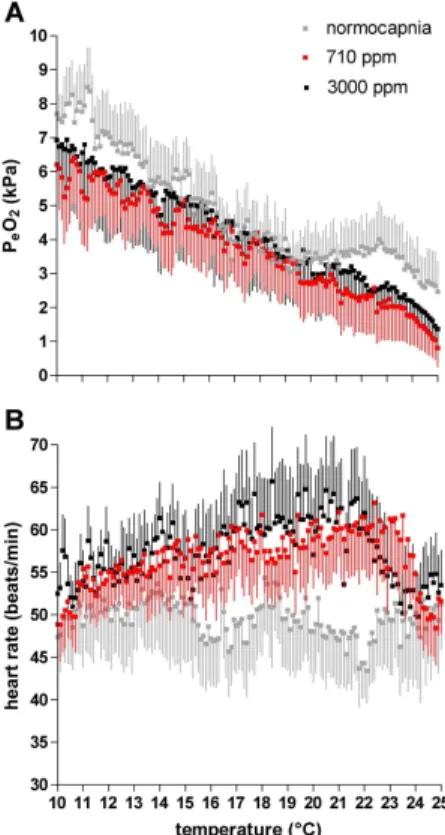
Upon acute warming from 10◦C to 25◦C haemolymph P
eO2 values ofHyas araneus
5
decreased (Fig. 2a), from a maximum of about 8.5 kPa at 10◦C under normocapnia to a minimum of about 2.5 kPa at 25◦C. Under the same warming protocol mean PeO2in crabs under 710 ppm fell from 6.3 kPa to 0.8 kPa, and in specimens under 3000 ppm from 6.9 kPa to 1.37 kPa. Differences were statistically significant between data ob-tained under normocapnia and 710 ppm (ANOVA,p<0.001) as well as between those
10
under 3000 ppm and normocapnia or 710 ppm (ANOVA,p<0.01).
Depending on CO2treatment heart rate ofHyas araneusdisplayed different patterns upon acute warming between 10◦C and 25◦C (Fig. 2b). Lowest rates were seen under normocapnia with relatively stable mean values between 43.7 and 55.0 beats/min. In contrast, heart rate increased under 710 ppm from 48.9 beats/min at 10◦C to a
maxi-15
mum of 63.17 beats/min at 22.4◦C leveling offtowards 61.67 beats/min at 23.5◦C and decreasing rapidly thereafter to 48.44 beats/min at 24.8◦C. Crabs under 3000 ppm displayed an increase in heart rate from 52.49 beats/min at 10◦C to 65.6 beats/min at 18.4◦C leveling off to 62.52 beats/min at 21.1◦C and decreasing thereafter to 50.05 beats/min at 24◦C. Data under 3000 ppm were significantly different from those
20
obtained under normocapnia or 710 ppm (ANOVA,p<0.001).
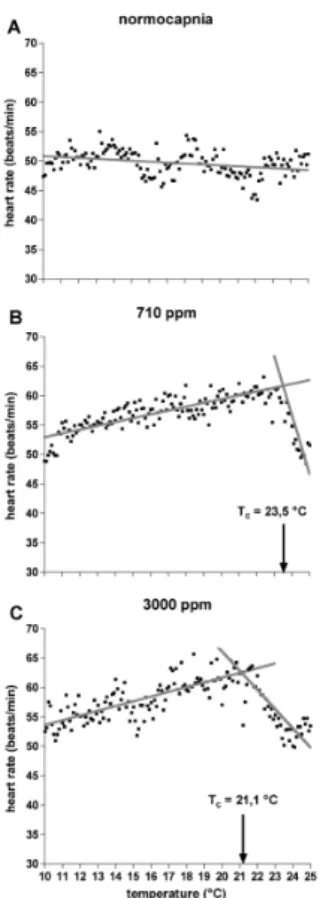
Figure 3 depicts the heart rates measured between 10 and 25◦C for an identification of calculated breakpoints defining upper critical temperatures (Tc). The upperTcunder 710 ppm was 23.5◦C (Fig. 3b) and under 3000 ppm 21.1◦C (Fig. 3c). Under
normo-capnic conditions no breakpoint could be identified in the observed temperature range
25
between 10 and 25◦C (Fig. 3a).
BGD
6, 2837–2861, 2009Impact of anthropogenic ocean
acidification
K. Walther et al.
Title Page
Abstract Introduction
Conclusions References
Tables Figures
◭ ◮
◭ ◮
Back Close
Full Screen / Esc
Printer-friendly Version
Interactive Discussion changes in the development of heart rate upon warming under 710 ppm and 3000 ppm
define the critical temperatures, confirming that the Tc is found beyond 25◦C under
normocapnia (Tc>25◦C).
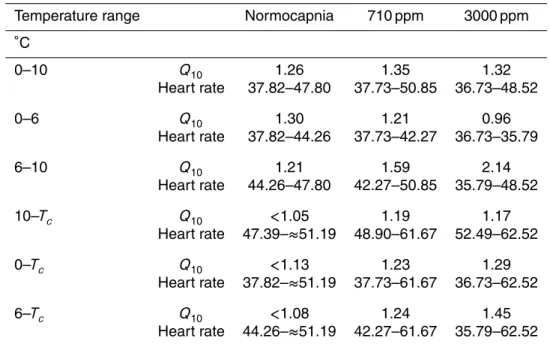
Accordingly, Q10 values ofHyas araneus heart rates (Table 1) increased from 1.26 under normocapnia to 1.35 under 710 ppm CO2 and 1.32 under 3000 ppm CO2
be-5
tween 0 and 10◦C. The gradients of heart rate changes were different from 0 to 6◦C and 6 to 10◦C. ThereforeQ10 decreased from 1.30 to 0.96 with increasing CO2levels between 0◦C and 6◦C. Between 6 and 10◦C theQ
10increased from 1.21 under normo-capnia to 2.14 under 3000 ppm. Q10 calculations for the temperature ranges from 0, 6 or 10◦C to the critical temperature assumed a Tc of 25◦C under normocapnia, shown
10
in Table 2. When heart rate remained nearly constant beyond critical temperature, as seen between 10 to 25◦C, normocapnic Q10 values decreased further (Table 1). The Q10 increment with rising CO2 levels was seen when calculated for the temperature range between 10◦C and the respective critical temperature (T
c), as well as for be-tween 0◦C and theTc or between 6◦C and theTc. These data demonstrate a stronger
15
response to temperature under increasing CO2levels.
4 Discussion
4.1 Thermal tolerance window ofHyas araneus
The aim of the present study was to illustrate the impact of anthropogenic CO2 accu-mulation in the oceans on the thermal tolerance window of the cold-eurythermal spider
20
crabHyas araneus. For an examination of the thermal tolerance window haemolymph oxygen partial pressure (PeO2) and heart rate were measured during warming and cooling protocols.
Hyas araneusexposed to the cooling protocol from 10◦C to 0◦C (Fig. 1a) displayed a moderate exponential increase in haemolymph oxygen partial pressure while heart rate
25
BGD
6, 2837–2861, 2009Impact of anthropogenic ocean
acidification
K. Walther et al.
Title Page
Abstract Introduction
Conclusions References
Tables Figures
◭ ◮
◭ ◮
Back Close
Full Screen / Esc
Printer-friendly Version
Interactive Discussion 37.2 beats/min and mean PeO2at 0◦C was 13.6 kPa. Specimens exposed to warming
from 10◦C to 25◦C (Fig. 2a) experienced a decrease in mean PeO2 value to 2.5 kPa at 25◦C while heart rate rose vaguely from 43.7 to 55.0 beats/min under normocap-nic conditions. The comprehensive depiction in Fig. 4 shows that haemolymph PeO2 continues to rise down to 0◦C. These data contrast the first such data set elaborated
5
in the spider crabMaja squinado (Frederich and P ¨ortner, 2000) where the tempera-ture dependent pattern of PeO2characterized the thermal tolerance window. In Maja squinado PeO2 fell upon cooling until a lower critical temperature was reached, sub-sequently anaerobic metabolism set in and indicated cold induced oxygen deficiency (Frederich and P ¨ortner, 2000).
10
The optimum temperature range ofMaja squinadowas seen between low and high pejus temperatures of 8.9 and 17.8◦C, respectively (Frederich and P ¨ortner, 2000), with a maximum PeO2of 92.6 mmHg, equivalent to 12.3 kPa, which was more or less sta-ble between those so-called pejus thresholds. The highest PeO2 value recorded in Hyas araneus was 13.6 kPa at the coldest temperature of 0◦C. These data indicate
15
that the optimum performance range ofHyas araneusis shifted to colder temperatures when compared toMaja squinado. AsHyas araneus reached their highest PeO2 val-ues in the cold this may indicate that the species experiences no oxygen limitation at extremely cold temperatures, at least in its central organs close to the heart. Nonethe-less, it may still undergo limitation in the perfusion of peripheral organs or in general, in
20
functional capacity upon further cooling as shown inMaja squinado(Bock et al., 2001). All reptant decapod crustaceans were hypothesized to be excluded from permanently low temperatures of−1◦C in polar oceans (Frederich et al., 2000). Data on anaerobic metabolite levels would be required to test whether loss of functional capacity rather than oxygen limitation would cause cold limitation inHyas araneus.
25
BGD
6, 2837–2861, 2009Impact of anthropogenic ocean
acidification
K. Walther et al.
Title Page
Abstract Introduction
Conclusions References
Tables Figures
◭ ◮
◭ ◮
Back Close
Full Screen / Esc
Printer-friendly Version
Interactive Discussion the warm-eurythermalMaja squinado (Frederich and P ¨ortner, 2000). Mean ambient
water temperature of the North Sea at Helgoland Roads is about 3◦C in winter and reaches 18◦C in summer (Wiltshire and Manly, 2004). Annual temperatures in Sval-bard waters fluctuate between 0 and 6◦C (Svendsen et al., 2002). This wide range of
habitat temperatures implies a wide thermal tolerance range of this spider crab.
5
The heart rate ofHyas araneusdecreased exponentially between 10◦C and 0◦C un-der normocapnic conditions (Fig. 1b). A heart rate of 37.2 beats/min was measured at 0◦C. This value appears high compared to the 20 beats/min reported forHyas araneus at 0◦C (Frederich et al., 2000). InMaja squinado, heart rate at 0◦C was 10 beats/min and found below the lower critical temperature and within the pessimum range. A lower
10
heart beat rate might not only reflect thermal limitation but also relate to the somewhat larger body size of M. squinado (carapace length: 142.5±30.5 mm (Bern ´ardez et al., 2005) compared to carapace length: 68.8±2.8 mm in H. araneus) (Ahsanullah and Newell, 1971; DeFur and Mangum, 1979). Maja squinado’s heart rates in the optimum range (9.3◦C to 17.3◦C) were about 40 to 60 beats/min (Frederich and P ¨ortner, 2000),
15
at the low end of rates seen inH. araneus at 10◦C and beyond. Close to 0◦C, high
PeO2values combined with relatively high heart rates ofHyas araneusreflect mainte-nance of performance at cold temperatures. The rise in PeO2in the cold reflects the facilitation in oxygen supply in cold waters, once tissue functional capacities are cold adapted. This facilitation is due to high oxygen solubility in cold waters and body fluids
20
combined with a putative cold induced reduction of metabolic rates (cf. P ¨ortner, 2002). This conclusion is supported by the relaxed oxygen supply situation and the respective molecular to systemic adaptations of polar stenotherms (cf. P ¨ortner, 2006).
Under normocapnia and both elevated CO2tensions testedHyas araneusheart rate decreased from 10 to 6◦C and was nearly constant between 6 and 0◦C, reflecting the
25
BGD
6, 2837–2861, 2009Impact of anthropogenic ocean
acidification
K. Walther et al.
Title Page
Abstract Introduction
Conclusions References
Tables Figures
◭ ◮
◭ ◮
Back Close
Full Screen / Esc
Printer-friendly Version
Interactive Discussion et al., 2008). Upon warming from 10 to 25◦C the heart rate ofHyas araneusremained
more or less constant under normocapnic conditions (Fig. 2b) with a Q10 close to 1 (Table 2). This indicates that the exponential phase was left and that circulatory perfor-mance reached its limit beyond 10◦C, which would reflect the upper pejus temperature
of the species. At higher temperatures the analysis revealed no discontinuities in the
5
normocapnic data (Fig. 3). For comparison, heart rate data ofMaja squinadodisplayed a break at 31.5◦C, close to their critical temperature identified by the onset of
anaer-obic metabolism (Frederich and P ¨ortner, 2000). We conclude that the upper critical temperature ofHyas araneus under normocapnia is likely reached above 25◦C.
The facts that the maximal PeO2 of Hyas araneus is found close to 0◦C, that the
10
upper pejus temperature is likely close to 10◦C and the critical temperature of Hyas araneusabove 25◦C indicates that the pejus range starting close to 10◦C is somewhat more expanded than that of Maja squinado which displays a pejus range between 17.3 and 31.1◦C (Frederich and P ¨ortner, 2000). This and the progressive rise in PeO2 within the optimum range towards the more extreme cold distinguishHyas araneusas
15
a cold-eurythermal species from the warm-eurythermalMaja squinado.
4.2 CO2effects on thermal tolerance
During exposure to increased CO2 concentrations (710 ppm and 3000 ppm) the PeO2 ofHyas araneusdisplayed various decline phases between 0◦C and 25◦C resembling those under normocapnic conditions (Fig. 4). The same was true for heart rate.
How-20
ever, levels of heart rate and PeO2 differed between CO2 levels. Heart rate resulted lower between 10 and 0◦C under 3000 ppm than under 710 ppm or normocapnia. This observation together with a trend for PeO2to be lower under high CO2 levels indicate a reduction in functional capacity of oxygen supply in CO2exposed specimens in the cold.
25
Above 10◦C, CO
BGD
6, 2837–2861, 2009Impact of anthropogenic ocean
acidification
K. Walther et al.
Title Page
Abstract Introduction
Conclusions References
Tables Figures
◭ ◮
◭ ◮
Back Close
Full Screen / Esc
Printer-friendly Version
Interactive Discussion 710 ppm (0◦C toT
c=23.5◦C from 37.72 to 61.67 beats/min) or under normocapnia. The stronger thermal stimulation of heart rate under increasing CO2 levels may reflect a response to lower oxygen tensions and/or a chemosensory response. It may also reflect a stronger increase in metabolic rate.
Starting from a putativeTcabove 25◦C forHyas araneusunder normocapnic
condi-5
tions CO2clearly induces a shift in upper critical temperature to 23.5◦C under 710 ppm and to 21.1◦C at 3000 ppm (Fig. 3). These results confirm those obtained earlier in
Cancer pagurusby Metzger et al. (2007), where measurements of PaO2demonstrated a downward shift of critical temperature from 20.5◦C (normocapnia) to 15.5◦C under 1% CO2 (=10 000 ppm CO2). These findings support the hypothesis that with higher CO2
10
concentrations and a stronger heat induced stimulation of heart rate critical temper-ature falls, as a result of synergistic effects of temperature and CO2. In contrast to observations in the cold it may also involve a CO2 induced stimulation of metabolic costs in the warmth.
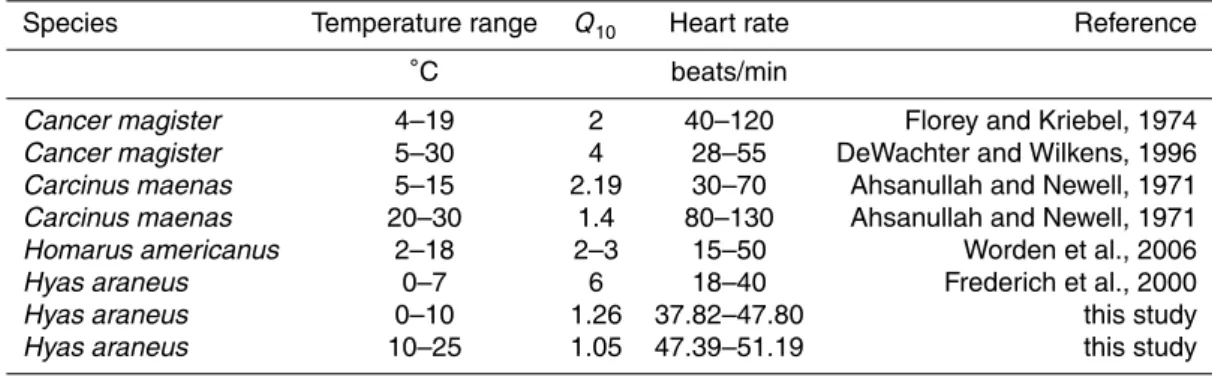
Heart rates of Hyas araneus (Table 1) were similar to heart rate measurements in
15
other marine invertebrates (Table 2). Different Q10 values in accordance to the heart rate between intertidal and subtidal species might reflect more or less variable ambient temperatures. Experiments onPetrolisthes cinctipes andPetrolisthes eriomerus, two species with different intertidal distributions also indicate such relationships (Stillman and Somero, 1996). Stillmann and Somero (1996) identified upper thermal limits of
20
the high intertidal crab Petrolisthes cinctipes and the low intertidal crab Petrolisthes eriomerus, which correlated with the natural habitat temperature. Heart rate measure-ments ofPetrolisthes species identified a critical temperature which in the light of our present data and those by Frederich and P ¨ortner (2000) may indicate a shift from aer-obic to anaeraer-obic metabolism. The low intertidal crabPetrolisthes eriomerusdisplayed
25
ther-BGD
6, 2837–2861, 2009Impact of anthropogenic ocean
acidification
K. Walther et al.
Title Page
Abstract Introduction
Conclusions References
Tables Figures
◭ ◮
◭ ◮
Back Close
Full Screen / Esc
Printer-friendly Version
Interactive Discussion mal range and live near their thermal limits. For the eurythermal Hyas araneus we
might suggest, that the limited thermal tolerance window underpins the large scale bio-geographical distribution of the species. Under normocapnia, the response ofHyas araneusresembles the one of the high intertidal speciesP. cinctipes. In contrast,Hyas araneusunder elevated CO2showed a response similar toP. eriomerus, which is a low
5
intertidal species and does not possess such a wide thermal tolerance range. A CO2 induced narrowing of the thermal tolerance, will therefore most likely restrict the geo-graphical distribution of a species.Hyas araneusfrom Helgoland would already exploit its upper pejus range during present summers (temperature around 18◦C, Wiltshire and Manly, 2004), however without reaching the upperTc. The situation will change
10
dramatically under CO2 concentrations of 3000 ppm (scenario 2300), where the criti-cal temperature ofHyas araneuswas determined as 21.1◦C, which would imply much higher heat stress during extreme summers and high mortality rates.
During warming protocols, Hyas araneus showed an increase in heart rate and a decrease in haemolymph oxygen partial pressure in all incubations (Fig. 4). To support
15
increasing oxygen demand upon warming, oxygen uptake and distribution via venti-lation and circuventi-lation have to be enhanced (Zainal et al., 1992). Within the thermal optimum range oxygen consumption of a species is positively related to not yet limited ventilation rate and heart rate (McMahon et al., 1978; Zainal et al., 1992) until capacity limits are reached at upper pejus temperature. Heart and scaphognatithe rates as well
20
as oxygen consumption level offand finally drop at a critical temperature as shown in the squat lobster,Munida rugosa (Zainal et al., 1992), in porcelain crabs,Petrolisthes cinctipesand P. eriomerus (Stillman and Somero, 1996) and in the spider crab, Maja squinado(Frederich and P ¨ortner, 2000).
A schematic model of heart rate changes inHyas araneusillustrates how the thermal
25
BGD
6, 2837–2861, 2009Impact of anthropogenic ocean
acidification
K. Walther et al.
Title Page
Abstract Introduction
Conclusions References
Tables Figures
◭ ◮
◭ ◮
Back Close
Full Screen / Esc
Printer-friendly Version
Interactive Discussion tolerance window is influenced by seasonal acclimation to temperature resulting in a
narrower window during winter, associated with lower metabolic rates and higherQ10 value than in summer (Wittmann et al., 2008).
We can conclude that CO2 induced ocean acidification has the potential to cause a narrowing of thermal windows eliciting similar phenomena as observed during
sea-5
sonal acclimation to temperature. At the same time animals which are permanently exposed to acidification may lose their capability to acclimate to extreme temperatures. With an increase of ambient temperature as predicted by the IPCC (2001, 2007) in-creased ocean acidification (Caldeira and Wickett, 2005) will cause animals to reach their physiological limits sooner. As a consequenceHyas araneuswill lose its southern
10
habitats and experience a stronger northward shift of biogeographical boundaries.
Acknowledgements. This work is a contribution to the “European Project on Ocean Acidifica-tion” (EPOCA) which received funding from the European Community’s Seventh Framework Programme (FP7/2007-2013) under grant agreement n 211384. EPOCA is endorsed by the International Programme LOICZ. Supported by the Mar Co POL I research program of
Alfred-15
Wegener-Institute. We would like to thank T. Hirse for excellent technical assistance.
References
Ahsanullah, M. and Newell, R. C.: Factors affecting the heart rate of the shore crab Carcinus maenas(L.), Comp. Biochem. Physiol., 39A, 277–287, 1971.
Bern ´ardez, C., Gonz ´alez-Gurriar ´an, E., Garc´ıa-Calvo, B., Corgos, A, and Freire, J.: Movements
20
of juvenile and adult spider crab (Maja squinado) in the Ria da Coruna (N-W Spain), Aquatic telemetry: advances and applications, Proceedings of the Fifth Conference on Fish Teleme-try held in Europe, Ustica, Italy, 9–13 June 2003, Rome, FAO/COISPA, 295 pp., 2005. Bock, C., Frederich, M., Wittig, R.-M., and P ¨ortner, H. O.: Simultaneous observations of
haemolymph flow and ventilation in marine spider crabs at different temperatures: a flow
25
weighted MRI study, Magn. Reson. Imaging, 19, 1113–1124, 2001.
car-BGD
6, 2837–2861, 2009Impact of anthropogenic ocean
acidification
K. Walther et al.
Title Page
Abstract Introduction
Conclusions References
Tables Figures
◭ ◮
◭ ◮
Back Close
Full Screen / Esc
Printer-friendly Version
Interactive Discussion
bon dioxide emissions to the atmosphere and ocean, J. Geophys. Res., 110, C09S04, doi:10.1029/2004JC002671, 2005.
Cameron, J. N.: Effects of Hypercapnia on Blood Acid-Base Status, NaCl Fluxes, and Trans-Gill Potential in Freshwater Blue crabs,Callinectes sapidus, J. Comp. Physiol., 123, 137–141, 1978.
5
Cameron, J. N.: Compensation of hypercapnic acidosis in the aquatic blue crab,Callinectes sapidus: the predominance of external sea water over carapace carbonate as the proton sink, J. Exp. Biol., 114, 197–206, 1985.
Cameron, J. N. and Iwama, G. K.: Compensation of progressive hypercapnia in channel catfish and blue crabs, J. Exp. Biol., 133, 183–197, 1987.
10
Christiansen, M. E. (Ed.): Crustacea Decapoda Brachyura, in: Marine Invertebrates of Scandi-navia, No. 2, Universitetsforlaget, Oslo, Norway, 1969.
Cuculescu, M., Hyde, D., amd Bowler, K.: Thermal tolerance of two species of marine crab,
Cancer pagurusandCarcinus maenas, J. Therm. Biol., 23, 107–110, 1998.
DeFur, P. L. and Mangum, C. P.: The effects of environmental variables on the heart rate of
15
invertebrates, Comp. Biochem. Physiol., 62A, 283–294, 1979.
De Wachter, B. and Wilkens, J. L.: Comparison of Temperature Effects on Heart Performance of the Dungeness Crab, Cancer magister, in vitro and in vivo, Biol. Bull., 190, 385–395, 1996.
Florey, E. and Kriebel, M. E.: The effects of temperature, anoxia and sensory stimulation on
20
the heart rate of unrestrained crabs, Comp. Biochem. Physiol., 48A, 285–300, 1974. Frederich, M. and P ¨ortner, H. O.: Oxygen limitation of thermal tolerance defined by cardiac
and ventilatory performance in spider crab, Maja squinado, Am. J. Physiol. Reg. I., 279, R1531–R1538, 2000.
Frederich, M., Sartoris, F. J., Arntz, W. E., and P ¨ortner, H. O.: Haemolymph Mg2+regulation in
25
decapod crustaceans: Physiological correlates and ecological consequences in polar areas, J. Exp. Biol., 203, 1383–1393, 2000.
IPCC: Climate Change 2001: Third Assessment Report of the Intergovernmental Panel on Climate Change, Campridge University Press, Campridge, UK, 2001.
IPCC: Climate Change 2007, Fourth Assessment Report of the Intergovernmental Panel on
30
Climate Change, Cambridge University Press, Cambridge, UK, 2007.
BGD
6, 2837–2861, 2009Impact of anthropogenic ocean
acidification
K. Walther et al.
Title Page
Abstract Introduction
Conclusions References
Tables Figures
◭ ◮
◭ ◮
Back Close
Full Screen / Esc
Printer-friendly Version
Interactive Discussion virginicaGmelin), Am. J. Physiol. Reg. I., 294, R1338–R2346, 2008.
McMahon, B., Sinclair, F., Hassall, C. D., deFur, P. L., and Wilkes, P. R. H.: Ventilation and Control of Acid-Base Status During Temperature Acclimation in the Crab,Cancer magister, J. Comp. Physiol., 128, 109–116, 1978.
Melzner, F., Bock, C., and P ¨ortner, H. O.: Critical temperatures in the cephalopodSepia offi
ci-5
nalisinvestgated using in vivo31P NMR spectroscopy, J. Exp. Biol, 209, 891–906, 2006. Metzger, R., Sartoris, F. J., Langenbuch, M., and P ¨ortner, H. O.: Influence of elevated CO2
concetrations on thermal tolerance of the edible crabCancer pagurus, J. Therm. Biol., 32, 144–151, 2007.
Pane, E. F. and Barry, J. P.: Extracellular acid-base regulation during short-term hypercapnia
10
is effective in a shallow-water crab, but uneffective in a deep-sea crab, Mar. Ecol. Prog. Ser., 334, 1–9, 2007.
P ¨ortner, H. O.: Climate variations and the physiologial basis of temperature dependent bio-geography: systemic to molecular hierarchies of thermal tolerance in animals, Comp. Biochem. Phys. A, 132, 739–761, 2002.
15
P ¨ortner, H. O., Langenbuch, M., and Michaelidis, B.: Synergistic effects of temperature ex-tremes, hypoxia, and increases in CO2 on marine animals: From Earth history to global change, J. Geophys. Res., 110, C09S10, doi:10.1029/2004JC002561, 2005.
P ¨ortner, H. O.: Climate-dependent evolution of Antarctic ectotherms: an integrative anaysis, Deep-Sea Res. II, 53, 1071–1104, 2006.
20
P ¨ortner, H. O. and Knust, R.: Climate Change Affects Marine Fishes Through the Oxygen Limitation of Thermal Tolerance, Science, 315, 95–97, doi:10.1126/science.1135471, 2007. P ¨ortner, H. O.: Ecosystem effects of ocean acidification in times of ocean warming: a
physiol-ogist’s view, Mar. Ecol. Prog. Ser., 373, 203–217, 2008.
P ¨ortner, H. O. and Farrell, A. P.: Physiology and Climate Change, Science, 322, 690–692,
25
doi:10.1126/science.1163156, 2008.
Spicer, J. I., Raffo, A., and Widdicombe, S.: Influence of CO2-related seawater acidification on extracellular acid-base balance in the velvet swimming crabNecora puber, Mar. Biol., 151, 1117–1125, 2007.
Stillman, J. H. and Somero, G. N.: Adaption to temperature stress and aerial exposure in
con-30
Ger-BGD
6, 2837–2861, 2009Impact of anthropogenic ocean
acidification
K. Walther et al.
Title Page
Abstract Introduction
Conclusions References
Tables Figures
◭ ◮
◭ ◮
Back Close
Full Screen / Esc
Printer-friendly Version
Interactive Discussion
land, S., Ørbæk, J. B., Bischof, K., Papucci, C., Zajaczkowski, M., Azzolini, R., Bruland, O., Wiencke, C., Winther, J.-G., and Dallmann, W.: The physical environment of Kongsfjorden-Krossfjorden, an Arctic fjord system in Svalbard, Polar Res., 21(1), 133–166, 2002.
Truchot, J.-P.: Water carbonate alkalinity as a determinant of hemolymoh acid-base balance in the shore crab,Carcinus maenas: a study at two different ambientpCO2andpO2levels, J.
5
Comp. Physiol. B, 154, 601–606, 1984.
Wickins, J. F.: The effect of hypercapnic sea water on growth and mineralization in penaeid prawns, Aquaculture, 41, 37–48, 1984.
Wiltshire, K. H. and Manly, B. F. J.: The warming trend at Helgoland Roads, North Sea: phyto-plankton response, Helgoland Mar. Res., 58, 269–273, 2004.
10
Wittmann, A. C., Schr ¨oer, M., Bock, C., Steeger, H.-U., Paul, R. J., and P ¨ortner, H.-O.: Indi-cators of oxygen- and capacity-limited thermal tolerance in the lugwormArenicola marina, Climate Res., 37, 227–240, 2008.
Worden, M. K., Clark, C. M., Conaway, M., and Qadri, S. A.: Temperature dependence of cardiac performance in the lobster Homarus americanus, J. Exp. Biol., 209, 1024–1034,
15
2006.
BGD
6, 2837–2861, 2009Impact of anthropogenic ocean
acidification
K. Walther et al.
Title Page
Abstract Introduction
Conclusions References
Tables Figures
◭ ◮
◭ ◮
Back Close
Full Screen / Esc
Printer-friendly Version
Interactive Discussion
Table 1. Q10and heart rate (in beats/min) ofHyas araneus (Tc=x◦C; x(normocapnia)>25◦C, x(710 ppm)=23.5◦C, x(3000 ppm)
=21.1◦C).
Temperature range Normocapnia 710 ppm 3000 ppm
◦C
0–10 Q10 1.26 1.35 1.32
Heart rate 37.82–47.80 37.73–50.85 36.73–48.52
0–6 Q10 1.30 1.21 0.96
Heart rate 37.82–44.26 37.73–42.27 36.73–35.79
6–10 Q10 1.21 1.59 2.14
Heart rate 44.26–47.80 42.27–50.85 35.79–48.52
10–Tc Q10 <1.05 1.19 1.17
Heart rate 47.39–≈51.19 48.90–61.67 52.49–62.52
0–Tc Q10 <1.13 1.23 1.29
Heart rate 37.82–≈51.19 37.73–61.67 36.73–62.52
6–Tc Q10 <1.08 1.24 1.45
BGD
6, 2837–2861, 2009Impact of anthropogenic ocean
acidification
K. Walther et al.
Title Page
Abstract Introduction
Conclusions References
Tables Figures
◭ ◮
◭ ◮
Back Close
Full Screen / Esc
Printer-friendly Version
Interactive Discussion
Table 2.Comparison ofQ10values and heart rates of different crustaceans.
Species Temperature range Q10 Heart rate Reference
◦C beats/min
Cancer magister 4–19 2 40–120 Florey and Kriebel, 1974
Cancer magister 5–30 4 28–55 DeWachter and Wilkens, 1996
Carcinus maenas 5–15 2.19 30–70 Ahsanullah and Newell, 1971
Carcinus maenas 20–30 1.4 80–130 Ahsanullah and Newell, 1971
Homarus americanus 2–18 2–3 15–50 Worden et al., 2006
Hyas araneus 0–7 6 18–40 Frederich et al., 2000
Hyas araneus 0–10 1.26 37.82–47.80 this study
BGD
6, 2837–2861, 2009Impact of anthropogenic ocean
acidification
K. Walther et al.
Title Page
Abstract Introduction
Conclusions References
Tables Figures
◭ ◮
◭ ◮
Back Close
Full Screen / Esc
Printer-friendly Version
Interactive Discussion
BGD
6, 2837–2861, 2009Impact of anthropogenic ocean
acidification
K. Walther et al.
Title Page
Abstract Introduction
Conclusions References
Tables Figures
◭ ◮
◭ ◮
Back Close
Full Screen / Esc
Printer-friendly Version
Interactive Discussion
BGD
6, 2837–2861, 2009Impact of anthropogenic ocean
acidification
K. Walther et al.
Title Page
Abstract Introduction
Conclusions References
Tables Figures
◭ ◮
◭ ◮
Back Close
Full Screen / Esc
Printer-friendly Version
Interactive Discussion
Fig. 3.Discontinuities in the temperature dependence of heart rate data (means) between 10 and 25◦C under
normo-capnia, 710 ppm CO2and 3000 ppm CO2, analysed from linear regressions intersecting at the respective breakpoints, defined as critical temperatures (Tc). Data under normocapnia revealed no breakpoint in the tested temperature
range. Under 710 ppm, theTc was 23.5◦C, under 3000 ppm, theTc was 21.1◦C. Regressions under 710 ppm are:
f(10–23.5◦C)=46.44+(0.6482
±0.01816)·x,p<0.0001,f(23.5–25◦C)=296.8+(
−10±0.7759)·x,p<0.0001. Regressions under 3000 ppm are: f(10–21.1◦C)=45.59+(0.8025
±0.031)·x, p<0.0001, f(21.1–25◦C)=131.5+(
BGD
6, 2837–2861, 2009Impact of anthropogenic ocean
acidification
K. Walther et al.
Title Page
Abstract Introduction
Conclusions References
Tables Figures
◭ ◮
◭ ◮
Back Close
Full Screen / Esc
Printer-friendly Version
Interactive Discussion
Fig. 4.Combined depiction of PeO2(black) and heart rate (grey) data (means) ofHyas araneus
BGD
6, 2837–2861, 2009Impact of anthropogenic ocean
acidification
K. Walther et al.
Title Page
Abstract Introduction
Conclusions References
Tables Figures
◭ ◮
◭ ◮
Back Close
Full Screen / Esc
Printer-friendly Version
Interactive Discussion
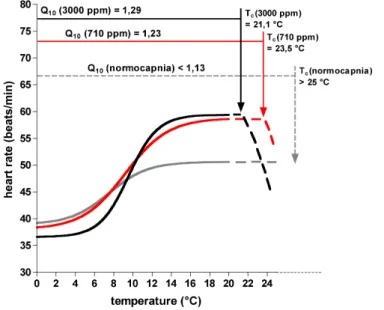
Fig. 5. Schematic model of heart rate in Hyas araneusunder normocapnia (grey), 710 ppm (red) and 3000 ppm (black) CO2 at temperatures between 0 and 25◦C. Note the shift in heart rate thermal response, reflected inQ10 values, which were larger under 3000 ppm than under 710 ppm or normocapnia. As a result, onset of a drop in heart rate and upper critical tem-perature was seen at lower temtem-peratures under 3000 than under 710 ppm. Heart rate under normocapnia showed no warming induced decrement. Non-linear regression fit with Boltz-mann sigmoidal equation for normocapnia: y=38.92+(50.60–38.92)/(1+exp((7.502–x)/2.014));