BGD
8, 10617–10644, 2011
Impact of rapid sea-ice reduction on
the rate of ocean acidification
A. Yamamoto et al.
Title Page
Abstract Introduction
Conclusions References
Tables Figures
◭ ◮
◭ ◮
Back Close
Full Screen / Esc
Printer-friendly Version
Interactive Discussion
Discussion
P
a
per
|
Dis
cussion
P
a
per
|
Discussion
P
a
per
|
Discussio
n
P
a
per
|
Biogeosciences Discuss., 8, 10617–10644, 2011 www.biogeosciences-discuss.net/8/10617/2011/ doi:10.5194/bgd-8-10617-2011
© Author(s) 2011. CC Attribution 3.0 License.
Biogeosciences Discussions
This discussion paper is/has been under review for the journal Biogeosciences (BG). Please refer to the corresponding final paper in BG if available.
Impact of rapid sea-ice reduction in the
Arctic Ocean on the rate of ocean
acidification
A. Yamamoto1,2, M. Kawamiya1, A. Ishida1,3, Y. Yamanaka1,2, and S. Watanabe1
1
Japan Agency for Marine-Earth Science and Technology, Yokohama, Japan 2
Graduate school of Environmental Science, Hokkaido University, Sapporo, Japan 3
Department of Social Environment, Fuji Tokoha University, Fuji, Japan
Received: 7 October 2011 – Accepted: 21 October 2011 – Published: 28 October 2011
Correspondence to: A. Yamamoto ([email protected])
BGD
8, 10617–10644, 2011
Impact of rapid sea-ice reduction on
the rate of ocean acidification
A. Yamamoto et al.
Title Page
Abstract Introduction
Conclusions References
Tables Figures
◭ ◮
◭ ◮
Back Close
Full Screen / Esc
Printer-friendly Version
Interactive Discussion
Discussion
P
a
per
|
Dis
cussion
P
a
per
|
Discussion
P
a
per
|
Discussio
n
P
a
per
|
Abstract
The largest pH decline and widespread undersaturation with respect to aragonite in this century due to uptake of anthropogenic carbon dioxide in the Arctic Ocean have been projected. The reductions in pH and aragonite saturation state have been caused primarily by an increase in the concentration of atmospheric carbon dioxide. However, 5
in a previous study, simulations with and without warming showed that these reductions in the Arctic Ocean also advances due to the melting of sea ice caused by global warm-ing. Therefore, future projections of pH and aragonite saturation in the Arctic Ocean will be affected by how rapidly the reduction in sea ice occurs. In this study, the impact of sea-ice reduction rate on projected pH and aragonite saturation state in the Arctic 10
surface waters was investigated. Reductions in pH and aragonite saturation were cal-culated from the outputs of two versions of an earth system model (ESM) with different sea-ice reduction rates under similar CO2 emission scenarios. The newer model
ver-sion projects that Arctic summer ice-free condition will be achieved by the year 2040, and the older version predicts ice-free condition by 2090. The Arctic surface water was 15
projected to be undersaturated with respect to aragonite in the annual mean when at-mospheric CO2concentration reached 480 (550) ppm in year 2040 (2048) in new (old) version. At an atmospheric CO2 concentration of 520 ppm, the maximum differences
in pH and aragonite saturation state between the two versions were 0.08 and 0.15, respectively. The analysis showed that the decreases in pH and aragonite saturation 20
state due to rapid sea-ice reduction were caused by increases in both CO2uptake and
freshwater input. Thus, the reductions in pH and aragonite saturation state in the Arctic surface waters are significantly affected by the difference in future projections for sea-ice reduction rate. The critical CO2 concentration, at which the Arctic surface waters
become undersaturated with respect to aragonite on annual mean bias, would be lower 25
BGD
8, 10617–10644, 2011
Impact of rapid sea-ice reduction on
the rate of ocean acidification
A. Yamamoto et al.
Title Page
Abstract Introduction
Conclusions References
Tables Figures
◭ ◮
◭ ◮
Back Close
Full Screen / Esc
Printer-friendly Version
Interactive Discussion
Discussion
P
a
per
|
Dis
cussion
P
a
per
|
Discussion
P
a
per
|
Discussio
n
P
a
per
|
1 Introduction
The emission of large amounts of anthropogenic carbon dioxide (CO2) has increased
global atmospheric CO2 concentration from a preindustrial value of 280 ppm to
384 ppm in 2007, and is contributing to global warming (IPCC, 2007). Rising atmo-spheric CO2 and global warming are tempered by oceanic uptake, which absorbs
5
nearly one-third of anthropogenic CO2 released to the atmosphere (Sabine et al.,
2004). However, anthropogenic CO2 penetration into the ocean increases hydrogen ion concentration and causes a reduction in pH, a process known as ocean acidifica-tion. The average surface ocean pH has already decreased by about 0.1 (from a pH of 8.2 to 8.1) since the 1700s due to absorption of anthropogenic CO2 (Royal Society, 10
2005), and a previous modeling study suggested that an additional decrease of 0.3– 0.4 will occur when atmospheric CO2concentration reaches 800 ppm by the year 2100
(Orr et al., 2005). This reduction in ocean pH has some direct effects on many marine organisms (Seibel and Walsh, 2001; Ishimatsu et al., 2005).
Carbonate ion (CO23−) concentrations and the saturation state (Ω) of calcium car-15
bonate (CaCO3) minerals such as calcite and aragonite also are decreased due to dissolution of CO2 into the ocean. Carbonate ions are required by marine calcifying
organisms such as plankton, shellfish, coral, and fish to produce CaCO3 shells and
skeletons. Shell and skeleton formation generally occurs in supersaturated seawater (Ω>1.0) and dissolution occurs in undersaturated seawater (Ω<1.0). Thus, CaCO3
20
saturation state is a key variable for assessing the biological impacts of ocean acid-ification. In surface waters, Ω is lower in cold high-latitude oceans than in tropical and temperate oceans because of increased CO2solubility, the sensitivity of acid-base
dissociation coefficients at cold temperatures, and ocean mixing patterns. Although surface waters in high-latitude oceans today are generally supersaturated with respect 25
BGD
8, 10617–10644, 2011
Impact of rapid sea-ice reduction on
the rate of ocean acidification
A. Yamamoto et al.
Title Page
Abstract Introduction
Conclusions References
Tables Figures
◭ ◮
◭ ◮
Back Close
Full Screen / Esc
Printer-friendly Version
Interactive Discussion
Discussion
P
a
per
|
Dis
cussion
P
a
per
|
Discussion
P
a
per
|
Discussio
n
P
a
per
|
water in the Arctic Ocean may already be undersaturated with respect to aragonite (Gangstø et al., 2008) or will become undersaturated within a decade under the A2 Scenario of the Special Report on Emissions Scenarios (SRES-A2) (Steinacher et al., 2009). After that, undersaturation will begin to occur in the Southern Ocean by 2030 (McNeil and Matear, 2008), and the North Pacific by 2100 under IS92a scenario, which 5
is similar to the SRES-A2 scenario (Orr et al., 2005). Therefore, understanding the aragonite saturation state (Ωarag) decreases in the Arctic Ocean, which is projected to
be the first ocean to experience undersaturation, is important for avoiding the risk of large changes in marine ecosystems.
Future surface pH and Ωarag value closely track changes in atmospheric CO2
be-10
cause the equilibrium of dissolved inorganic carbon follows well-established chemistry in seawater and the effect of climate change is relatively small (Orr et al., 2005; Zeebe et al., 2008). Steinacher et al. (2009) suggested that sea-ice reduction in the Arctic Ocean reduces pH and Ωarag by comparing the simulations with and without
warm-ing. This is because, the increases in CO2uptake by air-sea gas exchange due to the
15
disappearance of sea-ice cover and freshwater input from increased precipitation, river runoff, and ice melt decrease pH andΩaragin the Arctic Ocean. Thus, projections of pH
andΩaragvalues for the Arctic Ocean are affected by sea-ice reduction due to climate
change. In most model projections adopted for IPCC AR4, summer sea ice in the Arctic Ocean will still remain until 2100, and only a few models predict sea-ice free Arctic in 20
September by the end of the twenty-first century. However the observed recent Arctic sea-ice loss has been more rapid than projected in these models adopted for IPCC AR4 (Stroeve et al., 2007). Wang and Overland (2009) predicted sea-ice free Arctic in September by the year 2037, by correcting biases in six IPCC AR4 models based on the extent of the observed 2007 September sea ice as a starting point. The rate of 25
BGD
8, 10617–10644, 2011
Impact of rapid sea-ice reduction on
the rate of ocean acidification
A. Yamamoto et al.
Title Page
Abstract Introduction
Conclusions References
Tables Figures
◭ ◮
◭ ◮
Back Close
Full Screen / Esc
Printer-friendly Version
Interactive Discussion
Discussion
P
a
per
|
Dis
cussion
P
a
per
|
Discussion
P
a
per
|
Discussio
n
P
a
per
|
In this study, the relation between rates of sea-ice reduction and surface ocean acid-ification was investigated by comparing the rates of ocean acidacid-ification from outputs of two versions of an earth system model (ESM) in which different sea-ice reduction rates are projected under similar CO2 emission scenarios. One ESM projects summer
ice-free condition by the year 2040 under the Representative Concentration Pathways 8.5 5
(RCP8.5) scenario (Moss et al., 2010), and the other ESM by 2090 under the SRES A2 scenario. First, pH andΩarag projected for both models are compared with the
ob-served value, and model biases are calculated. Then, we investigate the difference in fundamental variables between two versions of ESM due to rapid sea-ice reduction. The surface pH and Ωarag modified by removing model biases were compared, and
10
the areal fraction occupied by undersaturated surface water that increases with atmo-spheric CO2 concentration for our two versions of ESM was calculated. This was an
estimate of the impact of sea-ice reduction on the rate of ocean acidification in the Arctic Ocean. The mechanisms promoting ocean acidification due to rapid sea-ice re-duction, and the difference in behavior between pH andΩarag under high atmospheric
15
CO2 concentrations are discussed. The change of the seasonal cycle due to sea-ice
reduction also was discussed.
2 Methods
2.1 Models and experiments
The two versions of ESM used were MIROC-ESM (Watanabe et al., 2011) and its pro-20
totype version (Kawamiya et al., 2005). Hereafter, these two versions are designated the “new” version (NV) and “old” version (OV), respectively. OV was adopted for the Coupled Climate-Carbon Cycle Model Intercomparison Project (C4MIP) with a name “FRCGC” (Friedlingstein et al., 2006); it made a significant contribution to IPCC AR4. NV was developed for IPCC AR5. Two versions are based on the physical climate 25
BGD
8, 10617–10644, 2011
Impact of rapid sea-ice reduction on
the rate of ocean acidification
A. Yamamoto et al.
Title Page
Abstract Introduction
Conclusions References
Tables Figures
◭ ◮
◭ ◮
Back Close
Full Screen / Esc
Printer-friendly Version
Interactive Discussion
Discussion
P
a
per
|
Dis
cussion
P
a
per
|
Discussion
P
a
per
|
Discussio
n
P
a
per
|
and river routine are coupled by a flux coupler without flux adjustments (K-1 Model De-velopers, 2004). The atmospheric model used in OV (NV) has a horizontal resolution of T42, approximately equivalent to a 2.8◦ grid size with 20 (80) vertical levels. The ocean and sea-ice model in both versions is the same. The ocean model has a zonal resolution of 1.4◦ and a spatially varying meridional resolution that is about 0.56◦ at 5
latitudes lower than 8◦ and 1.4◦ at latitudes higher than 65◦ and changes smoothly in between. The vertical coordinate is a hybrid of sigma-z, resolving 44 levels in total: 8 sigma-layers near the surface, and 35 z-layers beneath, plus one boundary layer. The sea ice is based on a two-category thickness representation, zero-layer thermodynam-ics (Semtner, 1976), and dynamthermodynam-ics using elastic-viscous-plastic rheology (Hunke and 10
Dukowicz, 1997).
On the basis of MIROC, NV incorporates the terrestrial ecosystem model SEIB-DGVM (Sato et al., 2007) dealing with dynamic vegetation, and OV has Sim-CYCLE (Ito and Oikawa, 2002), which is a terrestrial carbon model with fixed vegetation. Ocean biological and chemical processes in both versions are represented by a four-15
compartment model consisting of nutrients, phytoplankton, zooplankton, and detritus (Oschlies and Garcon, 1999; Oschlies, 2001). This NPZD type ocean ecosystem model is enough to resolve the seasonal excursion of oceanic biological activities on a basin scale (Kawamiya et al., 2000). In addition, a series of inorganic carbon reactions have been introduced following recommendations by the Ocean Carbon Pattern Model 20
Intercomparison Project (OCMIP) (Orr et al., 1999).
We used model outputs of OV conducted by Yoshikawa et al. (2008) under SRES A2 (Fig. 1a). The results of MIROC spin-up conducted by the K-1 Model Developers (2004) were provided for the physical climate system. The spin-up run for the carbon cycle component in OV was conducted by running the integrated model for 250 years, 25
starting with the initial conditions based on climatologic data sets until globally inte-grated net CO2 fluxes at land and sea surfaces vanished. Historical simulation was
BGD
8, 10617–10644, 2011
Impact of rapid sea-ice reduction on
the rate of ocean acidification
A. Yamamoto et al.
Title Page
Abstract Introduction
Conclusions References
Tables Figures
◭ ◮
◭ ◮
Back Close
Full Screen / Esc
Printer-friendly Version
Interactive Discussion
Discussion
P
a
per
|
Dis
cussion
P
a
per
|
Discussion
P
a
per
|
Discussio
n
P
a
per
|
2000–2100. The spin-up run and historical simulation using a set of external forc-ings recommended by the Coupled Model Intercomparison Project phase-5 (CMIP5) throughout 1850–2005 in NV were conducted by Watanabe et al. (2011). The RCP8.5 was given for 2006–2100 in NV. It may be noteworthy that atmospheric CO2
concen-tration in OV was predicted by the carbon-cycle components with the given CO2 emis-5
sions, while it was provided as input data for NV following the CMIP5 protocol. There was little difference in atmospheric CO2 concentration between two versions, with a
maximum difference of 60 ppm in 2100.
2.2 Carbonate calculation and target area
Model outputs of seawater temperature (T), salinity (S), alkalinity (Alk), and dissolved 10
inorganic carbon (DIC), and observational values of phosphate (PO34−) and silicate (Si(OH)4) were used for deriving diagnosis on carbonate chemistry. These two obser-vational datasets were used from the World Ocean Atlas 2005 (Locarnini et al., 2006) because these two parameters are not calculated in our ESM. However, the influence of treatments such as PO34− and Si(OH)4 on pH and Ωarag are very small. To
com-15
pute pH and carbonate ion values, the parameters and the chemistry routine from the OCMIP-3 project (http://ocmip5.ipsl.jussieu.fr/OCMIP) were used. Surface CaCO3
sol-ubility product was calculated based on Mucci (1983) and the pressure effect based on Millero (1995). For comparison with projected pH andΩarag, observed values were
calculated using OCMIP chemistry routine and the data ofT,S, Alk, DIC, PO34−, and 20
Si(OH)4 from the Arctic Ocean Expedition 1991 (ODEN-91, cruise 77DN1991072),
Arctic Ocean Section 1994 (AOS-94, cruise 18SN19940726), and the Arctic Climate System Study 1996 (ARCSYS-96, cruise 06AQ19960712). These data are available from the CARINA database (http://cdiac.ornl.gov/oceans/CARINA/Carina table.html). The pH andΩarag values in more recent periods were calculated using observed T,
25
BGD
8, 10617–10644, 2011
Impact of rapid sea-ice reduction on
the rate of ocean acidification
A. Yamamoto et al.
Title Page
Abstract Introduction
Conclusions References
Tables Figures
◭ ◮
◭ ◮
Back Close
Full Screen / Esc
Printer-friendly Version
Interactive Discussion
Discussion
P
a
per
|
Dis
cussion
P
a
per
|
Discussion
P
a
per
|
Discussio
n
P
a
per
|
The target area of Arctic Ocean defined here is north of 65◦N, except for the Labrador Sea and Greenland, Iceland, Norwegian, and Barents Seas (<80◦N and 35◦W–60◦E) where sea ice does not exist in OV or NV. Those areas were excluded from the anal-ysis because the present study focuses on the effect of sea-ice reduction on ocean acidification.
5
3 Results
3.1 Comparison of pH and aragonite saturation between model and observation
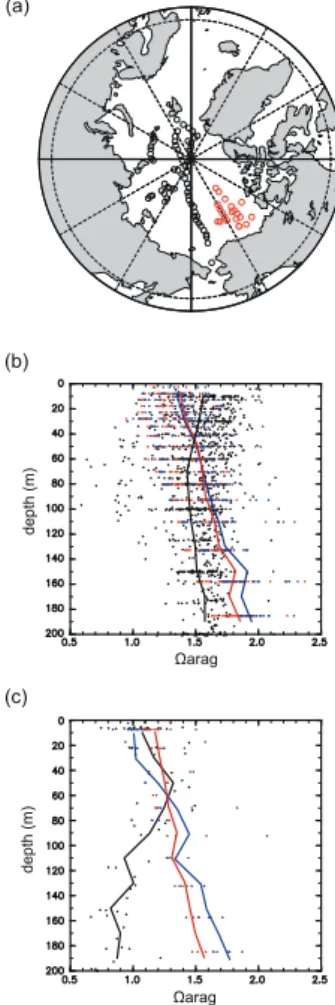
The Ωarag and pH in the top 200 m of the Arctic Ocean predicted in the two model
versions were compared with observed values calculated from ODEN-91, AOS-94, ARCSYS-96, and JOIS 08 for the same place and time (Fig. 2). A comparison of the 10
two model versions with the 1990s observations of ODEN-91, AOS-94, and ARCSYS-96 reveals that OV (NV) tends to underestimate Ωarag by 0.21 (0.23) at the surface,
although the underestimation decreases significantly toward a depth of about 45 m. The projected Ωarag below 45 m is overestimated by up to 0.3 (0.4). In comparison
with JOIS 08, OV (NV) tends to overestimate (underestimate)Ωaragby 0.1 (0.07) at the
15
surface. Below 60 m, the projectedΩaragis greatly overestimated by up to 0.73 (0.89).
The difference in modern sea-ice extent projected in the two versions does not make a significant difference in Ωarag in the Arctic surface waters. The projected average
surface pH in the Arctic Ocean for both versions is about 0.02 lower than the observed values.
20
3.2 Comparison of physical and carbon-system variables between the two
model versions
BGD
8, 10617–10644, 2011
Impact of rapid sea-ice reduction on
the rate of ocean acidification
A. Yamamoto et al.
Title Page
Abstract Introduction
Conclusions References
Tables Figures
◭ ◮
◭ ◮
Back Close
Full Screen / Esc
Printer-friendly Version
Interactive Discussion
Discussion
P
a
per
|
Dis
cussion
P
a
per
|
Discussion
P
a
per
|
Discussio
n
P
a
per
|
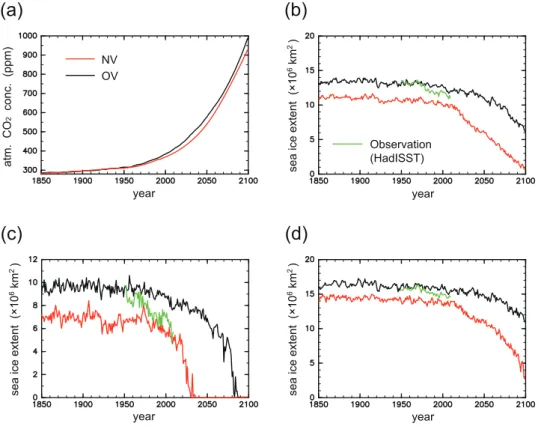
(HadISST) (Fig. 1). The sea ice extent is defined here as the total area of grid cells with a sea ice concentration greater than 15 %, as adopted by Wang and Overland (2009). In September, observed sea-ice extent was 9.4×10⁶km2 in 1950, which rapidly de-creased to 4.6×10⁶km2 by 2007. NV reproduces the observed decrease well from 1970 and projects ice-free condition in September by 2040. In contrast, OV overes-5
timates sea-ice extent in September by up to 80 % and projects ice-free condition by 2090. The September ice-free condition by 2040 projected in NV is consistent with recent studies (Holland et al., 2006; Stroeve et al., 2007; Wang and Overland, 2009). The projected summer sea-ice reduction for both versions are more rapid than in the Climate System Model CSM1.4-carbon of the US National Center for Atmospheric Re-10
search, which was used by Steinacher et al. (2009) for analyzing Arctic acidification, in which the sea-ice extent in September is 2.3×10⁶km2in 2100 under the SRES A2 scenario. The rapid sea-ice reduction in NV results in ice-free condition lasting more than 6 months and changing the Arctic Ocean into a seasonal sea-ice zone after 2080, whereas that condition lasts only 2 months in 2100 for OV. In March, the observed 15
sea-ice extent is 15.6×10⁶km2in 1950, and gradually decreases to 14.5×10⁶km2by 2007. NV (OV) underestimates (overestimates) sea-ice extent in March, however, the differences in March sea-ice extent between the two model versions and the direct ob-servations are within 10 %. The sea-ice extent in March projected by NV (OV) remains greater than 20 % (70 %) of the observed present-day value until 2100.
20
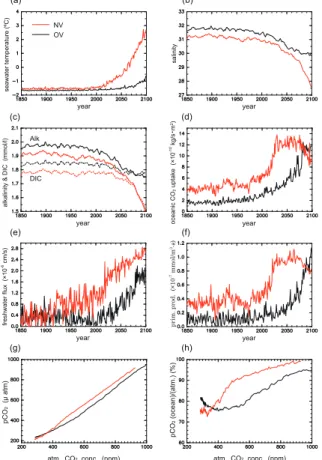
Disappearance of sea ice enhances CO2 uptake through changes in air-sea gas
exchange and marine biological productivity due to an increase in sea surface temper-ature and light penetration. Increased freshwater input due to melting of sea ice dilutes salinity, total CO2 and alkalinity. Thus, NV with rapid sea-ice reduction yields an
ear-lier and greater increase in seawater temperature, CO2 uptake, and marine biological
25
BGD
8, 10617–10644, 2011
Impact of rapid sea-ice reduction on
the rate of ocean acidification
A. Yamamoto et al.
Title Page
Abstract Introduction
Conclusions References
Tables Figures
◭ ◮
◭ ◮
Back Close
Full Screen / Esc
Printer-friendly Version
Interactive Discussion
Discussion
P
a
per
|
Dis
cussion
P
a
per
|
Discussion
P
a
per
|
Discussio
n
P
a
per
|
up to 2100, because an increase in DIC due to CO2 uptake is offset by a decrease in DIC due to freshwater input and biological processes.
Furthermore, the partial pressure of carbon dioxide (pCO2) in the Arctic surface
waters is lower than in the atmosphere, partly because sea ice limits air-sea gas ex-change. SeptemberpCO2 values in the Arctic surface waters reproduced by the two
5
model versions is about 290 µatm in the 1990s (atmospheric CO2≈360 ppm), which
is consistent with the observations by Jutterstr ¨om and Anderson (2010), who reported a typical value less than 300 µatm. A reduction in sea ice enables the ocean to come closer to equilibrium with the atmosphere. Therefore, when the atmospheric CO2
ex-ceeds 340 ppm, the rapid increase in CO2uptake due to rapid summer sea-ice reduc-10
tion raises seawaterpCO2in NV more than in OV under the same atmospheric CO2 concentration. The maximum difference in annual mean surface waterpCO2 between
the two model versions is 80 µatm at 520 ppm (year≈2045, which is a few years after the difference in summer sea-ice extent reaches a maximum). After that, the increase inpCO2in OV by CO2uptake due to summer sea-ice reduction is greater than that in
15
NV due to winter sea-ice reduction. Thus, the difference inpCO2between two versions
decreased to 50 µatm. Simulated saturation fractions, defined here as oceanicpCO2 values in terms of fraction of the saturation value with respect to atmospheric CO2
con-centration, are less than 80 % before 2000. The saturation fractions in both versions increased to 90 % near the time when the Arctic Sea becomes ice-free in summer, and 20
then slowly approach 100 %.
3.3 Comparison of pH and aragonite saturation between two versions
In this section, we compare the bias-corrected annual meanΩarag and pH averaged
in the Arctic surface waters between our two model versions. The averaged model bias was applied to all model grids of the Arctic surface water, since focus is on the 25
difference in changes of Ωarag resulting from sea-ice reduction averaged across the
BGD
8, 10617–10644, 2011
Impact of rapid sea-ice reduction on
the rate of ocean acidification
A. Yamamoto et al.
Title Page
Abstract Introduction
Conclusions References
Tables Figures
◭ ◮
◭ ◮
Back Close
Full Screen / Esc
Printer-friendly Version
Interactive Discussion
Discussion
P
a
per
|
Dis
cussion
P
a
per
|
Discussion
P
a
per
|
Discussio
n
P
a
per
|
quantities. The modified DIC (DIC(mod.)) after removing model bias is described by
DIC(mod.)=DIC(model)−DIC(corr.)−DIC(obs.), where DIC(model.) is the value projected in
the respective version. DIC(corr.)−DIC(obs.) is the average model bias of DIC between
the observed values (DIC(obs.)) from ODEN-91, AOS-94, ARCSYS-96, and JOIS 08, and the model values (DIC(corr.)) corresponding to the place and time of the
observa-5
tions. Seawater temperature, salinity and alkalinity are corrected in the same manner. The bias-correctedΩaragwas calculated using these corrected parameters. The
calcu-lated model bias ofΩaragin 1995 is −0.2 (−0.23) in OV (NV) at the surface. There is
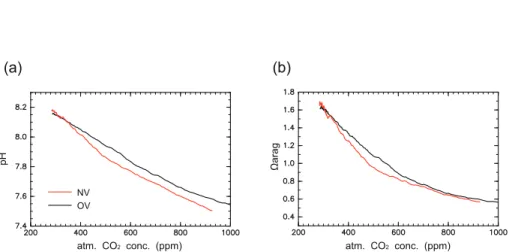
little difference in projected annual mean pH andΩarag averaged in the Arctic surface
water between the two versions below an atmospheric CO2 concentration of 360 ppm 10
(Fig. 4). Values of these two variables for NV are less than those for OV at CO2
con-centrations greater than 360 ppm, beyond which rapid summer sea-ice reduction starts in NV. Annual meanΩaragin OV (NV) becomes less than one at 550 (480) ppm at year
2048 (2040). The maximum differences in pH and Ωarag between the two versions
are 0.08 and 0.15, respectively, at 520 ppm when the difference in seawaterpCO2 for
15
the two versions reaches a maximum. These results indicate that the reductions in pH andΩaragin the Arctic surface waters are significantly accelerated by rapid sea-ice
reduction. Differences in pH and Ωarag between the two model versions decrease at
atmospheric CO2 concentrations greater than 520 ppm due to the decrease in pCO2
difference from 80 µatm to 50 µatm. The difference in pH decreases to 0.05 and re-20
mains above 600 ppm whereas that of Ωarag approaches to 0 despite a difference of
50 µatm inpCO2. We discuss what causes these different responses of pH and Ωarag
in Sect. 4.2.
The areal fraction of undersaturated surface seawater with respect to aragonite in the Arctic Ocean for the two model versions are calculated as an index for indenti-25
fying atmospheric CO2 concentration beyond which acidification may cause serious consequences. This was done to help establish firm criteria for atmospheric CO2
con-centrations that prevent widespread aragonite dissolution (Fig. 5). The bias-corrected
BGD
8, 10617–10644, 2011
Impact of rapid sea-ice reduction on
the rate of ocean acidification
A. Yamamoto et al.
Title Page
Abstract Introduction
Conclusions References
Tables Figures
◭ ◮
◭ ◮
Back Close
Full Screen / Esc
Printer-friendly Version
Interactive Discussion
Discussion
P
a
per
|
Dis
cussion
P
a
per
|
Discussion
P
a
per
|
Discussio
n
P
a
per
|
is projected to become undersaturated with respect to aragonite in at least one month of the years when atmospheric CO2 reaches 406 (394) ppm. At CO2 levels of 438 (425) ppm, 10 % of the surface area in OV (NV) is projected to become undersaturated throughout the year. More than 50 % of the surface area becomes undersaturated at 537 (493) ppm, and the entire surface area becomes undersaturated year around at 5
683 (672) ppm. The extension of underasaturated surface seawater also is influenced by sea-ice reduction rate. Adopting a criterion of year-round undersaturated seawater in 10 % of the surface area in the Arctic Ocean (Steinacher et al., 2009) and the rapid sea-ice reduction as projected by NV, the atmospheric CO2 concentration should not
exceed 425 ppm. 10
4 Discussion
4.1 Which mechanisms reduce pH andΩaragdue to rapid sea-ice reduction?
The factors affecting pH and Ωarag are seawater temperature (T), salinity (S), CO2
uptake by gas exchange with the atmosphere (Gas), freshwater input (Fw), biology (Bio) and transport of carbon by lateral and vertical seawater exchange (Trans). To 15
quantify the effects of these mechanisms on the reductions in pH andΩaragin the top
50 m of the Arctic Ocean due to rapid sea-ice reduction, we divide the changes in pH andΩaraginto components corresponding to the six mechanisms for each model result.
Ωarag(pH) is represented by:
Ωarag=F(T ,S,DIC,Alk), (1)
20
whereF is a function describing the relation between Ωarag and the four factors. Gas
exchange, freshwater input, biology and carbon transport affect pH andΩarag through
BGD
8, 10617–10644, 2011
Impact of rapid sea-ice reduction on
the rate of ocean acidification
A. Yamamoto et al.
Title Page
Abstract Introduction
Conclusions References
Tables Figures
◭ ◮
◭ ◮
Back Close
Full Screen / Esc
Printer-friendly Version
Interactive Discussion
Discussion
P
a
per
|
Dis
cussion
P
a
per
|
Discussion
P
a
per
|
Discussio
n
P
a
per
|
by the following equation:
∆Ωarag=
∂Ωarag
∂T ∆T+
∂Ωarag
∂S ∆S+
∂Ωarag
∂DIC ∆DICgas+
∂Ωarag
∂DIC ∆DICFw+
∂Ωarag
∂Alk ∆AlkFw
+∂Ωarag
∂DIC ∆DICBio+
∂Ωarag
∂Alk ∆AlkBio+
∂Ωarag
∂DIC ∆DICTrans+
∂Ωarag
∂Alk ∆AlkTrans, (2)
where∆DICgas is calculated by integrating annual CO2 flux into the ocean. Similarly,
∆DICFwand∆AlkFware obtained by integrating annual freshwater flux into the ocean,
5
and∆DICBio and ∆AlkBio by integrating the terms relevant to carbon exchange in the
ocean ecosystem model, such as phytoplankton respiration, phytoplankton photosyn-thesis, zooplankton excretion, detritus remineralization, and CaCO3 formation. The
first term on the right side of the equation in certain years is evaluated by the following equation:
10
∂Ωarag
∂T ∆T(yr)
∼
={Ωarag(T(yr),S(yr−1),DIC(yr−1),Alk(yr−1))−Ωarag(T(yr−1),S(yr−1),DIC(yr−1),Alk(yr−1))
+Ωarag(T(yr),S(yr),DIC(yr),Alk(yr))−Ωarag(T(yr−1),S(yr),DIC(yr),Alk(yr))}×
1
2, (3)
where subscript yr denotes the target year. All of the terms except the transport term are evaluated in a similar manner. The transport term is calculated as the residual. pH also is divided into six components in a way similar to Ωarag. The contribution of
15
these components toΩaragand pH for the two model versions is integrated from 1850
to 2045 (CO2≈520 ppm, where the differences in pH andΩaragbetween the two model
versions reach a maximum) to identify the main factors responsible for reducing pH and
Ωaragwith rapid sea-ice reduction (Fig. 6). The terms are calculated for the uppermost
50 m. Gas exchange and transport terms are plotted together as “storage” because 20
they nearly cancel each other.
Ωarag for the Arctic Ocean decreases due to CO2 uptake by gas exchange and
BGD
8, 10617–10644, 2011
Impact of rapid sea-ice reduction on
the rate of ocean acidification
A. Yamamoto et al.
Title Page
Abstract Introduction
Conclusions References
Tables Figures
◭ ◮
◭ ◮
Back Close
Full Screen / Esc
Printer-friendly Version
Interactive Discussion
Discussion
P
a
per
|
Dis
cussion
P
a
per
|
Discussion
P
a
per
|
Discussio
n
P
a
per
|
exchanges. In OV, more than 85 % of the total reduction in Ωarag (−0.55) is due to
the storage effect of anthropogenic carbon (i.e. the sum of gas exchange (−1.12) and transport (0.65)); the freshwater effect (0.09) contributes less than 15 %. The rapid sea-ice reduction serves mainly to enhance effects of gas exchange, freshwater input, and biological activity. In NV, the sum of gas exchange and transport mainly causes 5
a total reduction in Ωarag (≈80 %), and the contribution of freshwater input to the
re-duction ofΩaragis increased to ca. 20 %. Rapid sea-ice reduction decreases the effect
of anthropogenic carbon storage by 0.13 (from−0.55 to−0.68) and that of freshwater input by 0.085 (from−0.09 to−0.175). Therefore, the analysis suggests that rapid sea-ice reduction decreasesΩarag by an increase in both storage of anthropogenic carbon
10
by gas exchange and freshwater input. The decreases in Ωarag through freshwater
input and the storage of anthropogenic carbon in the top 50 m due to rapid sea-ice re-duction are partly (≈30 %) canceled out by the increase in biological productions. For the change in pH, seawater warming reduces pH, and the other five factors affect pH as they doΩarag. The reduction in pH with rapid sea-ice reduction also is caused by
15
increased storage of anthropogenic carbon due to CO2uptake and freshwater input.
4.2 Different responses of pH andΩaragto high atmospheric CO2concentration
As shown in Sect. 3.3, the difference in pH in the Arctic surface waters between the two versions stays approximately 0.05 at CO2 concentrations greater than 600 ppm,
corresponding to the difference in seawater pCO2 of 50 µatm, whereas that in Ωarag
20
almost disappears (Fig. 4). This different behavior is caused by the difference in de-pendence of these two parameters on seawaterpCO2 (Fig. 7). Since pH decreases
almost linearly with increasingpCO2, the difference inpCO2is directly reflected in pH
throughout the simulation. WhileΩarag also decreases with an increase inpCO2, the
dependence ofΩaragonpCO2weakens aspCO2increases. Therefore, the gap in
pre-25
dictedpCO2 due to the difference of sea-ice extent under at CO2level near 600 ppm
affects projections ofΩaragand pH, while differences in the values at CO2levels grater
BGD
8, 10617–10644, 2011
Impact of rapid sea-ice reduction on
the rate of ocean acidification
A. Yamamoto et al.
Title Page
Abstract Introduction
Conclusions References
Tables Figures
◭ ◮
◭ ◮
Back Close
Full Screen / Esc
Printer-friendly Version
Interactive Discussion
Discussion
P
a
per
|
Dis
cussion
P
a
per
|
Discussion
P
a
per
|
Discussio
n
P
a
per
|
rapidly than in OV (Fig. 1). Annual CO2 uptake in NV is, below CO2level of 600 ppm (≈2060 yr), dominated by summer air-sea gas exchange due to rapid summer sea-ice reduction, and at CO2 levels greater than 650 ppm (≈2065 yr), due to winter sea ice
reduction and the low sea surface temperature. In the comparison of the two model versions, the rapid decrease of Ωarag in NV is caused basically by summer sea-ice
5
reduction, while that of pH is caused by summer and winter sea-ice reduction.
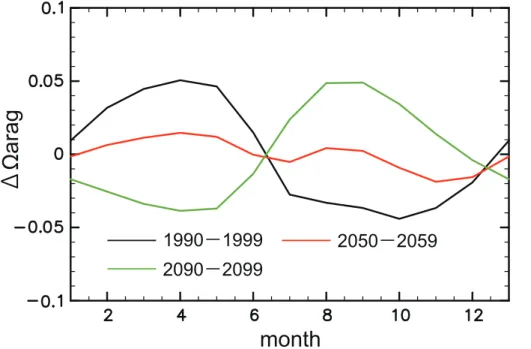
4.3 The relationship between seasonal cycle ofΩarag and sea-ice reduction
The seasonal cycle of surface Ωarag in the Arctic Ocean also is affected by sea-ice
reduction in the models (Fig. 8). In the Arctic surface waters, summer (winter)Ωaragfor
the decade 1990–1999 in the two versions is lowest (highest) all the year round and the 10
amplitude of seasonal variability is less than 0.1, which is consistent with the results reported by Steinacher et al. (2009). This seasonal cycle of Ωarag is driven mainly
by air-sea CO2 exchange and freshwater input. The increases in CO2 uptake and
freshwater input due to summer sea-ice reduction reducedΩarag. The contributions of
seawater temperature and biological processes are minimal. 15
The sea-ice reduction decreases the seasonal amplitude of freshwater input. In contrast, the effects of seawater temperature and biological processes are enhanced during summer sea-ice free condition, which increase Ωarag. Thus, the amplitude of
seasonal variation inΩarag is decreased to 0.04 by the year 2060 (2090) in NV (OV).
Further on, winter sea-ice reduction changes the seasonal cycle of air-sea gas ex-20
change. After the year 2065 in NV, the Arctic surface waters absorb CO2 in winter and release it in summer since CO2is more soluble in cold seawater. Thus, Ωarag is
decreased in winter due to an increase in CO2uptake and seawater cooling, whereas
it is increased in the summer due to CO2 release, seawater warming, and biological processes. The contribution of freshwater input is relatively small. In NV for the decade 25
2090–2099, summer (winter)Ωaragis about 0.05 higher (lower) than the annual mean
value. This change in seasonal cycle ofΩaragis not found in OV in which reduction of
BGD
8, 10617–10644, 2011
Impact of rapid sea-ice reduction on
the rate of ocean acidification
A. Yamamoto et al.
Title Page
Abstract Introduction
Conclusions References
Tables Figures
◭ ◮
◭ ◮
Back Close
Full Screen / Esc
Printer-friendly Version
Interactive Discussion
Discussion
P
a
per
|
Dis
cussion
P
a
per
|
Discussion
P
a
per
|
Discussio
n
P
a
per
|
5 Conclusions
Impacts of sea-ice reduction on the future projection of pH and aragonite saturation values in the Arctic surface waters have been investigated by comparing the rates of ocean acidification calculated from outputs of two versions of an earth system model in which Summer Arctic ice-free condition by 2040 and 2090, respectively, is projected un-5
der similar CO2emission scenarios. Results indicated that the maximum differences in pH andΩaragbetween the two model versions are 0.08 and 0.15, respectively, at
atmo-spheric CO2levels of 520 ppm (year≈2045, a few years after the difference in summer
sea-ice extent reaches a maximum). The critical atmospheric CO2 concentration, at which the Arctic surface waters become undersaturated with respect to aragonite in 10
annual mean, is reduced from 550 to 480 ppm due to rapid sea-ice reduction. In the classification of CO2stabilization scenarios by IPCC AR4, this decrease in critical CO2
concentration corresponds to a shift from category IV to III (IPCC, 2007). The earlier emergence of undersaturated surface water due to rapid sea-ice reduction is a factor to be considered in determining CO2stabilization concentration.
15
The analysis showed that rapid sea-ice reduction decreases pH and aragonite sat-uration state due to increases in both CO2uptake by air-sea gas exchange and
fresh-water input from an increase in sea-ice meltfresh-water. Comparison between the two model versions reveals that CO2uptake and freshwater input contributes at ratio of 3:2 to re-duce aragonite saturation state due to rapid sea-ice reduction, and about 30 % of these 20
contributions are canceled out by an increase in biological processes.
For the CO2 concentration greater than 600 ppm, the difference in pH in the Arctic surface waters between the two model versions is maintained around 0.05, consistent with the difference in seawaterpCO2 of 50 µatm due to differences in sea-ice
reduc-tion, whereas the difference inΩaragvalues almost disappears. Thus, the difference in
25
pCO2is directly reflected in pH throughout the simulation owing to a linear reduction in
pH withpCO2, while the dependence ofΩarag reduction onpCO2 weakens aspCO2
BGD
8, 10617–10644, 2011
Impact of rapid sea-ice reduction on
the rate of ocean acidification
A. Yamamoto et al.
Title Page
Abstract Introduction
Conclusions References
Tables Figures
◭ ◮
◭ ◮
Back Close
Full Screen / Esc
Printer-friendly Version
Interactive Discussion
Discussion
P
a
per
|
Dis
cussion
P
a
per
|
Discussion
P
a
per
|
Discussio
n
P
a
per
|
the seasonal amplitude because seasonal variability in freshwater input decreases, and that in seawater temperature and biological productions increases. Furthermore, the change in the seasonal cycle of CO2 uptake due to winter sea-ice reduction reverses
the seasonal cycle ofΩarag.
Our results indicate that future projections of pH and aragonite saturation state in 5
Arctic surface waters can be influenced significantly by the rapidity of sea ice reduction as well as by increases in atmospheric CO2concentrations. We emphasize that
accu-rate modeling of sea-ice dynamics is crucial for projections related to not only global warming but also ocean acidification for the Arctic Ocean.
Acknowledgements. We thank Michiyo Yamamoto-Kawai and Fiona A. McLaughlin for
provid-10
ing the observation datasets for the Joint Ocean Ice Study (JOIS) 2008. This study was sup-ported by the Innovative Program of Climate Change Projection for the 21st Century, MEXT, Japan. The numerical simulations in this study were performed using the Earth Simulator, and all the figures were produced with the GFD-DENNOU Library.
References 15
Bates, N. R., Mathis, J. T., and Cooper, L. W.: Ocean acidification and biologically induced seasonality of carbonate mineral saturation states in the western Arctic Ocean, J. Geophys. Res., 114, C11007, doi:10.1029/2008JC004862, 2009.
Friedlingstein, P., Cox, P., Betts, R., Bopp, L., Von Bloh, W., Brovkin, V., Cadule, P., Doney, S., Eby, M., Fung, I., Bala, G., John, J., Jones, C., Joos, F., Kato, T., Kawamiya, M., Knorr, W.,
20
Lindsay, K., Matthews, H. D., Raddatz, T., Rayner, P., Reick, C., Roeckner, E., Schnitzler, K. G., Schnur, R., Strassmann, K., Weaver, A. J., Yoshikawa, C., and Zheng, N.: Climate-Carbon Cycle Feedback Analysis: Results from the C4MIP Model Inter-comparison: Evolu-tion of carbon sinks in a changing climate, J. Climate, 19, 3337–3343, 2006.
Gangstø, R., Gehlen, M., Schneider, B., Bopp, L., Aumont, O., and Joos, F.: Modeling the
25
marine aragonite cycle: changes under rising carbon dioxide and its role in shallow water CaCO3dissolution, Biogeosciences, 5, 1057–1072, doi:10.5194/bg-5-1057-2008, 2008. Holland, M. M., Bitz, C. M., and Tremblay, B.: Future abrupt reductions in the summer Arctic
BGD
8, 10617–10644, 2011
Impact of rapid sea-ice reduction on
the rate of ocean acidification
A. Yamamoto et al.
Title Page
Abstract Introduction
Conclusions References
Tables Figures
◭ ◮
◭ ◮
Back Close
Full Screen / Esc
Printer-friendly Version
Interactive Discussion
Discussion
P
a
per
|
Dis
cussion
P
a
per
|
Discussion
P
a
per
|
Discussio
n
P
a
per
|
Hunke, E. and Dukowicz, J. K.: An elastic-viscous-plastic model for sea ice dynamics, J. Phys. Oceanogr., 27, 1849–1867, 1997.
Intergovernmental Panel on Climate Change (IPCC): Climate Change 2007: The Physical Sci-ence Basis, in: Contribution of Working Group I to the Fourth Assessment Report of the Intergovernmental Panel on Climate Change, edited by: Solomon, S., Qin, D., Manning, M.,
5
Chen Z., Marquis, M., Averyt, K. B., Tignor, M., and Miller, H. L., Cambridge Univ. Press, Cambridge, UK, 996 pp., 2007.
Ishimatsu, A., Hayashi, M., Lee K.-S., Kikkawa, T., and Kita. J.: Physiological effects on fishes in a high-CO2 world, J. Geophys. Res., 110, C09S09, doi:10.1029/2004JC002564, 2005. Ito, A. and Oikawa, T.: A simulation model of the carbon cycle in land ecosystems Sim-CYCLE:
10
A description based on dry-matter production theory and plot-scale validation, Ecol. Modell., 151, 147–179, 2002.
K-1 Model Developers: K-1 Coupled GCM (MIROC) description, K-1 Tech. Rep. 1, Cent. for Clim. Syst. Res. (Univ. of Tokyo), Natl. Inst. for Environ. Stud., and Frontier Res. Cent. for Global Change, Yokohama, Japan, available at http://www.ccsr.u-tokyo.ac.jp/kyosei/hasumi/
15
MIROC/tech-repo.pdf, 2004.
Kawamiya, M., Kishi, M. J., and Suginohara, N.: An ecosystem model for the North Pacific embedded in a general circulation model Part II: Mechanisms forming seasonal variations of chlorophyll, J. Marine Systems, 25, 159–178, 2000.
Kawamiya, M., Yoshikawa, C., Kato, T., Sato, H., Sudo, K., Watanabe, S., and Matsuno, T.:
20
Development of an integrated Earth system model on the earth simulator, J. Earth Simulator, 4, 18–30, available at http://www.jamstec.go.jp/esc/publication/journal/jes vol.4/index.html, 2005.
Locarnini, R. A., Mishonov, A. V., Antonov, J. I., Boyer, T. P., and Garcia, H. E.: World Ocean Atlas 2005, vol. 1, Temperature, NOAA Atlas NESDIS 61, edited by: Levitus, S., US Govt.
25
Print. Off., Washington, D.C., 2006.
Marland, G., Boden, T. A., and Andres, R. J.: Global, regional, and national CO2 emissions. Trends: A compendium of data on global change. Carbon Dioxide Inf. Anal. Cent., Oak Ridge Natl. Lab, US Dep. of Energy, Oak Ridge, Tenn., 2005.
McNeil, B. I. and Matear, R. J.: Southern ocean acidification: a tipping point at 450-ppm
atmo-30
spheric CO2, Proceedings of the National Academy of Sciences, 105, 18860–18864, 2008. Millero, F. J.: Thermodynamics of the carbon dioxide system in the oceans, Geochim.
BGD
8, 10617–10644, 2011
Impact of rapid sea-ice reduction on
the rate of ocean acidification
A. Yamamoto et al.
Title Page
Abstract Introduction
Conclusions References
Tables Figures
◭ ◮
◭ ◮
Back Close
Full Screen / Esc
Printer-friendly Version
Interactive Discussion
Discussion
P
a
per
|
Dis
cussion
P
a
per
|
Discussion
P
a
per
|
Discussio
n
P
a
per
|
Mucci, A.: The solubility of calcite and aragonite in seawater at various salinities, temperatures and 1 atmosphere total pressure, Am. J. Sci., 238, 780–799, 1983.
Orr, J. C., Najjar, R., Sabine, C. L., and Joos, F.: Abiotic-HOWTO, internal OCMIP report, 25 pp., LSCE/CEA Saclay, Gif-sur-Yvette, France, 1999.
Orr, J. C., Fabry, V. J., Aumont, O., Bopp, L., Doney, S. C., Feely, R. A., Gnanadesikan, A.,
5
Gruber, N., Ishida, A., Joos, F., Key, R. M., Lindsay, K., Maier-Reimer, E., Matear, R., Mon-fray, P., Mouchet, A., Najjar, R. G., Plattner, G.-K., Rodgers, K. B., Sabine, C. L., Sarmiento, J. L., Schlitzer, R., Slater, R. D., Totterdell, I. J., Weirig, M. F., Yamanaka, Y., and Yool, A.: Anthropogenic ocean acidification over the twenty-first century and its impact on calcifying organisms, Nature, 437, 681–686, 2005.
10
Oschlies, A.: Model-derived estimates of new production: New results point towards lower values, Deep Sea Res. Part II, 48, 2173–2197, 2001.
Oschlies, A. and Garcon, V.: An eddy-permitting coupled physicalbiological model of the North Atlantic 1. Sensitivity to advection numerics and mixed layer physics, Global Biogeochem. Cycles, 13, 135–160, 1999.
15
Royal Society: Ocean acidification due to increasing atmospheric carbon dioxide, The Royal society, London, 223 pp., 2005.
Sabine, C. L., Feely, R. A., Gruber, N., Key, R. M., Lee, K., Bullister, J. L., Wanninkhof, R., Wong, C. S., Wallace, D. W. R., Tilbrook, B., Milllero, F. J., Peng, T.-H., Kozyr, A., Ono, T., and Rios, A. F.: The Oceanic Sink for Anthropogenic CO2, Science, 305, 367–371, 2004.
20
Sato, H., Itoh, A., and Kohyama, T.: SEIB-DGVM: A new dynamic global vegetation model using a spatially explicit individual-based approach, Ecological Modelling, 200, 279–307, doi:10.1016/j.ecolmodel.2006.09.006, 2007.
Seibel, B. A. and Walsh, P. J.: Potential impacts of CO2 injections on deep-sea biota, Science, 294, 319–320, 2001.
25
Semtner Jr., A. J.: A model for the thermodynamic growth of sea ice in numerical investigations of climate, J. Phys. Oceanogr., 6, 379–389, 1976.
Steinacher, M., Joos, F., Frlicher, T. L., Plattner, G.-K., and Doney, S. C.: Imminent ocean acid-ification in the Arctic projected with the NCAR global coupled carbon cycle-climate model, Biogeosciences, 6, 515–533, doi:10.5194/bg-6-515-2009, 2009.
30
BGD
8, 10617–10644, 2011
Impact of rapid sea-ice reduction on
the rate of ocean acidification
A. Yamamoto et al.
Title Page
Abstract Introduction
Conclusions References
Tables Figures
◭ ◮
◭ ◮
Back Close
Full Screen / Esc
Printer-friendly Version
Interactive Discussion
Discussion
P
a
per
|
Dis
cussion
P
a
per
|
Discussion
P
a
per
|
Discussio
n
P
a
per
|
Lett., 36, L07502, doi:10.1029/2009GL037820, 2009.
Watanabe, S., Hajima, T., Sudo, K., Nagashima, T., Takemura, T., Okajima, H., Nozawa, T., Kawase, H., Abe, M., Yokohata, T., Ise, T., Sato, H., Kato, E., Takata, K., Emori, S., and Kawamiya, M.: MIROC-ESM 2010: model description and basic results of CMIP5-20c3m experiments, Geosci. Model Dev., 4, 845–872, doi:10.5194/gmd-4-845-2011, 2011.
5
Yamamoto-Kawai, M., McLaughlin, F. A., Carmack, E. C., Nishino S., and Shimada, K.: Arag-onite Undersaturation in the Arctic Ocean: Effects of ocean acidification and sea ice melt, Science, 326, 1098–1100, doi:10.1126/science.1174190, 2009.
Yoshikawa, C., Kawamiya, M., Kato, T., Yamanaka, Y., and Matsuno, T.: Geographical distribu-tion of the feedback between future climate change and the carbon cycle, J. Geophys. Res.,
10
113, G03002, doi:10.1029/2007JG000570, 2008.
BGD
8, 10617–10644, 2011
Impact of rapid sea-ice reduction on
the rate of ocean acidification
A. Yamamoto et al.
Title Page
Abstract Introduction
Conclusions References
Tables Figures
◭ ◮
◭ ◮
Back Close
Full Screen / Esc
Printer-friendly Version
Interactive Discussion
Discussion
P
a
per
|
Dis
cussion
P
a
per
|
Discussion
P
a
per
|
Discussio
n
P
a
per
|
atm. CO
2
conc. (ppm)
sea ice extent (×10
6 km 2 )
sea ice extent (×10
6 km 2 )
sea ice extent (×10
6 km 2 )
year year
year year
(a)
(b)
(c)
(d)
NV OV
Observation (HadISST)
BGD
8, 10617–10644, 2011
Impact of rapid sea-ice reduction on
the rate of ocean acidification
A. Yamamoto et al.
Title Page
Abstract Introduction
Conclusions References
Tables Figures
◭ ◮
◭ ◮
Back Close
Full Screen / Esc
Printer-friendly Version
Interactive Discussion
Discussion
P
a
per
|
Dis
cussion
P
a
per
|
Discussion
P
a
per
|
Discussio
n
P
a
per
|
year year
year year
year year
atm. CO2 conc. (ppm) atm. CO2 conc. (ppm)
pCO
2
(
μ
atm)
pCO
2
(ocean)/(atm.)
(%)
freshwater flux
(×10
-6 cm/s)
oceanic CO
2
uptake
(×10
-10
kg/s
・
m
2)
alkalinity & DIC
(mmol/l)
salinity
seawater temperature (ºC)
prim. prod.
(×10
-7 mmol/m 3・s)
(a) (b)
(c) (d)
(e) (f)
(g) (h)
NV OV
Alk
DIC
BGD
8, 10617–10644, 2011
Impact of rapid sea-ice reduction on
the rate of ocean acidification
A. Yamamoto et al.
Title Page
Abstract Introduction
Conclusions References
Tables Figures
◭ ◮
◭ ◮
Back Close
Full Screen / Esc
Printer-friendly Version
Interactive Discussion
Discussion
P
a
per
|
Dis
cussion
P
a
per
|
Discussion
P
a
per
|
Discussio
n
P
a
per
|
(b)
(c)
depth (m)
Ωarag
depth (m)
Ωarag
(a)
Fig. 3.Calculated annual mean: (a)seawater temperature;(b)salinity;(c)alkalinity and DIC;
(d)oceanic CO2uptake;(e)freshwater input;(f)primary production;(g)seawaterpCO2; and
BGD
8, 10617–10644, 2011
Impact of rapid sea-ice reduction on
the rate of ocean acidification
A. Yamamoto et al.
Title Page
Abstract Introduction
Conclusions References
Tables Figures
◭ ◮
◭ ◮
Back Close
Full Screen / Esc
Printer-friendly Version
Interactive Discussion
Discussion
P
a
per
|
Dis
cussion
P
a
per
|
Discussion
P
a
per
|
Discussio
n
P
a
per
|
atm. CO2 conc. (ppm)
(a) (b)
atm. CO2 conc. (ppm)
pH Ωarag
NV OV
BGD
8, 10617–10644, 2011
Impact of rapid sea-ice reduction on
the rate of ocean acidification
A. Yamamoto et al.
Title Page
Abstract Introduction
Conclusions References
Tables Figures
◭ ◮
◭ ◮
Back Close
Full Screen / Esc
Printer-friendly Version
Interactive Discussion
Discussion
P
a
per
|
Dis
cussion
P
a
per
|
Discussion
P
a
per
|
Discussio
n
P
a
per
|
atm. CO2 conc. (ppm)
areal fraction at the surface (%)
NV >1month
OV >1month
NV
throughout yearOV
throughout yearBGD
8, 10617–10644, 2011
Impact of rapid sea-ice reduction on
the rate of ocean acidification
A. Yamamoto et al.
Title Page
Abstract Introduction
Conclusions References
Tables Figures
◭ ◮
◭ ◮
Back Close
Full Screen / Esc
Printer-friendly Version
Interactive Discussion
Discussion
P
a
per
|
Dis
cussion
P
a
per
|
Discussion
P
a
per
|
Discussio
n
P
a
per
|
T S
Storage
Fw Bio
T
otal
Δ
Ω
arag
NV
OV
BGD
8, 10617–10644, 2011
Impact of rapid sea-ice reduction on
the rate of ocean acidification
A. Yamamoto et al.
Title Page
Abstract Introduction
Conclusions References
Tables Figures
◭ ◮
◭ ◮
Back Close
Full Screen / Esc
Printer-friendly Version
Interactive Discussion
Discussion
P
a
per
|
Dis
cussion
P
a
per
|
Discussion
P
a
per
|
Discussio
n
P
a
per
|
pCO2 (μ atm)
Ω
arag
(b)
pCO2 (μ atm)
pH
(a)
NV OV
BGD
8, 10617–10644, 2011
Impact of rapid sea-ice reduction on
the rate of ocean acidification
A. Yamamoto et al.
Title Page
Abstract Introduction
Conclusions References
Tables Figures
◭ ◮
◭ ◮
Back Close
Full Screen / Esc
Printer-friendly Version
Interactive Discussion
Discussion
P
a
per
|
Dis
cussion
P
a
per
|
Discussion
P
a
per
|
Discussio
n
P
a
per
|