__________________________________________________________________________________________________________________
Tracer Study of BS in Information Technology (BSIT)
Graduates of Camarines Sur Polytechnic Colleges, Nabua,
Camarines Sur from 2004 to 2010
ARLY B. BALINGBING
Dean, Camarines Sur Polytechnic Colleges, Nabua, Camarines Sur, Philippines [email protected]
Date Received: June 23, 2014; Date Published: August 15, 2014
Abstract – Tracer studies enhance curriculum relevance and marketability of educational programs. Knowledge on employment of CSPC graduates assists in formulating policy towards combating unemployment and producing globally competitive BSIT graduates. This study determines the employability of BSIT graduates of SY 2004-2010 and unveil specifically their personal profile, level of competency alongknowledge, skills and attitudes, significant relationship of the level of competency and the level of difficulties encountered along knowledge, skills, and attitudes and the measures to enhance their competitiveness. The study used descriptive method. Data gathered through a questionnaire from 155 respondents were statistically treated using averaging, percentage, weighted mean and Spearman Rho.
Most respondents were female, 20-25 years old, TESDA-certified, employed in private sectors, incompetent in SY 2003-2004, competent in SY 2005-2010and encountered difficulty along knowledge, skills, and attitudes. There is no significant relationship in the level of competencies among graduates per school year and theirlevel of difficulty along knowledge, skills and attitudes. Some measures to enhance their competitivenessinclude conducting TESDA Assessment and Civil Service examination review and IT Faculty in-house trainings and strengthening English Proficiency Program. BSIT graduates of SY 2004-2010 are competent despite difficulties encountered along skills, attitudes and knowledge.
Key words: Tracer study, BSIT graduates, Ladderized Program, CSPC
I. INTRODUCTION
Tracer studies are means of maintaining curriculum relevance and providing targeted benefits to graduates to enhance marketability of educational programs. Adequate knowledge on employment outcomes of training graduates could assist in formulating policy towards combating some of social problems such as unemployment. Students, particularly graduates of any course, are required to earn a sense of competence in their chosen field and develop confidence to explore new possibilities and new employment specially that there is increasing competition among rivals at work (Mathed, 2008). As graduates of higher educational institutions, they must show the world that job- hunting is not a problem. At present, competition in the business or corporate world is so stiff because of the increasing demand of the market. Only few are employed which proves that these lucky applicants are the best among
others. Relatively, one, particularly a graduate of Information Technology, must possess competency among the three domains like, knowledge, skills and attitudes required by the specific job.
Asia Pacific Journal of Multidisciplinary Research | Vol. 2, No. 4| August 2014
BALINGBING, A.B., Tracer Study of BSIT Graduates of Camarines Sur Polytechnic Colleges
Concorde (2009) made a study on the status and prospect of technical education in La Union province and its implication to manpower development for industrial world. He revealed that the graduates of technical courses in the province found no difficulty in seeking employment. However, they have to go through the process of retraining before they are hired as regular employees in local or national industries. He pointed out that outputs of graduates in technical education particularly in the manufacturing group employment projection or labor market forecast indicate a great demand in the service group.
Camarines Sur Polytechnic Colleges is strong on its aim of producing globally competitive BSIT graduates, hence this study. This study determines the employability of BSIT graduates of SY 2004 to 2010, respectively. Specifically, it sought to unveil the employment data of the respondents as to personal profile, level of competency in terms of knowledge, skills and attitudes, significant relationship of the level of competency and the level of difficulties encountered along knowledge, skills, and attitudes and the measures to enhance the competitiveness of the graduates.
II. OBJECTIVES OF THE STUDY
This study determined the employability of Bachelor of Science in Information Technology graduates from 2004 to 2010. Specifically, this study aimed to determine the profile of the BSIT graduates from 2004 to 2010 in terms of Gender, age and year graduated; government examination taken and nature of employment; and Employment status (government, private and abroad); to determine the level of competency in terms of knowledge, skills and attitudes; to identify the difficulties encountered in the present job in terms of knowledge, skills and attitudes; to test the if there is a significant relationship in the level of competency and the level of difficulties encountered along knowledge, skills and attitudes; and to propose some measures to enhance the competitiveness of the BSIT graduates.
III. CONCEPTUAL FRAMEWORK
The system approach is adopted in this study. Figure one (1) presents the conceptual paradigm of the study. It is consisted of four (4) parts namely: input, process, output and feedback.
Input: The researcher considered the following: profile of Bachelor of Science in Information Technology graduates from SY 2004 to 2010 in terms
of a) gender, civil status, age and year graduated; b) government examination taken; and c) employment status; the level of competency in terms of knowledge, skills and attitudes; and difficulties encountered in the present job in terms of knowledge, skills and attitudes.
Process: The study considered the analysis of the profile of respondents, distribution of questionnaire and unstructured interview of the respondents as the process.
Output: It is focused on the general and specific whereabouts of the BSIT graduates including the proposed suggestions and recommendations to enhance their competitiveness.
Feedback: Feedback occurs when there are revisions or modifications in the system. It may go back to the input stage or to the process stage if there is a problem encountered from the output that needs revisions or changes in the system.
IV. METHODS
In the conduct of this study, the descriptive method of research was considered appropriate. The researcher carried out this research by observing several accepted procedures. First, permission to conduct the research was immediately solicited by the researcher after the presentation and approval of the research proposal by the Research Committee. Second, prepared and validated questionnaires were sent to the graduates through email, snail mail, and other means of delivery. A letter was attached to the questionnaire to inform the respondents about the study and assure them about the confidentiality of the data. Third, the answered questionnaires were retrieved by the researcher. Fourth, numerical analysis in the gathered data was performed. Fifth, consolidations of the significant findings in answer to the questions were considered. Lastly, the proposed measures to enhance the competitiveness of graduates of BSIT Programs were prepared.
The respondent of the study consisted of 223 graduates from Batch 2004 to 2010. However, there were only 155 questionnaires retrieved or 69.5 retrieval rate. All data gathered were presented quantitatively. The statistical tools used were: averaging, percentage technique and weighted mean. Spearman Rho was used to determine the significant relationship between the level of competences and the level of difficulties encountered along knowledge, skills and attitudes.
V. RESULTS AND DISCUSSION
gender, age, year graduated, government examination taken, employment status and type of agency and position in the office and the job relevance. The total graduates of BSIT program from SY 2004 to 2010 were 223 and only 155 questionnaires were retrieved or 69.5 percent retrieval due to some unknown reasons from the graduates.
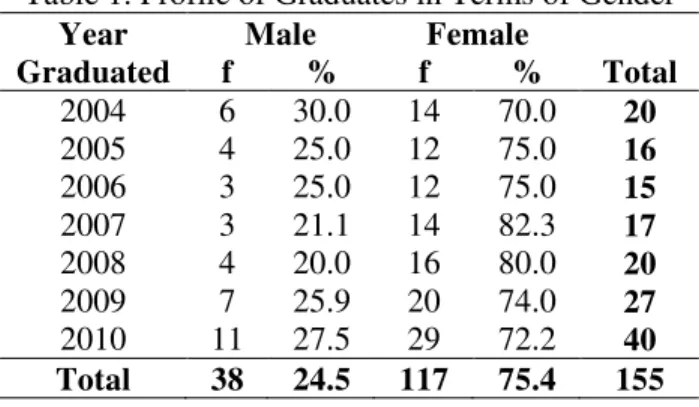
As shown in Table 1, there were 38 or 24.5 percent male while 117 or 75.4 percent female graduates of BSIT program. The graduates were highly dominated by female. Parallel to other careers, female workers are highly seen. Further, IT graduates, like in other schools, are dominated by female as well.
Table 1. Profile of Graduates in Terms of Gender Year
Graduated
Male Female
f % f % Total
2004 6 30.0 14 70.0 20
2005 4 25.0 12 75.0 16
2006 3 25.0 12 75.0 15
2007 3 21.1 14 82.3 17
2008 4 20.0 16 80.0 20
2009 7 25.9 20 74.0 27
2010 11 27.5 29 72.2 40
Total 38 24.5 117 75.4 155
Table 2. Profile of Graduated in Terms of Age
YEAR 2004 2005 2006 2007 2008 2009 2010 Total Per cent
Below 20 years old 3 1 1 2 1 3 2 14 9.0
20 – 25 years old 15 12 13 13 16 20 30 118 76.1
26 – 30 years old 1 3 0 2 3 3 6 18 11.6
31 years old and above 1 0 1 0 0 1 2 5 3.2
Total 20 16 15 17 20 27 40 155 100
As shown in Table 2, majority or 118 or 76.1 percent of the respondents belong to age bracket 20 – 25 years old which is attributed to young adulthood. Generally, the graduates are in their younger age. The
result shows that the graduates find job at their younger adulthood stage which is considered the age of experiment.
Table 3. Profile of the Respondents in Terms of Government Examination Taken Year
Graduated
TESDA Assessment CSC Exam
No. of Takers Passed Failed No. of Takers Passed Failed
2003-2004 8 5 3 No data No data No data
2004-2005 10 5 5 2 1 0
2005-2006 10 8 2 0 0 0
2006-2007 17 15 10 No data No data No data
2007-2008 20 14 6 6 4 2
2008-2009 20 15 5 15 9 5
2009-2010 30 20 10 25 20 5
Total 115 82 41 48 34 12
As shown in Table 3, there are only two kinds of government examination which the graduates took. Based on the data gathered, there were 155 graduates who took the TESDA assessment exam and 48 graduates who took the Career Service Professional and Sub Professional examinations. From the foregoing data, most of the graduates took the TESDA Assessment examination than the CSC examination. The BSIT program is a ladderized course which requires students to take the TESDA assessment before enrolling to the next ladder. Civil Service Examination is not required. However, the College encourages the
students to take the said examination before graduation which may be used for securing an employment in the government.
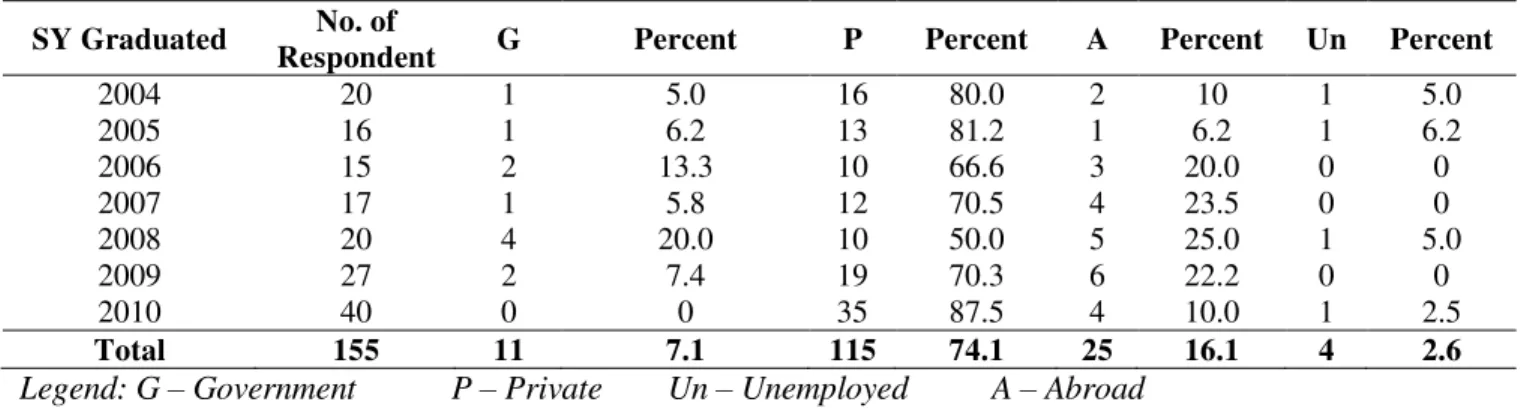
Table 4 shows the status of employment of BSIT graduates. It was noted from the data gathered that for seven years, the total graduates who worked in the government was 11 or 7.1 percent.
Asia Pacific Journal of Multidisciplinary Research | Vol. 2, No. 4| August 2014
BALINGBING, A.B., Tracer Study of BSIT Graduates of Camarines Sur Polytechnic Colleges
Table 4. The Status of Employment of the Graduates
SY Graduated No. of
Respondent G Percent P Percent A Percent Un Percent
2004 20 1 5.0 16 80.0 2 10 1 5.0
2005 16 1 6.2 13 81.2 1 6.2 1 6.2
2006 15 2 13.3 10 66.6 3 20.0 0 0
2007 17 1 5.8 12 70.5 4 23.5 0 0
2008 20 4 20.0 10 50.0 5 25.0 1 5.0
2009 27 2 7.4 19 70.3 6 22.2 0 0
2010 40 0 0 35 87.5 4 10.0 1 2.5
Total 155 11 7.1 115 74.1 25 16.1 4 2.6
Legend: G – Government P – Private Un – Unemployed A – Abroad
Private companies only require TESDA National Certificates (NC) instead of CSC eligibility. Twenty-five (25) or 16.1 percent worked in IT-related jobs abroad while four or 2.60 percent were unemployed.
From the foregoing data, it was noted that majority of the graduates landed jobs in private companies than in government offices.
Table 5. Level of Competencies Along Knowledge, Skills and Attitudes
Year Graduated K VI S VI A VI AWM VI
2004 1.4 IC 1.4 IC 1.4 IC 1.4 IC
2005 1.6 C 1.8 C 1.6 C 1.6 C
2006 1.5 IC 1.9 C 2.1 C 1.8 C
2007 2.1 VC 1.9 C 2.0 C 2.0 C
2008 2.3 C 2.3 C 2.1 C 2.2 C
2009 2.3 C 2.3 C 2.2 C 2.3 C
2010 2.3 C 2.1 C 2.2 C 2.2 C
Legend: K – Knowledge; S – Skills; A – Attitude; VI – Verbal Interpretation; AWM – Average Weighted Mean 1 – Incompetent (IC), 2 – Competent (C), 3 – Very Competent (VC)
Table 5 shows the level of competency (CHED MEMO No. 53, s. 2006, Competency Standards) of the respondent in terms of knowledge, skills and attitudes. It was noted in the presented table that the graduates in Year 2004 in all the three competencies were interpreted as incompetent. However, in the succeeding year until 2010, all results were interpreted as competent. In 2007, Knowledge was rated very competent. The result further showed that all graduates were competent in all three (3) competencies as per
standard required by CHED in BSIT program. Considering the results of the data, this provides a clear picture of the BSIT program. Linkages with other institutions and OJT really help the students to grow professionally and helped them be exposed with the real world specifically in the conduct of their On-the-Job training (Macatangay, 2013).
Table 6 shows the result of the data gathered from the respondents on the difficulties encountered by the respondents along knowledge, skills and attitude.
Table 6. Difficulties Encountered along Knowledge, Skills and Attitudes
School Year Graduated K VI S VI A VI AWM VI
2004 1.9 D 1.9 D 2.1 D 1.9 D
2005 1.7 D 1.6 D 1.6 D 1.6 D
2006 1.9 D 1.7 D 1.6 D 1.7 D
2007 1.7 D 1.7 D 1.6 D 1.7 D
2008 1.8 D 1.9 D 1.6 D 1.7 D
2009 2.0 D 1.5 D 1.5 D 1.7 D
2010 2.2 D 2.1 D 1.5 VD 1.9 D
__________________________________________________________________________________________________________________ It was noted in the presented data that all the three
(3) areas were noted as difficult except for the SY 2010 when Attitude was rated very difficult. It was expected that the BSIT program was considered as one of the difficult courses/ programs because of the various programming subjects forming part of the curriculum. The syntax per programming language differs from
each other and also the evolution of programming is very fast.
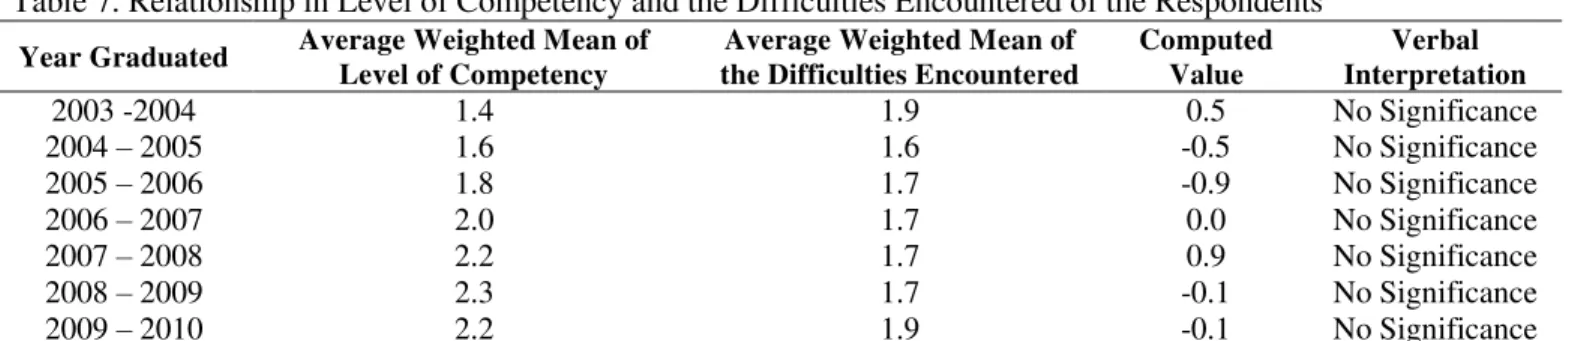
Table 7 reflects the summary of the average weighted mean for the level of competency and the difficulties encountered of the respondents in along knowledge, skills and attitudes.
Table 7. Relationship in Level of Competency and the Difficulties Encountered of the Respondents
Year Graduated Average Weighted Mean of
Level of Competency
Average Weighted Mean of the Difficulties Encountered
Computed Value
Verbal Interpretation
2003 -2004 1.4 1.9 0.5 No Significance
2004 – 2005 1.6 1.6 -0.5 No Significance
2005 – 2006 1.8 1.7 -0.9 No Significance
2006 – 2007 2.0 1.7 0.0 No Significance
2007 – 2008 2.2 1.7 0.9 No Significance
2008 – 2009 2.3 1.7 -0.1 No Significance
2009 – 2010 2.2 1.9 -0.1 No Significance
It was noted that the computed value is less than the tabular value at 0.05 level of significance, thus the null hypothesis is accepted in favor of the research hypothesis. This means that there is no significant relationship in the level of competencies and encountered difficulty in every school year along knowledge, skills and attitudes.
Proposed Measures
The proposed measures or activities to enhance the competencies in all areas of graduates of the BSIT Program are presented below and these were gathered from the list of suggested activities given by the graduates:
Conduct review for the TESDA Assessment Exam and
for the Civil Service Examinations.
Enhance further the English Proficiency Program
sponsored by the Provincial Government of Camarines Sur.
Conduct in- house trainings during summer for both the
faculty members and the students on Software Applications, Desktop Publishing, Programming, Web Page Development and other needed training for both faculty members and students.
Require faculty members to attend or participate in
trainings, seminars, congress, retooling and other related activities for the ICT program for enhancement of their knowledge, skills and attitudes.
Conduct series of study tours to ICT spots in Metro Manila and CALABARZON areas for exposure purposes.
Adopt the English Policy of the College.
Enhance the curriculum of the program by adding more
subjects that require realistic deliverables.
Limit the class size to at least 30 students during laboratory period.
Employ qualified and competent ICT faculty members
to enhance the quality of instructions.
CONCLUSIONS AND RECOMMENDATIONS The BSIT program is one among the difficult programs/courses offered in the College because programming syntaxes are different in each programming language and the evolution of programming language is very fast. Though BSIT graduates encountered difficulties along knowledge, skills and attitudes, they were still employed because of the need of IT workers in the market. The proposed measures to enhance the BSIT program are deemed necessary for the enhancement of the graduates of the program.
The proposed measures to enhance the BSIT programs must be adopted and evaluated periodically. Students and faculty development program should be developed and implemented so that knowledge, skills and attitudes of faculty and students are enhanced. Future study must follow-up this proposed measures to enhance the competency level of graduates.
REFERENCES
Concorde, NJ T. (2009). Technical education graduates in La Union: Its implication to industrial manpower development. Unpublished Master Thesis. PNU, Manila.
Macatangay, L. (2013). Tracer Study of BSCS Graduates of Lyceum of The Philippines University from 2004-2009. Academic Research International, 4(5)
Matthed, J. Professional graduates.www.yahoo.com.sg/ status of graduates/ 2009/report/1.23.2008.