Employability of the Bachelor of Science in
Electronics Engineering Graduates of
Camarines Sur Polytechnic Colleges
Rizza T. Loquias (PECE, MET)
Camarines Sur Polytechnic Colleges, Nabua, Camarines Sur, Philippines [email protected]
Date Received: August 27, 2015; Date Revised: October 2, 2015
Asia Pacific Journal of Multidisciplinary Research Vol. 3 No. 4, 33-40 November 2015 Part II P-ISSN 2350-7756 E-ISSN 2350-8442
www.apjmr.com
Abstract –The study determined the employment status of the graduates of BS Electronics Engineering from 1999 to 2011. It also addressed the relevance of the ECE program outcomes and school factors to their employability. Pertinent data were gathered using a questionnaire and the sample size of 180 was determined using Slovin’s formula. Findings revealed that the graduates are highly employable in a wide range of industry such as electronics manufacturing, electronics design, telecommunications, broadcasting, and data communications and ICT-related areas, were able to pass the licensure examinations and other certifications, currently enjoying regular permanent job positions as supervisors, production engineers, process engineers, educators and others, and are working for companies located in Metro Manila and industrial zones in Laguna and Cavite. A significant number work abroad as OFWs. Only a small number are employed in the province of Camarines Sur mainly due to the lack of electronics industries and employment opportunities in the area. The skills the graduates found most useful to their first jobs are critical thinking, problem solving, and communication skills. Suggestions were given such as the inclusion of industry-utilized software and enhancement of the OJT program, more hands-on activities in the curriculum, exposure to industry while studying, and job familiarization among others. The findings of the study can serve as basis for curriculum review and revision to meet the demands of the industry.
Keywords – electronics engineering graduates, employability, tracer study.
INTRODUCTION
The stability and growth of a country's economy hinges on its ability to produce goods and services for both domestic and international use. Labor represents an important factor of production, hence, the improvement of the quality of the labor force and efforts to make it more productive and responsive to growth are necessary for the development of the economy [1]. From the employment data of the National Statistics Office now under the Philippine Statistics Authority and the graduates’ data from the Commission on Higher Education, it was reported that in 2010 there was an 82% employment rate for the new graduates and 18 % unemployment rate or percentage of College graduates who were unemployed. The data for year 2012 showed a significant increase with the employment rate rose up to 93% with the corresponding 7% unemployment rate [2]. This trend goes to show that more employment opportunities are being created and the quality of the labor force is improving.
one supplier of knowledge-based jobs and workers worldwide with an immediately available labor force of 32 million and over 100,000 engineering, IT, and technical graduates every year. As of 2010, the electronics industry has generated half a million direct employment. The Philippine electronics industry remains to be the major contributor to the economy, accounting for 61.18% of total exports for 2010 [4]. However, the increasing number of graduates and the conscientious and meticulous employers pose challenges to the graduates of ECE in addition to other problems they may encounter in looking for employment.
The mission of Camarines Sur Polytechnic Colleges is to provide the students quality polytechnic education with an equal growth and opportunity like what the other universities and colleges can offer to their students and the appropriate application of knowledge and skills that will be well-suited to the graduates’ future employment. CSPC has been offering civil, electrical and mechanical engineering courses since its first year of operation in 1985 and had started offering Electronics and Communications Engineering (ECE) in 1992. Today, the college has already produced around three hundred seventy BSECE graduates.
By virtue of RA 9292, otherwise known as the Electronics Engineering Act of 2004, the name Electronics and Communications Engineering was changed to Electronics Engineering. Curriculum revision and enhancement was done several times to cope up with the changes and meet the requirements of the program standards to adapt with the abrupt changes of the socio-economic environment that is brought about by the higher standards of competition, privatization, and globalization. With the growing number of graduates of Electronics Engineering, there is now a need to evaluate how the CSPC is able to respond to the needs and demands of the job industry. Graduate surveys constitute one form of empirical study which can provide valuable information for evaluating the results of the education and training of a specific institution of higher education. This information may be used for further development of the institution in the context of quality assurance [5]. Tracer studies could then be used as a means of maintaining curriculum relevance and providing targeted benefits to graduates to enhance marketability of engineering programs. Adequate knowledge on employment outcomes of engineering graduates could
assist in formulating policy towards combating some of social problems such as unemployment and underemployment.
Moreover, Millington [6] states that tracer studies provide quantitative-structural data on employment and career, the character of work and related competencies and information on the professional orientation and experiences of their graduates. The use of a graduate tracer study is advocated as an appropriate tool in determining institutional capability in preparing graduates to meet the demands of the work place. The graduate tracer studies involves the determination of graduates in the job search mode, lead time and employment condition, where the knowledge acquired in schools are used to work, in promotions, and job satisfaction [7].
The main purpose of this paper was for the researchers to investigate the employment status of the graduates and determine what percentage of the graduates had acquired first job after they graduated [8]. To provide facts and information intended to make CSPC know the employability rate of its Electronics Engineering graduates, this study traced the whereabouts of the graduates and knows details about their past and present employment status. The findings of this study may help the College in its future curriculum making/re-evaluation to upgrade the skills needed by its students in consonance with the requirements of the industry and to produce graduates that possess competitive skills and qualities.
OBJECTIVES OF THE STUDY
The study aimed to determine the personal and employment profile of the graduates of Electronics Engineering for the academic years 1997 to 2011; to determine the competencies developed for the students and which the graduates found useful in their employment and to identify factors that affect employability of the graduates.
MATERIALS AND METHODS
Research Design
Education (CHED). Other data on the graduates came from the existing records of the College of Engineering.
Respondents
The population of this study included graduates of the Bachelor of Science in Electronics Engineering program from 1997 to 2011 with a total of 376. Sample size was determined using Slovin’s formula. The computed sample size is 176, but the actual number of respondents is 180, exceeding the target by 2%. Shown in Table 1 is the distribution of the 176 respondents by year of graduation. The frequency was obtained by dividing the number of graduates of a particular year by the total number of graduates.
Table 1.Frequency and Percentage Distribution of Respondents by Year of Graduation
Year No. of
Graduates Frequency
Percentage (%)
1997 2 1 0.53
1998 3 1 0.80
1999 12 6 3.19
2000 9 4 2.39
2001 13 6 3.46
2002 28 13 7.45
2003 25 12 6.65
2004 24 11 6.38
2005 42 20 11.17
2006 52 24 13.83
2007 28 13 7.45
2008 28 13 7.45
2009 37 17 9.84
2010 30 14 7.98
2011 43 20 11.44
TOTAL 376 176 100
Data Gathering Instrument
The questionnaire was developed based on the objectives of the study. It was based on questionnaires developed by the CHED, and questionnaires administered by other schools. It was intentionally modified and composed of several parts that helped the researcher in gathered the necessary data needed for the study, particularly on the personal profile and data on the present and previous employment of the respondents.
Data Gathering Procedure
In-person distribution, e-mail questionnaires, Facebook messaging and telephone interview were used by the researchers to collect data. Majority of the respondents replied via e-mail. It was the most
convenient and fastest way of sending notes, letters and messages through Internet [9]. Through in-person distribution the researcher scheduled specific time to locate the respondents in their residences based on the address available from the office of the Registrar and those graduates who visited the school during the period of the research were given the questionnaires. E-mail questionnaire and Facebook messaging were conducted over the Internet for those respondents who are not available to answer the questionnaires in person.
The telephone interviews were conducted over the landline phone and via cellular network services. The researchers administered this to the respondents who were not able to answer through e-mail and in-person distribution and as follow-up verifications of some answers.
Statistical Treatment
The statistical treatment of data used in this study is through percentile and frequency method and weighted mean. Descriptive analysis, using graphs and tables was also employed.
RESULTS AND DISCUSSION
Personal Profile of the Respondents
As to post-graduate studies, only about four percent of the total respondents obtained Master’s degree. Seven (7) are graduates in Master in Engineering Technology (MET), all of them took up the MET Program of the Camarines Sur Polytechnic Colleges and one (1) pursued and graduated in Doctor of Philosophy in Development Education (Ph.D. Dev. Ed.) from the CSSAC now known as the Central Bicol State University of Agriculture (CBSUA). Very few of the respondents are presently enrolled in a Master’s degree program while some are taking up short-term specialization courses. The other respondents expressed desire to pursue Master’s degree in the future.
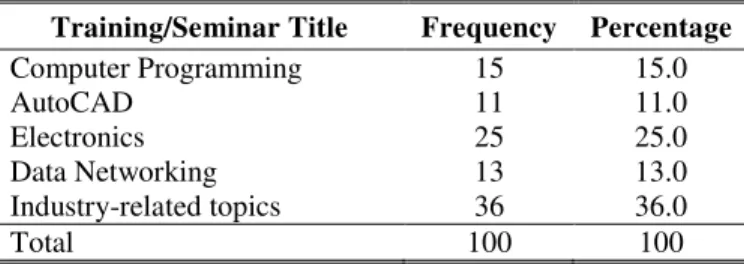
After graduation from College and within their employments, the respondents attended trainings and seminars to target specialized skills and knowledge and enhance the tools of the trade in their chosen industry. Table 2 lists the training attended by the ECE graduates after graduation in College.
Table 2. Training attended after College
Training/Seminar Title Frequency Percentage Computer Programming 15 15.0
AutoCAD 11 11.0
Electronics 25 25.0
Data Networking 13 13.0
Industry-related topics 36 36.0
Total 100 100
There are one hundred (100) respondents who answered this question, thirty-six percent (36%) of which attended seminars and trainings provided by their employers. Twenty-five percent (25%) attended additional trainings in electronics to further improve their trade and fifteen percent (15%) attended computer programming and industry-specific software trainings, thirteen percent (13%) attended data networking courses (CCNA) and eleven percent (11%) attended AutoCAD training. These trainings except those sponsored by the employers were undertaken by the respondents and personally shouldered the expenses because the respondents believed that these trainings were needed by the graduates to become more competitive in the job market.
Employment Analysis
The study revealed that the employment rate is 91.67% or 162 of the 180 respondents are employed
and 3 are self-employed. The unemployment rate is 8.33% where 15 respondents are not employed during the time of the study.
Of the unemployed respondents, fifty-five percent (55%) said it is their personal decision not to work, nine percent (9%) said they cannot find job because of tight competition with other jobseekers, nine percent (9%) blamed it on their incompetence to the job requirements, nine percent (9%) said there is no available jobs near their place of residence and another nine percent (9%) intentionally did not look for a job because they are on further study and skills enhancements. According to some of the unemployed respondents, some companies where they did try applying in were having high expectations and qualifications they could not meet. Those unemployed female respondents have chosen to become plain housewives.
Sixty-two percent (62%) of the respondents are employed in private companies located within the Philippines particularly in Industrial Parks in Laguna, Cavite and Batangas while twenty-four percent (24%) are employed in multi-national private companies located abroad. Eleven percent (11%) works in the government service, two percent (2%) are self-employed and one percent (1%) working in a semi-private, semi-government establishment.
The study also revealed that fifty percent (50%) of the respondents are employed on permanent status while twenty-six (26%) are on contractual basis and seventeen percent (17%) on temporary status. The remaining seven percent (7%) is accounted for those who are working on probationary status, those whose work duration is project-based, those hired on job order, and those having open contract with their employers.
The salary of the employed respondents varied depending on their job position and company. Thirty-five percent (35%) of the respondents are earning above Php30,000.00 per month. They are those employed in managerial positions and those who are working as OFWs. Majority of those working locally earn a monthly salary in the range of Php15,000.00 to Php20,000.00. A significant three percent (3%) receives a monthly salary below Php10,000.00 which is considered too low for a job in engineering.
(19%) enjoy sufficient employee benefits; and thirteen percent (13%) considered the high salary offered to them.
Table 3. Reasons for Staying on the First Job Reason for Staying on the
Job Frequency Percentage
high salary 21 12.7
sufficient employee benefits 31 18.8 friendly work environment 35 21.2 proximity to place of residence 16 9.7
job satisfaction 57 34.5
others (Flexible working
hours) 5 3.0
165 100
On the other hand, ten percent (10%) said they have stayed in their first job because of its proximity to residence; and three percent (3%) because of flexible working hours.
When asked for the reasons why they looked for other jobs, twenty-two percent (22%) said insufficient employee benefits had provoked them to go for another job; thirty-four percent (34%) mentioned they want a new career challenge; thirty-one percent (31%) said because of low salary; five percent (5%) said proximity to residence; four percent (4%) said because of hostile work environment and another four percent (4%) stated other reasons in changing their first job such as retrenchment and company closure and time-off to prepare for the board exam.
Fig.1. Distribution of the Respondents according to Nature of Work Industry
On the nature of the company/organization where the graduates/respondents are employed, twenty-eight percent (28%) are in electronics manufacturing (semiconductors/electronics/electrical); fifteen percent
(15%) in telecommunications which includes cellular phone service providing companies; twelve percent (12%) in Sales and Marketing of electronic supplies and services; nine percent (9%) in computer and data networking; eight percent (8%) are in engaged in electronics design; six percent (6%) in educational services; four percent (4%) in broadcast industry; and eighteen percent (18%) in other areas as shown in figure 1.
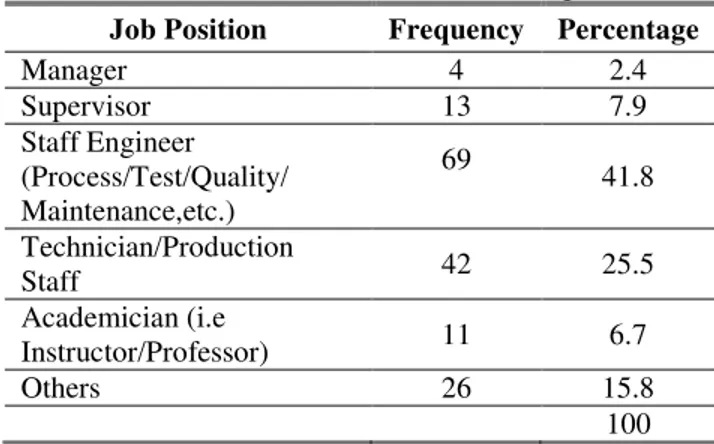
Forty-two percent (42%) of the respondents are employed as staff engineers namely Process, Test, Maintenance, and Quality engineers in electronics manufacturing companies.
Table 4. Job Position Levels of the Respondents Job Position Frequency Percentage
Manager 4 2.4
Supervisor 13 7.9
Staff Engineer (Process/Test/Quality/ Maintenance,etc.)
69
41.8
Technician/Production
Staff 42 25.5
Academician (i.e
Instructor/Professor) 11 6.7
Others 26 15.8
100 Twenty-five percent (25%) are working as technicians and production workers; eight percent (8%) are in supervisorial positions; seven percent (7%) are academicians serving as instructors and teachers; two percent (2%) are in managerial positions; the remaining eighteen percent (18%) are comprised of other job positions listed in Table 4.
Table 5. Job Locations of the Respondents
Job Location Frequency Percentage Within the Province of
Camarines Sur 16 9.7
Metro Manila-Based
Offices/Establishments 43 26.1
Other Provinces 58 35.2
Other Countries 48 29.1
TOTAL 165 100
The graduates are employed by various industries in different locations inside and outside the country. Thirty-six percent (36%) are working within the Philippines with the majority in Laguna and Cavite where majority of the electronics manufacturing Electronics
Manufacturing 28%
Electronics Design
8% Telecommunicati
on 15% Computer/Data
Networking 9% Sales and
Marketing 12% Education
6% Broadcasting &
Acoustics 4%
companies are located; twenty-nine percent (29%) are working abroad with the majority employed in UAE, Saudi Arabia and Singapore; twenty-six percent (26%) are deployed in Metro-Manila establishments and companies; and a small percentage of nine percent (9%) are working within the Province of Camarines Sur. This is shown in Table 5.
When the respondents were asked how they were able to find their first jobs, forty-five percent (45%) said they found it by walk-in application, twenty-four percent (24%) said they found job online or via the internet advertisements, and sixteen percent (16%) found their jobs through manpower agencies. Thirteen percent (13%) said they found jobs by family or friend referrals. A very small portion, specifically one percent (1%) was able to find their first jobs through job fairs and OJT absorption when the company where the respondent had his OJT offered a sure job after graduation.
On the question of waiting time before getting employed, twenty-four percent (24%) said it took them seven (7) months to one (1) year; twenty percent (20%) said it took them one (1) to three (3) months; twenty percent (20%) said it took them three (3) to six (6) months, twenty-one percent (21%) said the waiting time was less than month, while twelve percent (12%) of them took 1 to 2 years before they were employed on their first job. About three percent (3%) of the respondents waited three (3) to four (4) years before
finding their first jobs. After graduation, the graduate usually spends the next six months preparing for the board exam. Actual job-hunting happens after they took the board exam, so it explains why majority of the respondents answered the seven months to one year waiting time before getting employed.
When asked what difficulties they encountered in looking for a job, majority of the respondents or thirty-eight percent (38%) said they lacked work experience thus does not qualify for target jobs; twenty-two percent (22%) expressed that there is very limited job opportunities in the area; fourteen percent (14%) said that competition with graduates of other school made their job-hunting difficult since some companies prefer graduates of Metro-Manila schools; ten percent (10%) said employers are not interested in the level of qualification; eight percent (8%) said that employers are not interested in the area of specialization; other reasons that account for the remaining eight percent (8%) are: financial difficulties during job-hunting, employers discrimination on schools; limited knowledge and skills thus results to very low self-esteem.
Employability Attributes
There are factors that may affect and influence the employability of the graduates. Listed in Table 6 are identified factors classified into two categories, namely: Graduate factors and School factors.
Table 6. Factors Affecting Employability of Graduates
1. GRADUATE FACTORS Weighted Mean Descriptive Rating
A. Knowledge
a.1 Over-all academic knowledge 4.14 Greatly Affected
a.2 Trained in electronics theories and applications 4.12 Greatly Affected a.3 Trained in circuits design and implementations 3.98 Greatly Affected a.4 Trained in electronic systems and technologies 4.10 Greatly Affected B. Skills Possessed
b.1 Computer and programming skills (C, C++, Visual Basic, AutoCAD, and other software)
4.06 Greatly Affected
b.2 Written communications 4.04 Greatly Affected
b.3 Oral communications skills 4.27 Greatly Affected
b.4 Electronics repair and troubleshootings 3.75 Moderately Affected 2. SCHOOL FACTORS
A. Curriculum 4.05 Greatly Affected
B. Placement Program 3.48 Moderately Affected
C. Physical and laboratory facilities 3.91 Greatly Affected
D. On the-Job-Trainings 3.71 Moderately Affected
E. Industry Linkages 3.89 Moderately Affected
Graduate factors consist of knowledge and skills possessed by the respondents while school factors comprised of: curriculum, placement program, physical and laboratory facilities, OJT program, industry linkages and skills enhancement programs. The respondents were asked to rate each factor as to the degree of how it affected their employability. From the data gathered, it was reflected that the over-all academic preparation of the graduates with a weighted mean of 4.14 and skills enhancement with a weighted mean of 4.18 are what affected their entry-level employability the most. It simply means that when a graduate is academically prepared, all that is pertaining to knowledge will follow such as the knowledge in electronic design and applications. However, for first time job applicants, the quality of training they had in school is short of what the industry requires thus they supplement their learning by attending additional trainings after they graduated in College. Oral communications skills were also registered as having the most impact in finding employment.
In the follow-up interview conducted by the researcher to some of the respondents, graduates of ECE perceived the relevance of their course to be the key factor in getting a job. Intellectual skills were also a contributing factor as well as academic performance and character/ personality. The employed graduates also cited adaptability/flexibility, intellectual skills, teamwork, interpersonal skills and communication skills as competencies they had learned in college which have been useful for their first job.
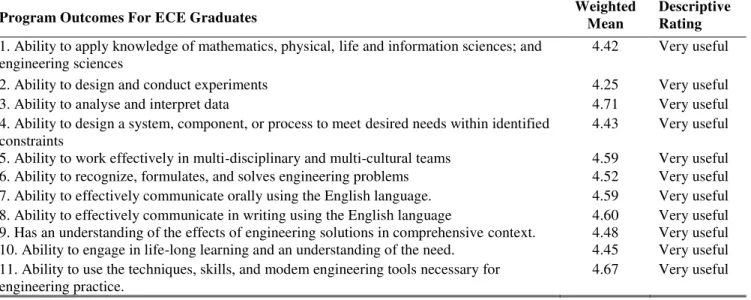
In applying for a job, certain competencies must be possessed by graduates to become viable and competitive with other applicants. The researcher asked the respondents to rate each item as to the degree of usefulness in job applications. The program outcomes for Electronics Engineering listed in Table 7 were taken from the Program Standards for Electronics Engineering per CHED CMO No. 24 series of 2008 [10].
Based on the responses, the ability to analyse and interpret data ranks first as the most in demand competency of an ECE graduate especially in the field of electronics manufacturing. This was followed by the ability to use the techniques, skills, and modem engineering tools necessary for engineering practice and the ability to communicate orally and in writing using the English language. This was understandable since employment applications and interviews and the business itself are usually done using the English language.
Summary of the respondents’ recommendations to enhance employability of graduates includes: incorporate and integrate in the electronics engineering curriculum the current requirements of the industry such as specialization trainings and software; strengthen the OJT program and industry immersions; establish industry linkages and partnership with other schools, companies and alumni; improve and continuously upgrade the laboratory facilities considering the industry settings – to facilitate the smooth transition from classroom to workplace.
Table 7. Program Outcomes for Electronics Engineering Graduates
Program Outcomes For ECE Graduates Weighted Mean Descriptive Rating
1. Ability to apply knowledge of mathematics, physical, life and information sciences; and engineering sciences
4.42 Very useful
2. Ability to design and conduct experiments 4.25 Very useful
3. Ability to analyse and interpret data 4.71 Very useful
4. Ability to design a system, component, or process to meet desired needs within identified constraints
4.43 Very useful
5. Ability to work effectively in multi-disciplinary and multi-cultural teams 4.59 Very useful 6. Ability to recognize, formulates, and solves engineering problems 4.52 Very useful 7. Ability to effectively communicate orally using the English language. 4.59 Very useful 8. Ability to effectively communicate in writing using the English language 4.60 Very useful 9. Has an understanding of the effects of engineering solutions in comprehensive context. 4.48 Very useful 10. Ability to engage in life-long learning and an understanding of the need. 4.45 Very useful 11. Ability to use the techniques, skills, and modem engineering tools necessary for
engineering practice.
CONCLUSION AND RECOMMENDATION
From the findings of the study, the graduates of Electronics Engineering of CSPC have a high employability rate and that the over-all academic preparation and skills enhancements are what affected their entry-level employability the most. For first time job applicants, the quality of training they had in school was short of what the industry required thus they supplemented their learning by attending additional trainings after they graduated in College. Communication skills were also registered as having the most impact in securing employment.
From the results of this study and with the timely implementation of educational reforms, the Camarines Sur Polytechnic Colleges was prompted to conduct periodic review of the curriculum together with industry representatives to make the course offerings more responsive to the needs of the industry. More programs involving apprenticeship, entrepreneurship training, and on the-job-training will be institutionalized in the academic program. These should help ease out the transition from school to workplace. The conduct of tracer studies regularly to analyse the employment/unemployment rate of graduates not only of Electronics Engineering but of all its program offerings and provide up-to-date information that will assist policy makers to address graduate unemployment. It is also highly recommended to include all graduates as well as employers as respondents.
REFERENCES
[1] National Statistics Office Labor Force Survey, URL: http://goo.gl/vhzNJV, 23 September, 2013
[2] Labor and Employment. National Statistics Coordination Board. Retrieved September 23, 2013 URL: http://goo.gl/cun5fG
[3] Orence, A. & Laguador, J. M. (2013). Employability of Maritime Graduates of Lyceum of the Philippines University from 2007 – 2011, International Journal of Research in Social Sciences, 3(3), 142-157
[4] Philippine Electronics Industry Profile as of 23 February 2011 prepared by Other Industries Division- Special Programs Department, URL: http://goo.gl/bMZntf, Date Accessed: 27 September 2015
[5] Schomburg, H. (2003). Handbook for Graduate Tracer Studies. Center for Research on Higher Education and Work. Germany: University of Kassel. http://www.qtapi.de/handbook_v2.pdf
[6] Millington, C. (2001). The use of tracer study for enhancing relevance and marketability in online and distance education. Retrieved October 2, 2013, /URL: http://goo.gl/GzSnU3
[7] de Guzman, A. B., & de Castro, B. V. (2008). Employment and employability profile of a select group of Filipino college graduates. KEDI Journal of Educational Policy, 5(1), 63-81.
[8] Laguador, J. M. & Dotong, C. I., (2013). Tracer Study of BS Computer Engineering Graduates of Lyceum of the Philippines University, International Journal of Management, IT and Engineering, 3(8), 387-401
[9] Ramirez, T. L., Cruz, L. T., & Alcantara, N. V. (2014). Tracer Study of RTU Graduates: An Analysis” Researchers World Journal of Arts, Science and Commerce, 5(1), 66-76
[10] CHED CMO No. 24 series of 2008, Policies and Standards (PS) for the Degree of Bachelor of Science in Electronics Engineering (BSECE).
Copyrights