www.arch-anim-breed.net/59/477/2016/ doi:10.5194/aab-59-477-2016
© Author(s) 2016. CC Attribution 3.0 License. Archives Animal Breeding
Genetic diversity and distance of Iranian goat breeds
(Markhoz, Mahabadi and Lori) compared to the Beetal
breed using inter-simple sequence repeat (ISSR) markers
Leila Simaei-Soltani1, Alireza Abdolmohammadi1, Alireza Zebarjadi2, and Saheb Foroutanifar1
1Department of Animal Science, Campus of Agriculture and Natural Resources,
Razi University, Kermanshah, Iran
2Department of Agronomy and Plant Breeding, Campus of Agriculture and Natural Resources,
Razi University, Kermanshah, Iran
Correspondence to:Alireza Abdolmohammadi ([email protected])
Received: 20 August 2016 – Revised: 4 November 2016 – Accepted: 10 November 2016 – Published: 8 December 2016
Abstract. The aim of this study was to investigate the genetic diversity and structure in three Iranian native goat breeds (Markhoz, Mahabadi and Lori) and the Beetal imported breed using inter-simple sequence repeat (ISSR) markers and also to investigate ISSR markers’ potential in order to genetically separate single (S) and twin-birth (T) subpopulations. Blood samples were collected from 210 animals for this purpose. In total, 16 primers were used, and finally 5 primers were selected based on the number of clear bands and the level of polymorphisms. The result of this study showed that 76 of 86 observed fragments were polymorphic. Genetic diversity for each breed ranged from 0.23 in the Beetal breed to 0.26 in the Markhoz breed; this represents a relatively similar genetic diversity in these breeds. An unweighted pair group method with arithmetic mean (UPGMA) dendro-gram based on the Nei’s standard genetic distance between the breeds studied showed that three Iranian goat breeds (Mahabadi, Lori and Markhoz) were clustered closer together, while the Beetal breed formed a separate cluster. In the constructed dendrogram of the subpopulations, the S and T subpopulations of each breed were clustered together. The constructed dendrogram of the Beetal breed and the S and T subpopulations of all breeds studied showed a separate cluster for the Beetal breed as an imported breed and another cluster for the S and T subpopulations as Iranian native breeds. The current study showed that the ISSR markers studied had no poten-tial to genetically separate S and T subpopulations. On the other hand, these ISSR markers can be used for the clustering of distinct populations.
1 Introduction
Goats are probably one of the earliest ruminants domesti-cated around 10 000 years ago (Zeder and Hesse, 2000). To-day, goats are raised all over the world due to their toler-ance to various environments, adaptability to nutrient-poor diets and manageable size. Goats are multipurpose animals that produce milk, meat and wool and contribute to the econ-omy of farmers living in arid and semiarid regions, including south of Iran (Vahidi et al., 2014). The Iranian goat tion is 21 million, which is 2.57 % of the world’s goat popula-tion (861.90 million) and 4.08 % of the Asian goat populapopula-tion (514.4 million).
Genetic diversity is an essential component for popula-tion survival, evolupopula-tion, genetic improvement and adaptapopula-tion to changing environmental conditions (Kumar et al., 2009). The conservation of genetic variability has arisen in the last years because the existence of a large gene pool is important for the potential future breeding preservation and for sustain-able animal production system development. Comprehensive knowledge of the existing genetic variability is the first step for the conservation and exploitation of domestic animal bio-diversity.
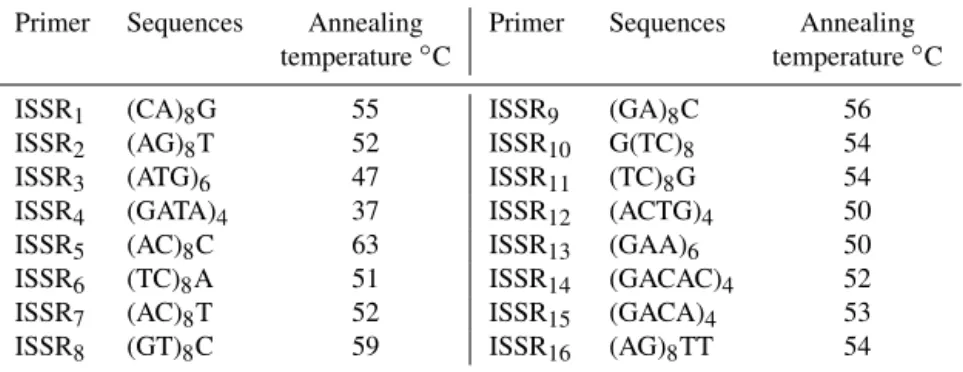
Table 1.List of primers used for ISSR amplification and their annealing temperature.
Primer Sequences Annealing Primer Sequences Annealing
temperature◦C temperature◦C
ISSR1 (CA)8G 55 ISSR9 (GA)8C 56
ISSR2 (AG)8T 52 ISSR10 G(TC)8 54
ISSR3 (ATG)6 47 ISSR11 (TC)8G 54
ISSR4 (GATA)4 37 ISSR12 (ACTG)4 50
ISSR5 (AC)8C 63 ISSR13 (GAA)6 50
ISSR6 (TC)8A 51 ISSR14 (GACAC)4 52
ISSR7 (AC)8T 52 ISSR15 (GACA)4 53
ISSR8 (GT)8C 59 ISSR16 (AG)8TT 54
range of molecular genetic studies such as establishing pop-ulation structure, poppop-ulation differentiation and the recon-struction of phylogenetic relationships between populations, especially in plants (Wang et al., 2008). The ISSR markers are created using a single primer complementary to the mi-crosatellite repeat (from 4 to 12 repeat units) and carrying the 3’ sequence consisting of one or two arbitrary nucleotides (the so-called “anchor”). Such primers enable the amplifi-cation of the DNA fragments which are situated between two rather closely located inverted microsatellite sequences (Sulimova, 2004). The ISSR marker has a mild technical dif-ficulty, good reproducibility and a reasonable cost, permit-ting its use for genetic studies of populations (Chen et al., 2005; Fagen and Nianhe, 2005)
The aim of this study was to investigate the genetic di-versity and structure in three Iranian native goat breeds (Markhoz, Mahabadi and Lori) and the Beetal imported breed using ISSR markers and also to investigate ISSR mark-ers’ potential to separate single (S) and twin-birth (T) sub-populations genetically.
2 Material and methods
2.1 Animals
All protocols used in this study were approved by the Ani-mal Care and Use Committee of Razi University. Blood sam-ples were collected from a total of 210 individuals belonging to three Iranian native goat breeds and the Beetal imported breed: 60 Markhoz does (30 with an LS (litter size) of 1 and 30 with an LS of 2) from Sanandaj, 60 Mahabadi does (30 with an LS of 1 and 30 with an LS of 2) from Mah¯ab¯ad, 60 Lori does (30 with an LS of 1 and 30 with an LS of 2) from Lorest¯an and 30 Beetal does (LS>2) as a control group from
S¯ıst¯an va Bal¯uchest¯an province.
2.2 DNA extraction and polymerase chain reaction (PCR)
DNA was extracted from whole blood using a DIAtom DNA Prep 100 kit (GenFanavaran Co, Iran). First, 16 ISSR primers
were used, but 5 primers were selected due to the number of clear bands and polymorphic properties. Annealing tem-perature and sequences for all primers are listed in Table 1. Polymerase chain reaction was performed in a 15 µL final volume containing 1 unit Taq DNA polymerase, 1.5 µL of 10×PCR buffer, 0.2 mM dNTPs, 0.25 µM of primer, 25 mM of MgCl2and 50–100 ng of genomic DNA. PCR was carried out in an initial denaturation at 94◦C for 3 min, followed by 35 cycles of 30 s for denaturation at 94◦C, 45 s for anneal-ing at the temperature optimized for each primer (Table 1) and 90 s for extension at 72◦C, and a final extension step at 72◦C for 7 min. Then, 12 µL of PCR products with 2 µL of tracking dye was electrophoresed on a 1.2 % non-denatured agarose gel and visualized over UV light after ethidium bro-mide staining to detect the amplification.
2.3 Statistical analysis
The measurement of diversity including gene diversity (H), observed number of alleles (Na), effective number of alle-les (Ne) and Shannon’s information index was done by the POPGEN 1.31 software (Yeh et al., 1999). The software was also employed to determine Nei’s unbiased genetic dis-tances (Nei, 1978). A dendrogram based on Nei’s unbiased genetic distances, using the unweighted pair group method with arithmetic mean (UPGMA), was generated to show the genetic distances of the populations or subpopulations inves-tigated in this study.
3 Results
3.1 Validation and polymorphism of ISSR primers
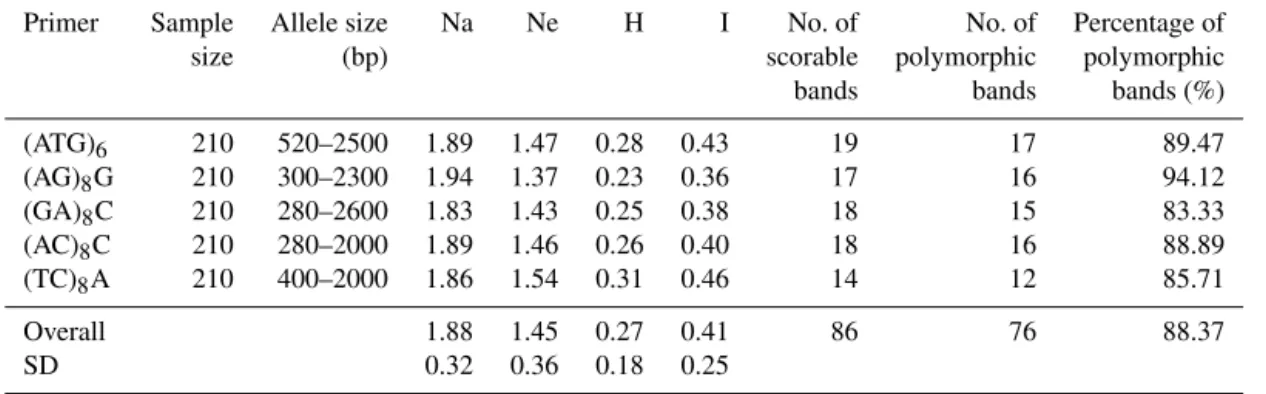
Table 2.Various measures of genetic variation at different loci across studied goat breeds.
Primer Sample Allele size Na Ne H I No. of No. of Percentage of
size (bp) scorable polymorphic polymorphic
bands bands bands (%)
(ATG)6 210 520–2500 1.89 1.47 0.28 0.43 19 17 89.47
(AG)8G 210 300–2300 1.94 1.37 0.23 0.36 17 16 94.12
(GA)8C 210 280–2600 1.83 1.43 0.25 0.38 18 15 83.33
(AC)8C 210 280–2000 1.89 1.46 0.26 0.40 18 16 88.89
(TC)8A 210 400–2000 1.86 1.54 0.31 0.46 14 12 85.71
Overall 1.88 1.45 0.27 0.41 86 76 88.37
SD 0.32 0.36 0.18 0.25
Na: observed number of alleles; Ne: effective number of alleles; H: Nei’s genetic diversity; I: Shannon’s information index.
Table 3.Various measures of genetic variability among different goat breeds.
Sample
Population size Na Ne H I
Mahabadi 60 1.77±0.43 1.41±0.36 0.24±0.19 0.37±0.26 Lori 60 1.78±0.42 1.40±0.36 0.24±0.19 0.36±0.26 Markhoz 60 1.80±0.40 1.46±0.38 0.26±0.19 0.39±0.27 Beetal 30 1.71±0.46 1.40±0.38 0.23±0.20 0.35±0.28
Overall 210 1.88±0.32 1.45±0.36 0.27±0.18 0.41±0.25
Na: observed number of alleles; Ne: effective number of alleles; H: Nei’s genetic diversity; I: Shannon’s information index.
76 fragments (88.37 %) were polymorphic (Table 2). The av-erage observed number of alleles per locus ranged from 1.83 ((GA)8C) to 1.94 ((AG)8G), with a mean value of 1.88. Rel-evant information per locus, such as the range of allele sizes, effective number of alleles (Ne), Nei’s genetic diversity (H), Shannon’s information index (I), number of scorable bands, number of polymorphic bands and percentage of polymor-phic bands (%), are presented in Table 2.
3.2 Genetic heterozygosity criteria in Iranian goat breeds
The genetic characterization of the studied goat breads is shown in Table 3. Among the breeds, the mean number of alleles ranged from 1.71 in Beetal to 1.80 in the Markhoz breed. Nei’s gene diversity and Shannon’s information in-dex were relatively similar in the breeds studied (Table 3). It seemed that the breeds studied have relatively similar genetic diversity. Among the breeds, total heterozygosity (Ht), the average heterozygosity within populations (Hs) and diversity between the four populations (Dst) were 0.26, 0.25 and 0.01, respectively. The average genetic differentiation coefficient (Gst) value (Weir and Cockerham, 1984), another measure of genetic differentiation, over all loci was 0.056 indicating that 5.6 % of total genetic variation corresponded to differ-ences between populations, whereas 94.4 % was explained by differences between individuals.
Table 4.Nei’s (1978) genetic identity (I, above diagonal) and ge-netic distance (D, below diagonal) among the four goat breeds.
Breeds Mahabadi Lori Beetal Markhoz
Mahabadi – 0.9868 0.9740 0.9789
Lori 0.0133 – 0.9746 0.9764
Beetal 0.0264 0.0258 – 0.9771
Markhoz 0.0213 0.0238 0.0231 –
3.3 Genetic distance of the goat populations studied
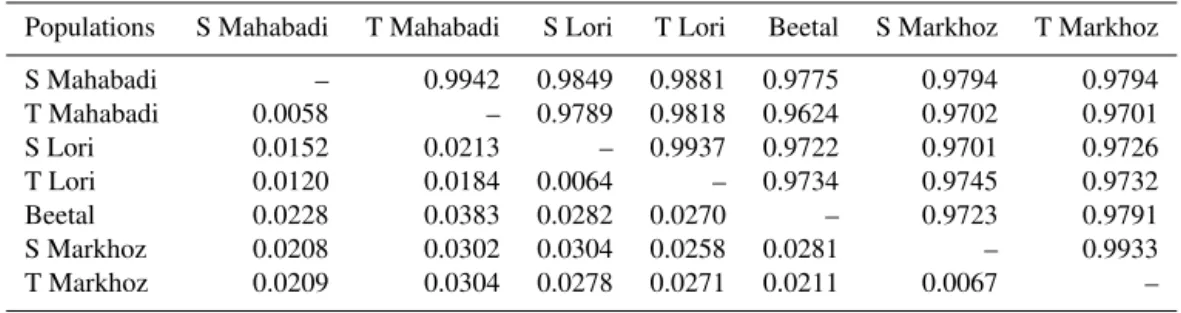
Table 5.Nei’s (1978) genetic identity (I, above diagonal) and genetic distance (D, below diagonal) between single (S) and twin-birth (T) subpopulations of goat breeds.
Populations S Mahabadi T Mahabadi S Lori T Lori Beetal S Markhoz T Markhoz
S Mahabadi – 0.9942 0.9849 0.9881 0.9775 0.9794 0.9794
T Mahabadi 0.0058 – 0.9789 0.9818 0.9624 0.9702 0.9701
S Lori 0.0152 0.0213 – 0.9937 0.9722 0.9701 0.9726
T Lori 0.0120 0.0184 0.0064 – 0.9734 0.9745 0.9732
Beetal 0.0228 0.0383 0.0282 0.0270 – 0.9723 0.9791
S Markhoz 0.0208 0.0302 0.0304 0.0258 0.0281 – 0.9933
T Markhoz 0.0209 0.0304 0.0278 0.0271 0.0211 0.0067 –
Figure 1.The phylogenetic dendrogram showing the genetic rela-tionships between goat populations using the Nei (1978) standard genetic distance obtained from five ISSR markers.
Figure 2.The phylogenetic dendrogram showing the genetic rela-tionships between the single (S) and twin-birth (T) subpopulations of the goat breeds studied using the Nei (1978) standard genetic distance obtained from five ISSR markers.
3.4 Genetic distance of single (S) and twin-birth (T) subpopulations
The phylogenetic dendrogram of the S and T subpopulations of the breeds studied based on Nei’s genetic distance analysis (Fig. 2) placed the S and T subpopulations of each breed in one cluster, and, overall, they were divided into two groups: one includes S Mahabadi and T Mahabadi in one branch with S Lori and T Lori subpopulations. Another consists of Beetal and then the S Markhoz and T Markhoz subpopulations.
Nei’s (1978) genetic identity and genetic distance between the Beetal breed and the S and T populations of the other breeds studied are shown in Table 6. According to this, the
Table 6.Nei’s (1978) genetic identity (I, above diagonal) and ge-netic distance (D, below diagonal) between the Beetal breed and the single (S) and twin-birth (T) subpopulations of the other breeds studied.
Populations S populations T populations Beetal
S populations – 0.9988 0.9809
T population 0.0016 – 0.9817
Beetal 0.0193 0.0184 –
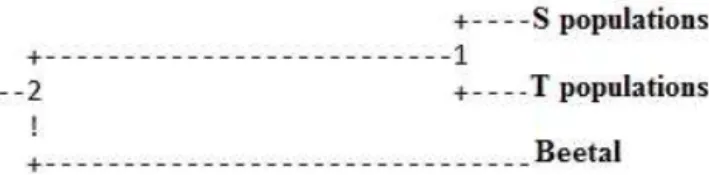
S and T populations are closer together and have a greater distance to the Beetal breed. The phylogenetic relationship between the Beetal breed and the S and T populations of the other breeds studied was constructed on the basis of Nei’s standard distance matrix (Nei, 1978) (Fig. 3). As seen in Fig. 3, the S and T populations were grouped in one clus-ter and the Beetal breed in another one.
4 Discussion
Genetic variation is a basic requirement for animal breed-ing, whereas high genetic variation is needed for the genetic improvement of domestic animals (Askari et al., 2011). The analysis of genetic diversity is a method to estimate the varia-tion present in populavaria-tions (Weir, 1990). Therefore, we used ISSR markers to assess genetic variation based on the mean allelic frequency of the 86 ISSR fragments obtained in the breeds studied. The total number of alleles per locus in the present study ranged from 14 to 19. The higher number of alleles for each locus showed that all the markers used were appropriate to analyze diversity in the breeds studied.
Figure 3. The phylogenetic dendrogram showing the genetic re-lationships between the Beetal breed and the S and T populations of the other breeds studied using the Nei (1978) standard genetic distance obtained from five ISSR markers.
populations (Mirhoseini and Badrbarin, 2013). The genetic diversity in this study was higher than that of some Iranian breeds (Askari et al., 2011; Zamani et al., 2011), and Na-jdi, Harri and Aradi Saudi goat breeds (Sabir et al., 2013); however, the diversity was noticeably lower than that of Ko-rean and Chinese goats (Kim et al., 2002), twelve Chinese indigenous goat populations (Li et al., 2002), southern Italian goat populations (Iamartino et al., 2005), Egyptian and Ital-ian goat breeds (Agha et al., 2008), and IndItal-ian goat breeds (Dixit et al., 2012) and was also slightly lower in comparison to the color types of the Markhoz goat populations (Moradii et al., 2014). Zamani et al. (2011), Askari et al. (2011) and Moradii et al. (2014) used two ISSR markers for their stud-ies; the sequence of ISSR markers in their studies was also different from those in the present study. Sabir et al. (2013) used 30 goats in their study, which is much lower than the sample size in our study (210 goats); also, the sequence of some ISSR markers in their study was different from those in the present study. On the other hand, Kim et al. (2002), Li et al. (2002), Imartino et al. (2005), Agha et al. (2008) and Dixit et al. (2012) used microsatellite markers in their stud-ies. Thus, the differences in genetic diversity values obtained could be due to the type of markers used, the sequence of ISSR markers, sampling and sample size.
The Shannon information index was 0.41, indicating that 41 % of effective alleles (a mean of 1.44 alleles per lo-cus) were on average identified per primer. Our estimate of the Shannon information index was in accordance with what is reported by Moradii et al. (2014) on the color types of Markhoz goat populations and by Mirhoseini and Bad-barin (2013) on six Iranian indigenous goat populations. This estimated index was higher than that for Mehraban sheep (Zamani et al., 2011), Rayini goats (Askari et al., 2011), and Najdi, Harri and Aradi Saudi goat breeds (Sabir et al., 2013). However, the Shannon information index in this study was lower than that of Kermani sheep (Esfandyarpour et al., 2008).
An overall mean of Gst=5.6 % (based on five markers) indicated that within-breed diversity accounts for a large part of the total genetic diversity of the breeds investigated. This value was similar to those found in the Najdi, Harri and Aradi Saudi goat breeds (5.9 %) (Sabir et al., 2013), domes-ticCapra hircusbreeds reared within an early goat
domes-tication area in Iran (5.9 %) (Vahidi et al., 2014), and Euro-pean and Middle Eastern goats (6.9 %) (Canon et al., 2006) but lower than the values reported for Italian goat popula-tions (7.3 %) (Iamartino et al., 2005), six Iranian indigenous goat populations (8 %) (Mirhoseini and Badbarin, 2013), the color types of Markhoz goat populations (9 %) (Moradii et al., 2014), south-east Asian goats (14 %) (Barker et al., 2001) and Indian goat breeds (16.2 %) (Dixit et al., 2012)
The phylogenetic dendrogram of the breeds (Fig. 1) showed that the Mahabadi and Lori breeds were grouped to-gether, with the Markhoz breed deviating from them. This type of clustering was completely consistent with the fact that Markhoz is a Mohair-producing breed but Mahabadi and Lori are known as meat and milk-producing breeds. Further-more, the Beetal breed formed a separate cluster from Iranian goats. It is noteworthy that this breed has been recently im-ported from Pakistan into S¯ıst¯an va Bal¯uchest¯an province in Iran. Therefore, this observed difference can be due to geo-graphical distance, which is exacerbated by the official bor-ders between the two countries. Similar population clustering according to geographic location was previously observed in 12 Chinese indigenous goat breeds (Li et al., 2008, 2002), Egyptian and Italian goat breeds (Agha et al., 2008), Indian goat breeds (Dixit et al., 2012), and 6 Iranian indigenous goat populations (Mirhoseini and Badbarin, 2013).
In the dendrogram constructed of the subpopulations of the breeds studied (Fig. 2), the S and T subpopulations per breed were grouped in the same cluster. In fact, the ISSR markers used in this study showed a low potential for separating the S and T subpopulations as different clusters. The ISSR markers amplify intergenic and non-coding regions of the genome, and these regions may not have any effect on the number of kids (twining trait). It seems that a study on major genes known for the twining trait can distinguish S subpopulations from T subpopulations. For example, Rasouli et al. (2016) reported that the twinning rate in Markhoz goats was sig-nificantly influenced by the IGF-I and IGFBP-3 genotypes; also, the association of two single nucleotide polymorphisms (SNPs) in the growth hormone (GH) gene with the litter size and superovulation response in goat breeds has been studied, and the results have shown that the two loci of the GH gene are highly associated with abundant prolificacy and a super-ovulation response in goat breeds (Zhang et al., 2011).
The phylogenetic tree constructed between the Beetal breed and the S and T subpopulations for all the breeds stud-ied (Fig. 3) showed a separate cluster for the Beetal breed as an imported breed and another cluster for the S and T subpopulations as Iranian native breeds. This finding con-firmed that geographic distance and different agroclimatic conditions and probably breeding objectives have an impor-tant effect on genetic diversity.
black types in another one. However, the current study is the first report using ISSR marker analysis to investigate the pos-sibility of different clustering for the twining trait in several goat populations (Agha et al., 2008; Dixit et al., 2012; Ja-vanrouh Aliabad et al., 2004; Li et al., 2008; Mirhoseini and Badbarin, 2013).
However, the low number of ISSR markers (five markers) and the sample size (30 goats per subpopulation) in the cur-rent study may be other reasons for the low potential of the ISSR markers studied to show S and T subpopulations in dif-ferent clusters. It seems that this would be clearer using many more ISSR markers in larger goat populations.
In conclusion, this study has shown the moderate genetic diversity in some native goat breeds. This research has also shown that the ISSR markers studied had no potential to ge-netically separate S and T subpopulations, while ISSR mark-ers can be used to cluster distinct populations.
5 Data availability
The original data of the paper will be available upon request to the corresponding author.
Author contributions. A. Abdolmohammadi and S. Foroutanifar designed this project, L. Simaei Soltani carried it out and wrote the paper, and A. Zebarjadi helped us in the molecular analysis of ISSR markers.
Competing interests. The authors declare that they have no con-flict of interest.
Acknowledgements. We would like to thank to H. M. Moradi Shahr Babak and M. Khaldari for help in collecting blood samples and also Razi University for financially supporting this project.
Edited by: S. Maak
Reviewed by: T. Gruszecki and two anonymous referees
References
Agha, S., Pilla, F., Galal, S., Shaat, I., D’andrea, M., Reale, S., Ab-delsalam, A., and Li, M.: Genetic diversity in Egyptian and Ital-ian goat breeds measured with microsatellite polymorphism, J. Anim. Breed. Genet., 125, 194–200, 2008.
Ajmone-Marsan, P., Negrini, R., Crepaldi, P., Milanesi, E., Gorni, C., Valentini, A., and Cicogna, M.: Assessing genetic diversity in Italian goat populations using AFLP®markers, Anim. Genet., 32, 281–288, 2001.
Askari, N., Abadi, M. M., and Baghizadeh, A.: ISSR markers for as-sessing DNA polymorphism and genetic characterization of cat-tle, goat and sheep populations, Iran. J. Biotechnol., 9, 222–229, 2011.
Barker, J. S. F., Tan, S. G., Moore, S. S., Mukherjee, T. K., Math-eson, J., and Selvaraj, O.: Genetic variation within and relation-ships among populations of Asian goats (Capra hircus), J. Anim. Breed. Genet., 118, 213–234, 2001.
Canon, J., Garcia, D., García-Atance, M., Obexer-Ruff, G., Lenstra, J., Ajmone-Marsan, P., and Dunner, S.: Geographical partitioning of goat diversity in Europe and the Middle East, Anim. Genet., 37, 327–334, 2006.
Chen, J., Liu, X., Gituru, W., Wang, J., and Wang, Q.: Genetic vari-ation within the endangered quillwort Isotoma petraea (Lobeli-aceae), Mol. Ecol., 8, 775–789, 2005.
Dixit, S., Verma, N., Aggarwal, R., Vyas, M., Rana, J., and Sharma, A.: Genetic diversity and relationship among Indian goat breeds based on microsatellite markers, Small. Rum. Res., 105, 38–45, 2012.
Esfandyarpour, E., Askari, N., Mohammad-Abadi, M., Nowshari, A., Asadi-Moghadam, R., Asadi-Fori, M., Esmaeilizade, A., and Baghizade, A.: Use of inter-simple sequence repeat (ISSR) mark-ers to evaluate genetic divmark-ersity of Kermani sheep, 3rd Congress on Animal Science, University of Ferdowsi, Iran, 22 September, 2008.
Fagen, L. and Nianhe, X.: Population structure and genetic diversity of an endangered species, Glyptostrobus pensilis (Cupressaceae), Bot. Bull. Acad. Sinica, 46, 155–162, 2005.
Iamartino, D., Bruzzone, A., Lanza, A., Blasi, M., and Pilla, F.: Ge-netic diversity of Southern Italian goat populations assessed by microsatellite markers, Small. Rum. Res., 57, 249–255, 2005. Javanrouh Aliabad, A., Esmaeelkhanian, S., Dinparast, N., and Vaez
Torshizi, R.: Genetic variation among six Iranian goat breeds us-ing RAPD markers, Pajuhesh Sazandegi, 12–17, 2004.
Kim, K., Yeo, J., Lee, J., Kim, J., and Choi, C.: Genetic diversity of goats from Korea and China using microsatellite analysis, Asian. Australas, J. Anim. Sci., 15, 461–465, 2002.
Kumar, S., Dixit, S., Verma, N., Singh, D., Pande, A., Chander, R., and Singh, L.: Genetic diversity analysis of the Gohilwari breed of Indian goat (Capra hircus) using microsatellite markers, Am. J. Anim. Vet. Sci., 4, 49–57, 2009.
Li, J., Chen, H., Lan, X., Kong, X., and Min, L.: Genetic diversity of five Chinese goat breeds assessed by microsatellite markers, Czech J. Anim. Sci., 53, 315–319, 2008.
Li, M.-H., Zhao, S.-H., Bian, C., Wang, H.-S., Wei, H., Liu, B., Yu, M., Fan, B., Chen, S.-L., and Zhu, M.-J.: Genetic relation-ships among twelve Chinese indigenous goat populations based on microsatellite analysis, Genet. Sel. Evol., 34, 729–744, 2002. Mirhoseini, S. Z. and Badbarin, N.: Assessing genetic diversity in six Iranian indigenous goat populations using AFLP markers, J. Food Agric. Environ., 11, 495–497, 2013.
Moradii, M.-H., Rostamzadeh, J., Rashidi, A., Vahabi, K., and Farahmand, H.: Analysis of genetic diversity in Iranian mohair goat and its color types using Inter Simple Sequence Repeat (ISSR) markers, Agric. Commun., 2, 55–62, 2014.
Nei, M.: Estimation of average heterozygosity and genetic dis-tance from a small number of individuals, Genetics, 89, 583–590, 1978.
Rasouli, S., Abdolmohammadi, A. R., Zebarjadi, A. R., and Mostafaei, A.: Evaluation of polymorphism in IGF-I and IGFBP-3 genes and their relationship with twining rate and growth traits in Markhoz goats, Ann. Anim. Sci., doi:10.1515/aoas-2016-0020, online first, 2016.
Sabir, J. S., Sabry, A. M., Awad, N. S., Mohamed, A. A., and Mu-tawakil, M. H.: Najdi, Harri and Aradi Saudi goat breeds possess genetic variation required for genetic improvement, World Appl. Sci. J., 26, 867–872, 2013.
Sulimova, G.: DNA Markers in Genetic Studies: Types of Mark-ers, Their Properties and the Range of Application, Usp. Sovrem. Biol., 124, 260–271, 2004.
Vahidi, S. M. F., Tarang, A. R., Naqvi, A. U. N., Falahati Anbaran, M., Boettcher, P., Joost, S., Colli, L., Garcia, J. F., and Ajmone-Marsan, P.: Investigation of the genetic diversity of domestic Capra hircus breeds reared within an early goat domestication area in Iran, Genet. Sel. Evol., 46, 1–12, doi:10.1186/1297-9686-46-27, 2014.
Wang, X., Zhao, F., Hu, Z., Critchley, A. T., Morrell, S. L., and Duan, D.: Inter-simple sequence repeat (ISSR) analysis of ge-netic variation of Chondrus crispus populations from North At-lantic, Aquat. Bot., 88, 154–159, 2008.
Weir, B. S.: Genetic data analysis, Methods for discrete population genetic data, Sinauer Associates, Inc. Publishers, 376 pp., 1990. Weir, B. S. and Cockerham, C. C.: Estimating F-statistics for the analysis of population structure, Evolution, 38, 1358–1370, 1984.
Yeh, F., Yang, R., and Boyle, T.: Microsoft Windows-based free-ware for population genetic analysis, Release 1.31, University of Alberta, Edmonton, 1999.
Zamani, P., Akhondi, M., Mohammadabadi, M. R., Saki, A. A., Ershadi, A., Banabazi, M. H., and Abdolmohammadi, A. R.: Genetic variation of Mehraban sheep using two intersimple se-quence repeat (ISSR) markers, Afr. J. Biotechnol., 10, 1812– 1817, 2011.
Zeder, M. A. and Hesse, B.: The initial domestication of goats (Capra hircus) in the Zagros Mountains 10,000 years ago, Sci-ence, 287, 2254–2257, 2000.