Vol.54, n. 5: pp. 859-866, September-October 2011
ISSN 1516-8913 Printed in Brazil BRAZILIAN ARCHIVES OF
BIOLOGY AND TECHNOLOGY
A N I N T E R N A T I O N A L J O U R N A L
Efficiency of RAPD and ISSR markers in Assessing Genetic
Variation
in
Arthrocnemum
macrostachyum
(Chenopodiaceae)
Basel Saleh
*Department of Molecular Biology and Biotechnology, AECS, P.O. Box 6091, Damascus - Syria.
ABSTRACT
The goal of this study was to investigate the molecular characterization of A. macrostachyum genotypes grown in the Western coast of Syria using RAPD and ISSR techniques. PCR amplifications with 20 RAPD primers gave an average of 9.25 selected markers/ primer, with a maximum of 17 (OPG05) and a minimum of four (OPA02). Percentage of polymorphic bands ranged from 40 to 100% according to RAPD primers tested. Among the 185 selected bands, 160 (84.96%) were polymorphic. The amplification with seven ISSR primers generated 88 bands, and 80 (90.91%) were polymorphic. (CA)8RG and (AG)8GTG ISSR primers tested in this study yielded highly informative patterns. RAPD and ISSR fragment sizes ranged from 0.2–3 kb. Based on this study, the use of RAPD and ISSR fingerprints could be a powerful tool to assess the genetic diversity in A. macrostachyum. Both the techniques gave similar results regarding the degree of relatedness among the genotypes tested, with genotype 2 being suggested to represent a distinct subspecies from that of genotypes 1 and 3.
Key words:A. macrostachyum, genetic diversity, genotype, ISSR, polymorphism, RAPD
*Author for correspondence: [email protected] in
INTRODUCTION
The Salicornioideae (14–16 genera, c. 90 species) is a remarkable subfamily of Chenopodiaceaethat is notable for its hygrohalophytic ecology associated with particular anatomical, morphological, and physiological adaptations (Kadereit et al., 2006). Thesubfamily Salicornioideae Kostel. (Chenopodiaceae Juss. APG, 2003), more commonly known as samphires its distinctive reduced succulent leaves, which may be modified to form an articulated, photosynthetic stem (de Fraine, 1912). Recent molecular phylogenetic studies have shown that the sister group relationship of the Salicornioideae is equivocal. Bienertia cycloptera Bunge (subfamily
Suaedoideae Ulbr.) was placed as a sister species to the monophyletic Salicornioideae based on both nrDNA Internal Transcribed Spacer (ITS) sequence data (Schütze et al., 2003) and cpDNA
rbcL sequences (Kadereit et al., 2003). However, Bienertia cycloptera was placed as sister to Suaeda
Forsk. ex. Scop. in the same study by Schütze et al. (2003) based on the analysis of cpDNA atpB-rbcL cpDNA sequence data. The lack of a clear
A close alliance between the Chenopodiaceae and Amaranthaceae has long been recognized because of a number of synapomorphic characters, including similar floral characteristics, embryogeny, phytochemistry, sieve-element plastids, and pollen morphology (Townsend, 1993; Judd and Ferguson, 1999). Molecular phylogenetic analyses confirm this close relationship (Soltis et al., 2000; Kadereit et al., 2003). Currently, the Chenopodiaceae has been placed into synonymy under Amaranthaceae by some authors (APG, 1998; 2003), although the exact phylogenetic relationships of this alliance still remain unclear.
Arthrocnemum macrostachyum (Moric.) Moris.,
occurs in almost pure stands in the coastal region and it is a typical species in the salt marshes of the Mediterranean region (Vicente et al., 2007). In the coastal and inland salt steppes of SE Spain, it occasionally occurs with other species such as
Halimione portulacoides (L) Aellen, Suaeda
Forsskal ex JF Gmelin, Suaeda pruinosa Lange, Limonium spp. Mill, Inula chritmoides L(Pujolet
al., 2000). Wilson (1980) proposed that the genus
Arthrocnemum was a possible intermediate
between Sarcocornia and the Australian endemic
genera based on morphological characters shared with both the groups. The monophyly of the Australian endemic genera supports their separation from Arthrocnemum (Wilson, 1980;
1984). However, the phylogenetic position of A. macrostachyum is not fully resolved.
Random Amplified Polymorphic DNA (RAPD) markers (Williams et al., 1990; Singh et al., 2006) and ISSR markers (Okun et al., 2008) are two molecular typing approaches that have been used to detect the variation among the plants. Each method has been used extensively to identify and determine the relationships at the species and cultivar levels (Raina et al., 2001; Martins et al., 2003). ISSR analysis has been used for the cultivar identification in numerous plant species, including rice (Joshi et al., 2000), apple (Goulão and Oliveira, 2001) and strawberry (Arnau et al., 2003). ISSR-PCR gives multilocus patterns which are very reproducible, abundant and polymorphic in plant genomes (Bornet and Branchard, 2004). Comparison of ISSR and other PCR-based markers have shown their efficiency in plant breeding (Adams et al., 2003; Archak et al., 2003; Galvan et al., 2003). A. macrostachyum is widely
distributed mainly in Mediterranean and Saharo-Arabian, extending far into adjacent regions (Zohary, 1966). Mouterde (1966) however, did not
mention the occurrence of this species in Syria. Up tell now, most variability/taxonomic affinity studies in A. macrostachyum have focused mainly
on the morphology, and a limited work has been carried out so far with nuclear DNA diversity. Currently, the exact phylogenetic relationships within the A. macrostachyum species are still
unclear. Accordingly, currently the traditional taxonomic classification is followed for this species. A great degree of taxonomic confusion exists in regard to A. macrostachyum species.
Molecular phylogenetic techniques were used with the hope that they could more readily elucidate the phylogenetic relationships within this species.
MATERIALS AND METHODS
Plant materials
Three genotypes of this species can be found in Syria and are located in the Western littoral salines coast at 12 km to North of Lattakia, providing source of samples for DNA extraction. Samples were collected in spring from the plants spread on the rocky and sandy soil with salinity estimated at an EC of 70 ds/m, and annual rainfall ranging from 650 to 700 mm. The genomic DNA of the plant was extracted from young leaves of three genotypes (samples) preventative of A. macrostachyum species in Syria (bulk of 5 plants
for each representative genotype) by a CTAB (cetyltrimethylammonium bromide) protocol.
Primer RAPD, ISSR designs and combinations
To match more loci at the genomic level, 20 RAPD primers were tested. A set of 20 random 10-mer primers was used for detecting the polymorphism among three genotypes of A. macrostachyum. The ISSR primers used in this
study were dinucleotides with eight repeat units and one anchoring base, e.g., (AC)8T, or two
anchoring base, e.g., (AG)8TC; or three anchoring
base (AG)8GTG and trinucleotides with five
repeat units such as (CAG)5 and (CAA)5 or
tetranucleotides with four repeat e.g. (GACA)4.
DNA amplification conditions and gel
electrophoresis
For RAPD and ISSR markers, the amplification reaction was carried out in 25 L reaction volume containing 1xPCR buffer, 2 mM MgCl2, 0.25 mM
template DNA. PCR amplification was performed in a T-gradient thermal cycler (Bio-Rad; T Gradient). It was programmed to fulfill 42 cycles (for RAPD analysis) or 35 cycles (for ISSR analysis) after an initial denaturation cycle for 4 min at 94 ºC. Each cycle consisted of a denaturation step 1 min at 94 ºC, an annealing step for 2 min at 35 ºC (for RAPD analysis) or 52 ºC (for ISSR analysis), and an extension step at 72 ºC for to 2 min, followed by extension cycle for 7 min at 72 ºC in the final cycle. The PCR products were separated on a 1.5% (for RAPD analysis) or 1.8% (for ISSR analysis) ethidium bromide- stained agarose (Bio-Rad) in 0.5xTBE buffer. Electrophoresis was performed for 3 h at 85V and visualized with a UV transilluminator.
RAPD and ISSR data analysis
The presence or absence of each size class was scored as 1 or 0, respectively. The percent disagreement value (PDVs) found were used to generate a matrix via the Unweighted Pair Group Mean Arithmetic average (UPGMA) using Statistica program (Statsoft, 2003). This matrix was used to calculate similarity/genetic distance (Jaccard, 1908). Polymorphic information content (PIC) values were calculated for each RAPD and ISSR primer according to the formula: PIC =
1-Σ(Pij)2 , where Pij is the frequency of the ith pattern
revealed by the jth primer summed across all
patterns revealed by the primers (Botstein et al., 1980).
RESULTS
The amplification products produced from RAPD and ISSR primers are listed in Table 1 in terms of the percentage of PCR products appeared in the genotypes studied. Most of markers were obtained with the OPG05 primer. The RAPD analysis carried out on the three genotypes of A. macrostachyum produced a large number of
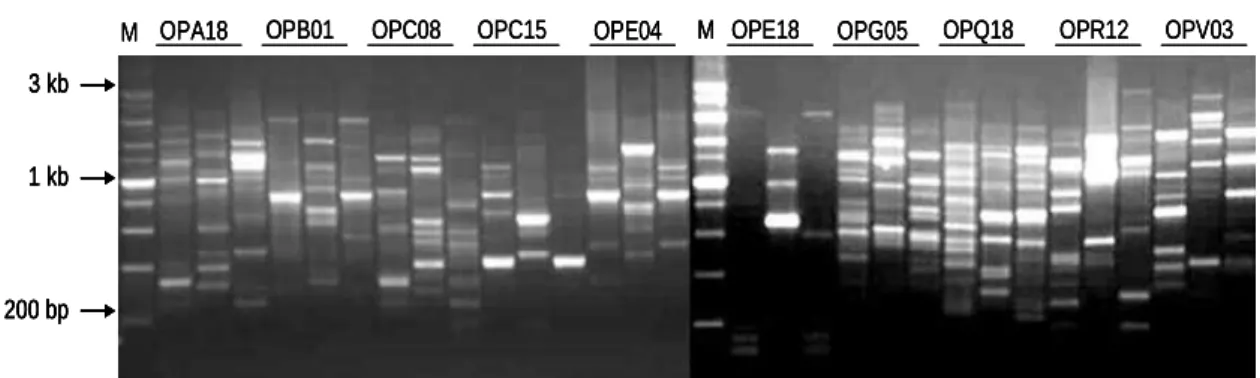
distinct fragments for each primer. The 20 selected arbitrary primers generated a total of 185 scorable bands of which 160 were polymorphic, with an average of 9.25 amplicons/primer. OPG05 gave the highest number of fragments (17 amplicons), while OPA02 revealed the least number (4 amplicons). Fig. 1 shows the RAPD profile for the three genotypes yielded by OPA18, OPB01, OPC08, OPC15, OPE04, OPE18, OPG05, OPQ18, OPR12 and OPV03. For ISSR markers, a total of 88 bands were generated, among which 80 bands were polymorphic. The percentage of polymorphic bands ranged between 66.66% for (CAG)5 primer
and 100% for (CA)8RG and (AG)8GTGprimers.
Fig. 2 showed that amplification with the latter two ISSR primers yielded highly informative patterns.
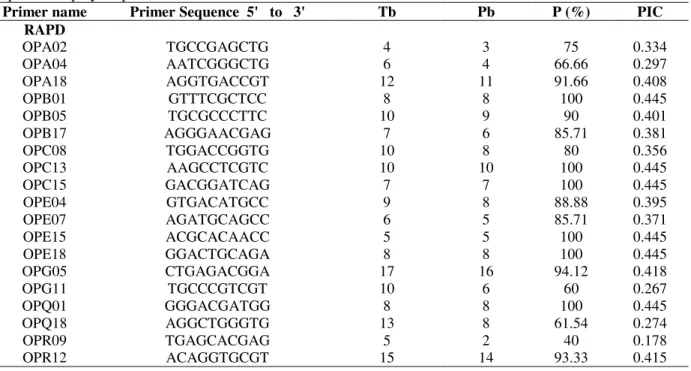
Table 1 - Selected RAPD and ISSR primers, total number of bands amplified, number of polymorphic bands,
proportion of polymorphic bands and PIC values.
Primer name Primer Sequence 5' to 3' Tb Pb P (%) PIC
RAPD
OPA02 TGCCGAGCTG 4 3 75 0.334
OPA04 AATCGGGCTG 6 4 66.66 0.297
OPA18 AGGTGACCGT 12 11 91.66 0.408
OPB01 GTTTCGCTCC 8 8 100 0.445
OPB05 TGCGCCCTTC 10 9 90 0.401
OPB17 AGGGAACGAG 7 6 85.71 0.381
OPC08 TGGACCGGTG 10 8 80 0.356
OPC13 AAGCCTCGTC 10 10 100 0.445
OPC15 GACGGATCAG 7 7 100 0.445
OPE04 GTGACATGCC 9 8 88.88 0.395
OPE07 AGATGCAGCC 6 5 85.71 0.371
OPE15 ACGCACAACC 5 5 100 0.445
OPE18 GGACTGCAGA 8 8 100 0.445
OPG05 CTGAGACGGA 17 16 94.12 0.418
OPG11 TGCCCGTCGT 10 6 60 0.267
OPQ01 GGGACGATGG 8 8 100 0.445
OPQ18 AGGCTGGGTG 13 8 61.54 0.274
OPR09 TGAGCACGAG 5 2 40 0.178
OPR12 ACAGGTGCGT 15 14 93.33 0.415
(Cont. Table 1)
Primer name Primer Sequence 5' to 3' Tb Pb P (%) PIC
OPV03 CTCCCTGCAA 15 13 86.66 0.385
Total 185 160
Mean 9.25 7.95 84.963 0.377
ISSR
ISSR-1 (CAG)5 12 8 66.66 0.259
ISSR-2 (GACA)4 11 10 90.91 0.404
ISSR-3 (AG)8TC 15 14 93.33 0.415
ISSR-4 (AC)8T 16 15 93.75 0.417
ISSR-5 (AG)8GTG 15 15 100 0.445
ISSR-6 (CA)8RG 12 12 100 0.445
ISSR-7 (CAA)5 7 6 85.72 0.381
Total 88 80
Mean 12.57 11.42 90.91 0.395
Tb: Total number of bands Pb: Number of polymorphic bands P (%): Polymorphic bands (%) PIC: Polymorphic information content
Figure 1 - Polymorphism resultant from the use of OPA18, OPB01, OPC08, OPC15, OPE04,
OPE18, OPG05, OPQ18, OPR12 and OPV03 RAPD primers for A. macrostachyum
genotype 1,2,3; Lane M, DNA marker 1 kb.
Figure 2 - Polymorphism resultant from the use of ISSR-1, ISSR-2, ISSR-3, ISSR-4, ISSR-5,
ISSR-6 and ISSR-7 primers for A. macrostachyum genotype 1,2,3; Lane M, DNA
marker 1 kb.
DISCUSSION
PCR amplifications from the 20 RAPD primers gave an average of 9.25 selected markers /primer.
Amplification products were obtained in the range of 4–17. For OPG05 primer, the highest number of fragments (17 amplicons) was detected, while OPA02 primer revealed the least number (4
200 bp 1 kb 3 kb
OPA18 OPB01 OPC08 OPC15 OPE04 OPE18 OPG05 OPQ18 OPR12 OPV03
M M
200 bp 1 kb 3 kb
OPA18 OPB01 OPC08 OPC15 OPE04 OPE18 OPG05 OPQ18 OPR12 OPV03
M M
200 bp 1 kb 3 kb
200 bp 1 kb 3 kb
OPA18 OPB01 OPC08 OPC15 OPE04 OPE18 OPG05 OPQ18 OPR12 OPV03
M M
3 kb
1 kb
200 bp
M ISSR-1 ISSR-2 ISSR-3 ISSR-4 ISSR-5 ISSR-6 ISSR-7
3 kb
1 kb
200 bp M
3 kb
1 kb
200 bp 3 kb
1 kb
200 bp 3 kb 3 kb
1 kb 1 kb
200 bp 200 bp
amplicons). A total of 185 amplicons were generated by the tested primers with an average of 9.25 amplicons/primer. Behera et al. (2008) reported an average of 7.17 markers/ primer in Indian bitter gourd (Momordica charantia L.).
However, Singh et al. (2006) demonstrated that the generation of RAPD fragments ranged from 8 to 13 in Solanum, thus with an average of 10.28
bands /primer. Such a high variation in the number of fragments produced by these arbitrary primers could be attributed to the differences in the binding sites throughout genome of the genotypes included. The total number of polymorphic observed bands was 160 with an average of 7.95 polymorphic amplicons/ primer. This represented a level of polymorphism of 84.96% (Table 1). With regards to ISSR markers, the present results showed that the seven ISSR tested primers revealed high polymorphic bands. Fingerprinting showed a total number of 88 unambiguous DNA fragments with an average of 12.57 fragments/ primer. The number of polymorphic bands ranged between 6 and 15 /primer with an average of 11.42 polymorphic bands/ primer. The total number of polymorphic amplicons produced by the tested primers was 80, thus representing a level of polymorphism of 90.91% (Table 1). These results
indicated that the percentage of ISSR (90.91%) was more important than of RAPD polymorphic bands (84.96%). The mean number of RAPD bands (9.25) was less than of ISSR (12.57); the mean number of RAPD polymorphic bands (7.95) was also less than of ISSRs (11.42). Bornet and Branchard (2004) reported the generation of 13 to 26 markers in Brassica and Arabidopsis thaliana
by ISSR primers. Both of RAPD and ISSR fragments ranged from 0.2 to 3 kb. The generated 600, 1000 and 1200 bp DNA fragments by RAPD OPQ18 were characteristic for the three genotypes tested. The RAPD OPE18 produced a specific product of about 700 and 1000 bp in genotype 2 only (Fig. 1). The ISSR with (CAG)5 primer
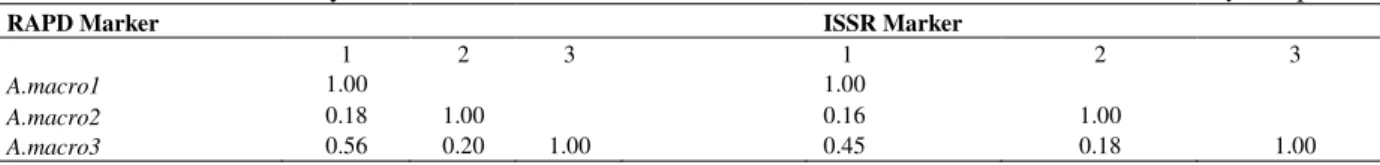
amplified the DNA fragments of 600 and 800 bp representative of the three genotypes tested (Fig. 2). The genetic similarity (GS) values generated from RAPD markers varied between 0.181 and 0.562 with an average of 0.543. The minimum GS value derived between the genotype 1 and 2 and the maximum GS value was between genotype 1 and 3. A similar trend was achieved using the ISSR markers but with lower GS values with a range of 0.162 to 0.452 and an average of 0.511 (Table 2).
Table 2 – Jaccard's similarity matrix of RAPD and ISSR data for the three accessions of A. macrostachyum species.
These results were in accordance with the well recognized assumption for the role of anchoring base number in detecting the pear phylogeny (Monte-Corvo et al., 2001). The dinucleotide yielded highly informative patterns compared to those tri- and tetratnucleotide. In the present study, tri- ISSR (CAG)5 primer generated the lowest
percentage of polymorphic markers (66.66%). Previously, in rice plants (Oryza sativa L.), the
dinucleotide repetitive sequence primers were found to be more amenable to ISSR analysis than the tri-, tetra-, and pentanucleotide primers (Blair et al., 1999). Some researchers have demonstrated
that anchoring primers at their 3' ends lowered the number of sequences which had homology to the primers, thus producing distinct bands (Parsons et al., 1997). The success in amplifying the specific bands also depends on the anchoring motif
(Pharmawati et al., 2005). An especially attractive feature of ISSR analysis is its flexibility in terms of experimental design: the number of generated amplicons may be optimized by changing the number of the core repeat units and anchoring bases (Liu and Wendel, 2001).
For ISSR markers, the percentage of polymorphic bands ranged between 66.66% with (CAG)5 and
100% with (CA)8RG (Hou et al., 2005) and
(AG)8GTG (Bornet and branchard, 2004). The PIC
values detected by RAPD primers ranged from 0.178 in OPR09 to 0.445 in OPB01, OPC13 and OPC15, while, in ISSR marker, it ranged from 0.259 in (CAG)5 to 0.445 in (AG)8GTG and
(CA)8RG primers. The ISSR markers exhibited a
relatively higher PIC average (0.395) compared to RAPD markers (0.377). In this regard, Manimekalai et al. (2006) found that the mean PIC
RAPD Marker ISSR Marker
1 2 3 1 2 3
A.macro1 1.00 1.00
A.macro2 0.18 1.00 0.16 1.00
value for the ISSR was higher than the mean PIC observed with the RAPD technique (0.31 and 0.23, respectively) in coconut (Cocos nucifera L). In
this respect, similar findings were reported by Hou et al. (2005) in barley. A dendrogram showing the relationships among the three genotypes was constructed by the UPGMA clustering method and as shown in Fig. 3.
The pattern generated for RAPD or ISSR data demonstrated that the three genotypes of A. macrostachyum clustered into two clusters. The
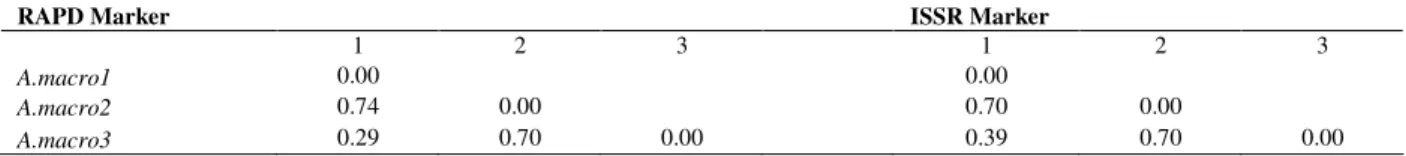
first contained genotypes 1 and 3 that were closely related at PDV=0.29 (Similarity 0.562) in the case of RAPD and PDV=0.39 (Similarity 0.452) in the case of ISSR fingerprint (Tables 2-3).
Figure 3 - UPGMA cluster analysis-based on the percent disagreement value (PDV), a)
dendrogram for RAPD fingerprints and b) for ISSR fingerprints showing genetic relationship among the three genotypes of A. macrostachyum species.
Table 3 - Percent Disagreement Values (PDV) produced by the 20 RAPD and 7 ISSR primers using UPGMA
routine in statistical program.
RAPD Marker ISSR Marker
1 2 3 1 2 3
A.macro1 0.00 0.00
A.macro2 0.74 0.00 0.70 0.00
A.macro3 0.29 0.70 0.00 0.39 0.70 0.00
The second contained genotype 2. In the present investigation, it was obvious that the dendrogram based on RAPD markers was in accord with the dendrogram based on ISSR markers. In general, the efficiency of a molecular marker technique depends on the amount of polymorphism that could be detected among the set of accessions investigated. In the present study, ISSR fingerprinting was more efficient than the RAPD assay. The latter detected 90.91% polymorphic DNA markers among the three analyzed genotypes, compared with 84.96% for RAPD fingerprinting. Similar results were obtained for several other plant species such as in peanut (Arachis hypogaea) (Raina et al., 2001), wild rice Oryza granulate (Qian et al., 2001), and Picea sp
(Nkongolo et al., 2005). The present results were also in accordance with the observation by Fernández et al. (2002); Tanyolac (2003) and Hou
et al. (2005) in barley. In the Western coast of Syria, the three accessions formed dense communities and were collected from the same region. Thus, the polymorphism observed among these three accessions could not be due to the geographic distribution. The present results represented the first genetic study of A. macrostachyum species in Syria. Additional data,
especially from the morphological traits, could provide useful information on the variation and classification of this species. In the Western coast of Syria, it often forms densely monodominant communities or co-occurs with other species such as Halimione portulacoides (L) Aellen, Inula chritmoides L. and Juncus acutus L.
In conclusion, the use of RAPD and ISSR could be a powerful tool to assess the genetic diversity in A. macrostachyum. This study provided new
variability of A. macrostachyum and for a general
phylogenetic relationship among the three genotypes of this species. This study showed that
A. macrostachyum genotype 2 was too genetically
distinct from the two other tested genotypes. According to the dendrogram based on RAPD and ISSR markers, it could be suggested that A. macrostachyum genotype 2 belonged to a
subspecies that was different from that of the other genotypes 1 and 3. The taxonomy of the Australian representatives of the Salicorniodeae is complicated by the presence of large subspecies complexes, as well as putative hybrids (Wilson, 1980). Polyploidy is also evident at both the species and subspecies level (Shepherd and Yan, 2003). In the present work, the RAPD and ISSR analysis allowed for a somewhat extensive subspecies partitioning within A. macrostachyum
which was often in concordance with the known pedigree information. Future studies on the population and evolutionary genetics of the A. macrostachyum would be needed since these
accessions presented considerable interest for the genetic studies and plant improvement. Moreover, they have a potential use for reclamation of salt affected lands, a major problem in Mediterranean basin.
ACKNOWLEDGEMENTS
The author would like to thank Prof. Othman I, Director General of AECS and Prof. MirAli N, Head of Molecular Biology and Biotechnology Department for their support, and also to the Plant Biotechnology group for technical assistance.
REFERENCES
Adams, R. P.; Schwarzbach, A. E. And Pandey, R. N. (2003), The concordance of terpenoid, ISSR and RAPD markers, and ITS sequence data sets among genotypes: an example from Juniperus. Biochem. Syst. Ecol., 31: 375-387.
Angiosperm Phylogeny Group. (2003), An update of the Angiosperm Phylogeny Group classification for the orders and families of flowering plants: APG II.
Bot. J. Linn. Soc.,141: 399-436.
Archak, S.; Gaikwad, A. B.; Gautam, D.; Rao, E. V. V. B.; Swamy, K. R. M. and Karihaloo, J. L. (2003), Comparative assessment of DNA fingerprinting techniques (RAPD, ISSR and AFLP) for genetic
analysis of cashew (Anacardium occidentale L.)
accessions of India. Genome., 46: 362-369.
Arnau, G.; Lallemand, J. and Bourgoin, M. (2003), Fast and reliable strawberry cultivar identification using inter simple sequence repeat (ISSR) amplification.
Euphytica., 129: 69-79.
Behera, T. K.; Singh, A. K. And Staub, J. E. (2008), Comparative analysis of genetic diversity in Indian bitter gourd (Momordica charantia L.) using RAPD and ISSR markers for developing crop improvement strategies. Sci. Hortic., 115: 209-217.
Blair, M. W.; Panaud, O. and McCouch, S. R. (1999). Inter-simple sequence repeat (ISSR) amplification for analysis of microsatellite motif frequency and fingerprinting in rice (Oryza sativa L.). Theor. Appl. Genet., 98: 780-792.
Bornet, B. and Branchard, M. (2004), Use of ISSR fingerprints to detect microsatellites and genetic diversity in several related Brassica taxa and Arabidopsis thaliana. Hereditas., 140: 245-248.
Botstein, D.; White R. L.; Skolinck, M. and Davis, R.W. (1980), Constraction of a genetic linkage map in man using restriction fragment length polymorphisms. Am. J. Hum. Genet., 32: 314-331. Contandriopoulos, J. (1968), A propos des nombres
Chromosomiques des Salicornia de la région méditerranéenne. Bulletin du Museum D’Histoire Naturelle de Marseille, 28: 45-52.
de Fraine, E. (1912), Anatomy of the genus Salicornia.
J. Linn. Soc. Lond. Bot., 41: 317-348.
Fernández, M. E.; Figueiras, A. M. And Benito, C. (2002), The use of ISSR and RAPD markers for detecting DNA polymorphism, genotype identification and genetic diversity among barley cultivars with known origin. Theor. Appl. Genet., 104: 845-851.
Galvan, M. Z.; Bornet, B.; Balatti, P. and Branchard, M. (2003), Inter simple sequence repeat (ISSR) markers as a tool for the assessment of both genetic diversity and gene pool origin in common bean (Phaseolus vulgaris L.). Euphytica.,132: 297-301.
Goulão, L. C. and Oliveira, M. (2001), Molecular characterization of cultivars of apple (Malus × domestica Borkh.) using microsatellite (SSR and
ISSR) markers. Euphytica., 122: 81-89.
Hou, Y. C.; Yan, Z. H.; Wei, Y. M. And Zheng, Y. L. (2005), Genetic diversity in barley from west China based on RAPD and ISSR analysis. Barley. Genet. News., 35: 9-22.
Jaccard, P. (1908), Nouvelles recherches sur la distribution flora. Bull. Sac. Nat., 44: 223-270.
Joshi, S. P.; Gupta, V. S.; Aggarwal, R. K.; Ranjekar, P. K. And Brar, D. S. (2000), Genetic diversity and phylogenetic relationship as revealed by inter-simple sequence repeat (ISSR) polymorphism in the genus
Judd, W. S. and Ferguson, I. K. (1999), The genera of Chenopodiaceae in the southeastern United States.
Harvard Papers in Botany, 4: 365-416.
Kadereit, G.; Borsch, T.; Weising, K. And Freitag, H. (2003), Phylogeny of Amaranthaceae and Chenopodiaceae and the evolution of C4 photosynthesis. Int. J. Plant. Sci., 164: 959-986.
Kadereit, G.; Mucina, L. And Freitag, H. (2006), Phylogeny of Salicornioideae (Chenopodiaceae): diversification, biogeography, and evolutionary trends in leaf and flower morphology. Taxon., 55 (3):
617–642.
Liu, B. and Wendel, J. F. (2001) Inter simple sequence repeat (ISSR) polymorphisms as a genetic marker system in cotton. Mol. Ecol. Notes., 1: 205-208.
Manimekalai, R.; Nagarajan, P. and Kumaran, P. M. (2006), Comparison of effectiveness of RAPD, ISSR and SSR markers for analysis of coconut (Cocos nucifera L.) germplasm accessions. Eighteenth
Annual Congress of the PGIA, pp. 16-17.
Martins, M.; Tenreiro, R. And Oliveira, M. M. (2003), Genetic relatedness of Portuguese almond cultivars assessed by RAPD and ISSR markers. Plant. Cell. Rep., 22: 71-78.
Mouterde, P. (1966), Nouvelle flore du liban et de la Syrie. Vol 1 (Texte), Beyrouth-Liban.
Nkongolo, K. K.; Michael, P. And Demers, T. (2005), Application of ISSR, RAPD, and cytological markers to the certification of Picea mariana, P. glauca, and P. engelmannii trees, and their putative hybrids. Genome., 48: 302-311.
Okun, D. O.; Kenya, E. U.; Oballa, P. O.; Odee, D. W. Muluvi, G. M. (2008), Analysis of genetic diversity in Eucalyptus grandis (Hill ex Maiden) seed sources
using inter simple sequence repeats (ISSR) molecular markers. Afr. J. Biotech., 7 (13): 2119-2123.
Parsons, B. J.; Newbury, H. J.; Jackson, M. T. and Ford-Lloyd, B. V. (1997), Contrasting genetic diversity relationships are revealed in rice (Oryza sativa L.) using different marker types. Mol. Breeding., 3: 115-125.
Pharmawati, M.; Yan, G. and Finnegan, P. M. (2005), Molecular variation and fingerprinting of Leucadendron cultivars (Proteaceae) by ISSR markers. Ann. Bot., 95: 1163-1170.
Pujol, J. A.; Calvo, J. F. And Ramírez-Díaz, L. (2000), Recovery of germination from different osmotic conditions by four halophytes from Southeastern Spain. Ann. Bot., 85: 279-286.
Qian, W.; Ge, S. and Hong, D. Y. (2001), Genetic variation within and among populations of a wild rice
Oryza granulate from China detected by RAPD and
ISSR. Theor. Appl. Genet., 102: 440-449.
Raina, S. N; Rani, V.; Kojima, T.; Ogihara, Y.; Singh K. P. And Devarumath, R. M. (2001), RAPD and ISSR fingerprints as useful genetic markers for
analysis of genetic diversity, varietals identification, and phylogenetic relationships in peanut (Arachis hypogaea) cultivars and wild species. Genome., 44:
763-772.
Schütze, P.; Freitag, H. and Weising, K. (2003), An integrated molecular and morphological study of the subfamily Suaedioideae Ulbr. (Chenopodiaceae).
Plant. Syst. Evol., 239: 257-286.
Shepherd, K. A and Yan, G. (2003), Chromosome number and size variations in the Australian Salicornioideae (Chenopodiaceae)—evidence of polyploidisation. Aust. J. Bot.,51: 1-12.
Singh, A. K.; Singh, M.; Singh, A. K.; Singh, R.; Kumar, S. and Kalloom, G. (2006), Genetic diversity within the genus Solanum (Solanaceae) as revealed
by RAPD markers. Curr. Sci., 90 (5): 711-716.
Soltis, D. E.; Soltis, P. S.; Chase, M. W.; Mort, M. E.; Albach, D. C.; Zanis, M. J.; Savolainen, V.; Hahn, W. H.; Hoot, S. B.; Fay, M. F.; Axtell, M.; Swensen, S. M.; Prince, L. M.; Kress, W. J.; Nixon, K. C. and Farris, J. S. (2000), Angiosperm phylogeny inferred from 18S rDNA, rbcL, and atpB sequences. Bot. J. Linn. Soc., 133: 381-461.
Statsoft, (2003), Statistica (Data analysis software system), version 6. Statsoft Inc, www.statsoft.com. Tanyolac, B. (2003), Inter-simple sequence repeat
(ISSR) and RAPD variation among wild barley (Hordeum vulgare subsp. spontaneum) populations
from west Turkey. Genet. Resour. Crop. Ev., 50:
611-614.
Townsend, C. C. (1993), Amaranthaceae. InV. Bittrich [ed.], The families and genera of vascular plants, vol. 2: 70–91. Springer-Verlag, Berlin- Germany.
Vicente, M. J.; Conesa, E.; varez-Rogel, J. Á.; Franco, J. A. And Martínez-Sínchez, J. J. (2007), Effects of various salts on the germination of three perennial salt marsh species. Short communication, Aquat. Bot., 87: 167-170.
Williams, J. G. K.; Kubelik, A. R.; Livak, K. J.; Rafalski, J. A. and Tingey, S. V. (1990), DNA polymorphisms amplified by arbitrary primers are useful as genetic markers. Nucleic. Acids. Res., 18:
653l-6535.
Wilson, P. G. (1980), A revision of the Australian species of Salicornieae (Chenopodiaceae). Nuytsia., 3: 1-154.
Wilson, P. G. (1984), Chenopodiaceae. In A. George [ed.], Flora of Australia, vol. 4: 277–309. Australian Government Publishing Service, Canberra, Australian Capital Territory- Australia.
Zohary, M. (1966), Flora Palaestina. Part 1 (Text), Jerusalem-Israel.