Submitted29 August 2016 Accepted 31 October 2016 Published1 December 2016 Corresponding authors Lukasz Roszkowiak, [email protected] Carlos Lopez, [email protected] Academic editor Maria Tretiakova
Additional Information and Declarations can be found on page 11
DOI10.7717/peerj.2741
Copyright
2016 Roszkowiak and Lopez
Distributed under
Creative Commons CC-BY 4.0
OPEN ACCESS
PATMA: parser of archival tissue
microarray
Lukasz Roszkowiak1and Carlos Lopez2
1Laboratory of Processing Systems of Microscopic Image Information, Nalecz Institute of Biocybernetics and Biomedical Engineering, Polish Academy of Sciences, Warsaw, Poland
2Molecular Biology & Research Laboratory (IISPV, URV), Hospital de Tortosa Verge de la Cinta, Tortosa, Spain
ABSTRACT
Tissue microarrays are commonly used in modern pathology for cancer tissue evalu-ation, as it is a very potent technique. Tissue microarray slides are often scanned to perform computer-aided histopathological analysis of the tissue cores. For processing the image, splitting the whole virtual slide into images of individual cores is required. The only way to distinguish cores corresponding to specimens in the tissue microarray is through their arrangement. Unfortunately, distinguishing the correct order of cores is not a trivial task as they are not labelled directly on the slide. The main aim of this study was to create a procedure capable of automatically finding and extracting cores from archival images of the tissue microarrays. This software supports the work of scientists who want to perform further image processing on single cores. The proposed method is an efficient and fast procedure, working in fully automatic or semi-automatic mode. A total of 89% of punches were correctly extracted with automatic selection. With an addition of manual correction, it is possible to fully prepare the whole slide image for extraction in 2 min per tissue microarray. The proposed technique requires minimum skill and time to parse big array of cores from tissue microarray whole slide image into individual core images.
SubjectsComputational Biology, Pathology, Histology
Keywords Biomedical engineering, Virtual slide, Whole slide imaging, Tissue microarray, Image processing, Automatic segmentation, Image segmentation
INTRODUCTION
Backgroundit significantly improves processing time, allows obtaining more reproducible results, and greatly reduces the cost of analysis.
TMA are mostly used for cancer tissue evaluation. The analysis of TMA is very similar to regular analysis of histological slides (Seidal, Balaton & Battifora, 2001) as it is mostly based on visual examination, but instead of one specimen there are many in one slide. Nevertheless, reading big arrays of cores can be burdensome and requires caution. As the cores are not labelled directly on the slide with any text or number, the only way to distinguish specimens is based on their arrangement. The assumed grid structure (array) of the TMA with cores located on the grid nodes is often distorted through the mechanical procedures performed during the glass slide preparation (Fowler et al., 2011;Werner et al., 2000). It is very important to distinguish the correct order that was executed while the TMA was prepared.
Since computer-aided observation and analysis of tissue samples is increasingly common idea and TMA slides can be treated as normal histological slides, it is also possible to make their digital copy. Slide scanners create a virtual image of the whole glass slide (Kayser et al., 2006;Kayser et al., 2010;Pantanowitz et al., 2013). Whole slide images of TMA are enormous, in the context of size, pixels (resolution), as well as disk space. It is impossible to process these images at full resolution due to limited memory capabilities of a standard computer workstation. Splitting the whole virtual slide into separate images of individual cores is required for further image processing. The size of these images is suitable for analysis using a 64-bit based computer systems. Therefore, the image-processing algorithms (Redondo et al., 2012;Roszkowiak et al., 2016;Markiewicz et al., 2006;Neuman et al., 2010;Korzynska et al., 2013) process cores rather than whole slides.
Although TMA is gaining popularity in clinical practice, it is still more common in research facilities. A vital step to improve the speed and quality of this process is to correctly locate each tissue core in the array. Usually the tissue cores are aligned in a typical microarray, but quite often the TMA cores are askew and incomplete. The problems with automatic selection of cores in TMA include: places where the core should be located, but is actually absent because of technical issues; incomplete cores; cores consisting of many fragments; heavily skewed rows, where cores are relocated in unpredictable manner; stain deposits in the background.
Aim
Related works
Currently, there is lack of available software that helps the researcher to extract single core image from the whole slide image, which is free of charge, simple to use, and automatic.
There are a few scientific works (Lahrmann et al., 2010;Dell’Anna et al., 2005) that can be related to this kind of image processing of TMA. Most of the software focuses on the designing (Thallinger et al., 2007) or scoring punches of TMA (Amaral et al., 2013). Some have been created to support specific study and do not support various data. Other programs apply manual processing (Chen, Reiss & Foran, 2004). The user must set the number of rows and columns and sometimes select the first core manually. Web-based solutions (Della Mea et al., 2006;Demichelis et al., 2006;Galizia et al., 2008) are not very efficient while working with high-resolution whole slide image, because transferring files with a size of 30 gigabytes or more is rather problematic. Some programs are meant to work with computer-controlled microscope for collecting data (Rabinovich et al., 2006); with addition of TMA planning program this may give good results for new research but not while handling archival data. Other solutions found in the literature include Image Miner (Foran et al., 2011), recently published complex computer-aided diagnosis system (Milagro Fernandez-Carrobles et al., 2014;Milagro Fernandez-Carrobles et al., 2015) for TMA, and others (Morgan et al., 2004;Liu et al., 2005).
There are also commercial solutions such as TMALab from APERIO or TMADesigner2 from APHELYS. The major disadvantage of commercial software is that it is bound to a specific slide scanner.
METHOD
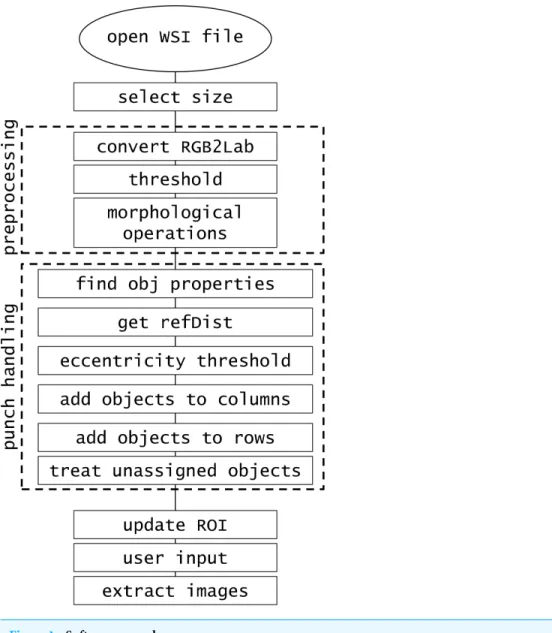
The software was developed in MATLAB R2014b implemented on Intel Core i7-4710MQ @2.50 GHz CPU, 16.0GB RAM. The created procedure consists of the steps presented in
Fig. 1.
File reading
Virtual slide files usually have an inner structure of tiled images that can form the full picture in multiple resolutions. Loaded files are investigated for available resolutions concealed inside. Depending on the user’s choice—manual or automatic—working resolution is selected for analysis. Automatic selection always chooses the smallest resolution. Manual selection gives user a choice by providing all available resolutions. The selected image is then preprocessed. As of now, the supported format for virtual slides is single-file pyramidal tiled TIFF file format.
Preprocessing
Figure 1 Software procedure.
series of other morphological operations including closing, filling, and border clearing are performed (see Algorithm 1). As a result of the preprocessing we obtain black and white images where objects correspond to punch (or fragment of punch) location.
Algorithm 1Preprocessing procedure with morphological operations description (formu-las according to Iwanowski (2009))
1: I←input image
2: 1se←structuring element
3: procedurepreprocess
4: IL=rgb2lab(I) ⊲convert colour space
5: Ith=thresholding(IL) ⊲Luminescence layer
6: Ith◦1se=(Ith⊖1se)⊕1se ⊲morph opening
7: Ith•1se=(Ith⊕1se)⊖1se ⊲morph closing
8: Ith1se(∂Ith∩Ith) ⊲filling holes
9: Ith\Ith1se(∂Ith∩Ith) ⊲border clear
where:⊖erosion;⊕dilation;∂border mask
Punch handling
We collect properties of found objects (area, centroid, eccentricity, and bounding box— standard MATLAB features). Then, we try to assess the common distance between the cores. This reference distance (refDist) is calculated based on the most circular punch (object with the minimum value of eccentricity) as halved mean of bounding box’s width and height. We assume that the distance between the punches is no greater than reference distance. We also assume that punches are objects with eccentricity lower than 0.9. Objects that fulfill the criteria are assigned to columns and rows based on their centroid coordinates (see Algorithm 2).
First, objects are assigned to columns one after the other. Among all the unassigned objects we seek the one with the smallest horizontal coordinate. Then, we look for objects with centroid located not further than reference distance, but only in terms of horizontal coordinate. The valid objects are assigned to currently evaluated column. Then, we look for objects in the next column.
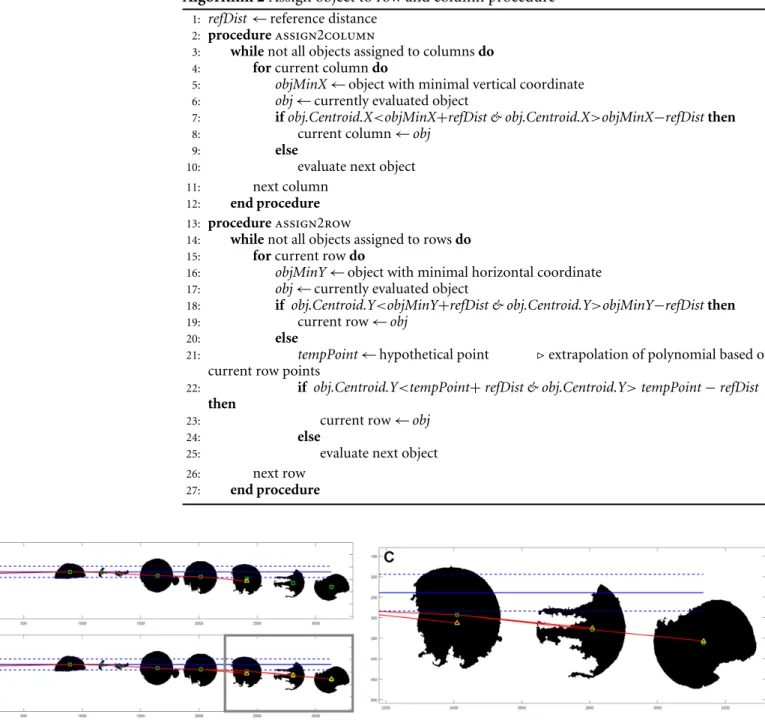
After objects are allocated to columns, we try to determine the proper row assignment. First step is similar to that in column search; the object with the lowest vertical coordinate is found. Then, we examine the rest of the objects if they are valid for this row. Objects within the reference distance in terms of vertical coordinate are assigned to currently evaluated row. If this criterion is not met, we have an additional condition based on the centroids of objects already assigned to the currently examined row. We evaluate the polynomial of second degree based on at least three points. Then, we make an extrapolation of that polynomial with the horizontal value of the currently examined centroid. If the assumed point is within the reference distance of examined centroid, then it is also assigned to the current row. Example of such assignment is shown inFig. 2.
Algorithm 2Assign object to row and column procedure
1: refDist←reference distance
2: procedureassign2column
3: whilenot all objects assigned to columnsdo
4: forcurrent columndo
5: objMinX←object with minimal vertical coordinate
6: obj←currently evaluated object
7: ifobj.Centroid.X<objMinX+refDist & obj.Centroid.X>objMinX−refDistthen
8: current column←obj
9: else
10: evaluate next object
11: next column
12: end procedure
13: procedureassign2row
14: whilenot all objects assigned to rowsdo
15: forcurrent rowdo
16: objMinY←object with minimal horizontal coordinate
17: obj←currently evaluated object
18: if obj.Centroid.Y<objMinY+refDist & obj.Centroid.Y>objMinY−refDistthen
19: current row←obj
20: else
21: tempPoint←hypothetical point ⊲extrapolation of polynomial based on current row points
22: if obj.Centroid.Y<tempPoint+refDist & obj.Centroid.Y>tempPoint−refDist
then
23: current row←obj
24: else
25: evaluate next object
26: next row
27: end procedure
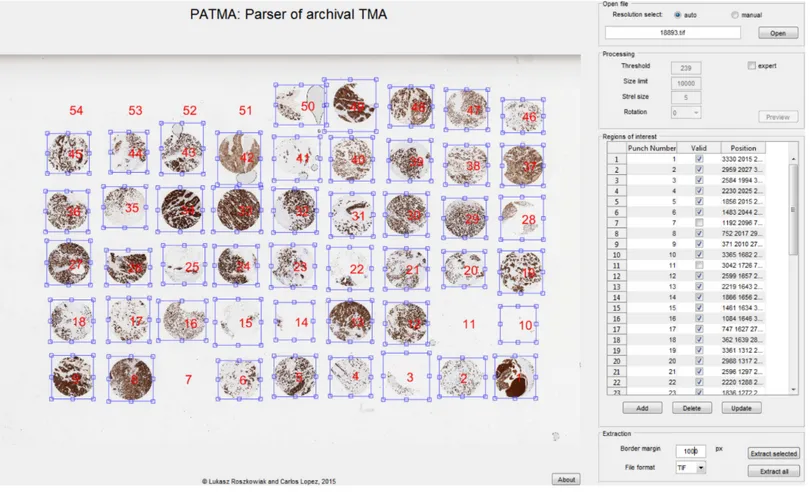
Figure 3 Graphical user interface of the developed software.TMA with overlay of regions of interest presented in the main window. This inter-face also contains subsections related to the file selection, preprocessing, the list of ROI, and extraction.
coordinates of each column and row is calculated. Then, this object is assigned to the closest row and column by distance.
Finally, duplicate assignments to rows and columns are treated with the same algorithm. Around every object a region of interest (ROI) similar to the bounding box is created. The regions are adjusted so that there is no overlap. Lastly, correct numerical labels, corresponding to TMA punch numbering, are applied to each ROI.
The designed array structure of the TMA is often distorted, cores can be relocated and may also disappear completely leaving ‘‘holes.’’ Because we evaluate assumed reference distance between the cores of TMA, we can figure out where the cores should be in the array despite their actual absence. We assign successive numerical label to the identified ‘‘holes’’ (ROI object with turned off Validity option—see the following paragraph).
User input
To make editing easier, there is a table presented in the GUI that consists of Numerical label, Position parameters, and Validity. Validity option provides a way to keep correct numbering of punches while there are empty spaces between them. Objects marked as not valid are not extracted in the final step. All of these attributes can be manually changed.
Extraction
The selected ROI containing punches are extracted from the maximum available resolution image as separate files. The user can add border margin to the extracted punch to be sure that every pixel with information is inside the selected ROI. Only one punch or all punches from the TMA can be extracted. Images are saved with easily distinguishable filenames in TIFF format.
RESULTS
There were 27 virtual slides of TMA available to perform the evaluation of this software. The files were received from Molecular Biology & Research Laboratory from Hospital Verge de la Cinta (IISPV). The glass TMA slides have been prepared according to the procedure described in detail inLopez et al. (2014). The WSI has been acquired using the whole slide scanner (ScaneScope, Aperio) with 40×/0.75 Plan Apo objective lens. We used all the available data with the exception of one file that had to be excluded, as the image file contained only a part of the whole TMA which was also rotated. Results are presented in
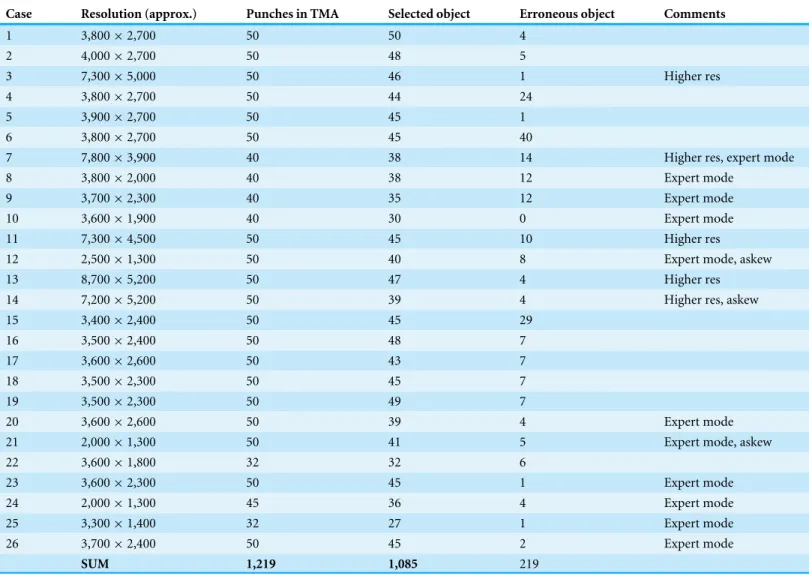
Table 1. In five cases we used resolution chosen manually, as it yielded much better results than automatically selected minimal available resolution (in pyramidal tiled TIFF file). In 11 cases we had to useexpert mode (see Preprocessing in the Methodology section) to improve the results, due to strong stain deposit in the background. About 58% of images were processed by entirely automatic method.
The number of punches per virtual slide varied from 32 to 50. We assume that satisfactory selection consist of ROI with punch. The total percentage of correctly selected cores in 26 evaluated TMA was 89%. In total, 1,085 out of 1,219 punches were selected correctly as a whole core with index of correct row and column. In the majority (16) of cases we achieved 90% or more correctly selected punches in the TMA slide. In only seven images PATMA method resulted in selecting over 10 erroneous objects. The number of objects which were incorrectly assigned can be most definitely lowered with human interaction (expert mode). The PATMA’s semi-automatic processing approximately takes less than 2 min to fully prepare the TMA slide if the quality of TMA and scanned image is satisfactory. For images that need more human interaction takes about 5 min.
DISCUSSION
Table 1 All results of core selection on 26 valid cases.Approximate values of segmented miniature image size are presented in Resolution column. Wherever higher resolution was chosen manually, as it yielded much better results than minimal available resolution, there ishigher rescomment. Punches in TMA are cores planned in the TMA (regardless if the core is still in the image). Selected objects is the number of correctly set ROI (in-cluding cores and ‘‘holes’’). Erroneous objects are all extra, unnecessary ROI set in the image that have to be deleted manually.
Case Resolution (approx.) Punches in TMA Selected object Erroneous object Comments
1 3,800×2,700 50 50 4
2 4,000×2,700 50 48 5
3 7,300×5,000 50 46 1 Higher res
4 3,800×2,700 50 44 24
5 3,900×2,700 50 45 1
6 3,800×2,700 50 45 40
7 7,800×3,900 40 38 14 Higher res, expert mode
8 3,800×2,000 40 38 12 Expert mode
9 3,700×2,300 40 35 12 Expert mode
10 3,600×1,900 40 30 0 Expert mode
11 7,300×4,500 50 45 10 Higher res
12 2,500×1,300 50 40 8 Expert mode, askew
13 8,700×5,200 50 47 4 Higher res
14 7,200×5,200 50 39 4 Higher res, askew
15 3,400×2,400 50 45 29
16 3,500×2,400 50 48 7
17 3,600×2,600 50 43 7
18 3,500×2,300 50 45 7
19 3,500×2,300 50 49 7
20 3,600×2,600 50 39 4 Expert mode
21 2,000×1,300 50 41 5 Expert mode, askew
22 3,600×1,800 32 32 6
23 3,600×2,300 50 45 1 Expert mode
24 2,000×1,300 45 36 4 Expert mode
25 3,300×1,400 32 27 1 Expert mode
26 3,700×2,400 50 45 2 Expert mode
SUM 1,219 1,085 219
PATMA identifies not only cores but also ‘‘holes’’—places where the core should be located, but is actually absent because of technical issues. As a result, we can assign successive numerical labels to all locations of designed array structure of the TMA. It is very useful to identify the ‘‘holes’’ to keep the correct numerical labelling of cores. It is critical to distinguish the correct order that was executed while the TMA was formed as this is the only way to distinguish specimens.
purpose of comparison we performed manual cores extraction on single TMA image with 50 cores and this took about 5 h.
One of the major problem we encountered are heavily skewed rows of TMA. Relocation of punches often happens during many steps of the TMA slide formation (Korzynska et al., 2014;Yaziji & Barry, 2006). It is impossible to predict if the punches will form askew line or will be randomly relocated. Sometimes two consecutive lines go in different directions in the final image. In this type of deformation it is hard to determine the correct row of the punch even for a human expert. We achieved our goal in case of this problem; from 3 TMA with most askew rows (seeTable 1), the 80% of cores have been correctly selected without human interaction.
Another problem is that the staining of TMA is often not carried out perfectly, which causes deposits and overstained tissue parts in the background of virtual slide (Stromberg et al., 2007;Lejeune et al., 2013;Liu et al., 2002). This may result in segmentation of erroneous objects. In 7 images, where PATMA selected over 10 erroneous objects, it was due to stain deposit.Expert modeshould be used whenever there is a stain deposit in the background to handle that problem manually.
Incomplete cores or those with many fragments are not a great problem. They usually are well located and merged into one ROI. Artifacts present in the image are much more difficult to handle. Big glue deposit is usually treated as an additional punch or merged with the closest punch. It is a deliberate procedure, because it is easier to delete additional ROI than to precisely create a new one. For the slides with extra glue or stain deposits or with cores consisting of many fragments our strategy to remove manually all extra artifacts appears to be efficient. It takes a very small amount of operator’s time to make adjustments; the whole procedure time takes up to 2 min.
In some cases, the amount of corrections that were necessary may seem high, but they are performed quickly and take much less time than extracting single punches manually. There are 219 erroneous objects (false positives) in evaluated dataset but they can be effortlessly discarded during user inspection. Handling of erroneous object takes no more than 2 s. However, 134 (11%) cores were not found (false negatives) in the evaluated dataset and should be added manually. Handling missing objects consist of adding new ROI, moving it to correct location in the TMA and adjusting the borders. It takes more time and effort than deleting erroneous object but with use of PATMA it is still faster and more straightforward than manual extraction. In total, it takes 2–5 min to set up all necessary ROI in TMA whole slide image for extraction. In comparison with fully manual processing, which takes hours, the advantage of PATMA is beyond doubt.
CONCLUSIONS
We present free software to efficiently extract separate punches from virtual slides of TMA. It is simple to use for any pathology laboratory, molecular research laboratory, or any other research facility. The great advantages of our software are that it requires none to minimal user input for typical TMA virtual slides and minimum skill and time to operate.
This automation is an advantage for the Molecular Biology & Research Laboratory compared to the previously used software, which was fully automatic, but worked without considering the location of cores in rows and columns. The time needed to relabel cores so they would match correct specimen was considerably longer than the proposed semi-automatic processing. The use of PATMA allows a substantial reduction in the processing time and easier error handling.
Future work
In the future, we want to further develop the software to improve its performance. We plan to implement the background elimination algorithm in the preprocessing stage to cope with strong stain deposits. We would like to improve punches’ assignment to correct rows and columns, even in heavily skewed tissue microarrays, for example by assuming grid structure that would be matched elastically to actual structure. Finally, we plan to expand the supported file types, so that the other file formats would be handled.
ADDITIONAL INFORMATION AND DECLARATIONS
Funding
The study is cofounded by the European Union from resources of the European Social Fund. Project PO KL ‘‘Information technologies: Research and their interdisciplinary applications,’’ Agreement UDA-POKL.04.01.01-00-051/10-00. This work is cofounded by grant number PI11/0488 from the Institute of Health Carlos III (Instituto de Salud Carlos III), Spain. The funders had no role in study design, data collection and analysis, decision to publish, or preparation of the manuscript.
Grant Disclosures
The following grant information was disclosed by the authors: European Union.
Project PO KL ‘‘Information technologies: research and their interdisciplinary applications’’: UDA-POKL.04.01.01-00-051/10-00.
Institute of Health Carlos III: PI11/0488.
Competing Interests
The authors declare there are no competing interests.
Author Contributions
• Carlos Lopez conceived and designed the experiments, contributed reagents/materials/-analysis tools, reviewed drafts of the paper, discussed the methodology.
Data Availability
The following information was supplied regarding data availability:
MathWorks: http://www.mathworks.com/matlabcentral/fileexchange/60131-patma--parser-of-archival-tma?requestedDomain=www.mathworks.com.
Supplemental Information
Supplemental information for this article can be found online athttp://dx.doi.org/10.7717/ peerj.2741#supplemental-information.
REFERENCES
Amaral T, McKenna SJ, Robertson K, Thompson A. 2013.Classification and im-munohistochemical scoring of breast tissue microarray spots.IEEE Transactions on Biomedical Engineering60(10):2806–2814DOI 10.1109/TBME.2013.2264871.
Chen W, Reiss M, Foran DJ. 2004.A prototype for unsupervised analysis of tissue microarrays for cancer research and diagnostics.IEEE Transactions on Information Technology in Biomedicine8(2):89–96DOI 10.1109/TITB.2004.828891.
Della Mea V, Bin I, Pandolfi M, Di Loreto C. 2006.A web-based system for tissue microarray data management.Diagnostic Pathology 1(1):1–5
DOI 10.1186/1746-1596-1-36.
Dell’Anna R, Demichelis F, Barbareschi M, Sboner A. 2005.An automated procedure to properly handle digital images in large scale tissue microarray experiments.
Computer Methods and Programs in Biomedicine79(3):197–208
DOI 10.1016/j.cmpb.2005.04.004.
Demichelis F, Sboner A, Barbareschi M, Dell’Anna R. 2006.TMABoost: an integrated system for comprehensive management of tissue microarray data.IEEE Transactions on Information Technology in Biomedicine10(1):19–27
DOI 10.1109/TITB.2005.855540.
Du X, Dua S. 2010.Segmentation of fluorescence microscopy cell images using unsuper-vised mining.Open Medical Informatics Journal4:41–49
DOI 10.2174/1874431101004010041.
Foran DJ, Yang L, Chen W, Hu J, Goodell LA, Reiss M, Wang F, Kurc T, Pan T, Sharma A, Saltz JH. 2011.ImageMiner: a software system for comparative analysis of tissue microarrays using content-based image retrieval, high-performance computing, and grid technology.Journal of the American Medical Informatics Association 18(4):403–415DOI 10.1136/amiajnl-2011-000170.
Galizia A, Viti F, Orro A, D’Agostino D, Merelli I, Milanesi L, Clematis A. 2008.
TMAinspect, an EGEE framework for tissue microarray image handling. In:8th IEEE international symposium on cluster computing and the grid, 2008. CCGRID ’08. 741–746DOI 10.1109/CCGRID.2008.100.
Garcia-Rojo M, Bueno G, Slodkowska J. 2010.Review of imaging solutions for inte-grated quantitative immunohistochemistry in the pathology daily practice.Folia Histochemica et Cytobiologica47(3):349–354DOI 10.2478/v10042-008-0114-4.
Ilyas M, Grabsch H, Ellis IO, Womack C, Brown R, Berney D, Fennell D, Salto-Tellez M, Jenkins M, Landberg G, Byers R, Treanor D, Harrison D, Green AR, Ball G, Hamilton P. 2013.Guidelines and considerations for conducting experiments using tissue microarrays.Histopathology62(6):827–839DOI 10.1111/his.12118.
Iwanowski M. 2009.Leonard B, ed.Metody morfologiczne w przetwarzaniu obrazow cyfrowych [Morphological operations in digital image processing]. Warsaw: Aka-demicka Oficyna Wydawnicza Exit.
Kallioniemi O-P, Wagner U, Kononen J, Sauter G. 2001.Tissue microarray technology for high-throughput molecular profiling of cancer.Human Molecular Genetics 10(7):657–662DOI 10.1093/hmg/10.7.657.
Kayser K, Borkenfeld S, Gortler J, Kayser G. 2010.Image standardization in tissue— based diagnosis.Diagnostic Pathology 5(Suppl 1):Article S13
DOI 10.1186/1746-1596-5-S1-S13.
Kayser K, Radziszowski D, Bzdyl P, Sommer R, Kayser G. 2006.Towards an automated virtual slide screening: theoretical considerations and practical experiences of auto-mated tissue-based virtual diagnosis to be implemented in the Internet.Diagnostic Pathology1:1–8DOI 10.1186/1746-1596-1-10.
Korzynska A, Neuman U, Lopez C, Lejeun M, Bosch R. 2010. The method of im-munohistochemical images standardization. In: Choras RS, ed.Image processing and communications challenges 2. Advances in intelligent and soft computing, vol. 84. Berlin, Heidelberg: Springer, 213–221.
Korzynska A, Roszkowiak L, Lopez C, Bosch R, Witkowski L, Lejeune M. 2013. Vali-dation of various adaptive threshold methods of segmentation applied to follicular lymphoma digital images stained with 3,3′-diaminobenzidine & haematoxylin. Diagnostic Pathology8(1):Article 48DOI 10.1186/1746-1596-8-48.
Korzynska A, Roszkowiak L, Pijanowska D, Kozlowski W, Markiewicz T. 2014.The influence of the microscope lamp filament colour temperature on the process of digital images of histological slides acquisition standardization.Diagnostic Pathology 9(Suppl 1):Article S13DOI 10.1186/1746-1596-9-S1-S13.
Lahrmann B, Halama N, Westphal K, Ernst C, Elsawaf Z, Sinn P, Bosch FX, Dickhaus H, Jger D, Schirmacher P, Grabe N. 2010.Robust gridding of TMAs after whole-slide imaging using template matching.Cytometry Part A77A(12):1169–1176
DOI 10.1002/cyto.a.20949.
identification efficiency in immunohistochemical nuclear markers with a high background level.Diagnostic Pathology8(1):1–7DOI 10.1186/1746-1596-8-S1-S13.
Liu CL, Montgomery KD, Natkunam Y, West RB, Nielsen TO, Cheang MCU, Turbin DA, Marinelli RJ, Van de Rijn M, Higgins JPT. 2005.TMA-Combiner, a simple software tool to permit analysis of replicate cores on tissue microarrays.Modern Pathology18(12):1641–1648DOI 10.1038/modpathol.3800491.
Liu CL, Prapong W, Natkunam Y, Alizadeh A, Montgomery K, Gilks CB, Van de Rijn M. 2002.Software tools for high-throughput analysis and archiving of immunohis-tochemistry staining data obtained with tissue microarrays.The American Journal of Pathology161(5):1557–1565DOI 10.1016/S0002-9440(10)64434-3.
Lopez C, Callau C, Bosch R, Korzynska A, Jaen J, Garcia-Rojo M, Bueno G, Salvado MT, Alvaro T, Onos M, Fernandez-Carrobles MDM, Llobera M, Baucells J, Orero G, Lejeune M. 2014.Development of automated quantification method-ologies of immunohistochemical markers to determine patterns of immune response in breast cancer: a retrospective cohort study.BMJ Open4(8):1–7
DOI 10.1136/bmjopen-2014-005643.
Markiewicz T, Osowski S, Patera J, Kozlowski W. 2006.Image processing for accurate cell recognition and count on histologic slides.Analytical and Quantitative Cytology and Histology28(5):281–291.
Milagro Fernandez-Carrobles M, Bueno G, Deniz O, Salido J, Garcia-Rojo M. 2014.
Automatic handling of tissue microarray cores in high-dimensional microscopy images.IEEE Journal of Biomedical and Health Informatics18(3):999–1007
DOI 10.1109/JBHI.2013.2282816.
Milagro Fernandez-Carrobles M, Bueno G, Deniz O, Salido J, Garcia-Rojo M, Gonzalez-Lopez L. 2015.A CAD system for the acquisition and classification of breast TMA in pathology.Studies in Health Technology and Informatics210:756–760
DOI 10.3233/978-1-61499-512-8-756.
Morgan JD, Jacobuzio-Donahue C, Razzaque B, Faith D, De Marzo AM. 2004. TMAJ: open source software to manage a tissue microarray database [Abstract 1094]. In:
Archives of pathology and laboratory medicine, vol. 128.
Neuman U, Korzynska A, Lopez C, Lejeune M. 2010. Segmentation of stained lym-phoma tissue section images. In: Pietka E, Kawa J, eds.Information technologies in biomedicine. Advances in intelligent and soft computing, vol. 69. Berlin Heidelberg: Springer, 101–113.
Neuman U, Korzynska A, Lopez C, Lejeune M, Roszkowiak L, Bosch R. 2013.
Equalisation of archival microscopic images from immunohistochemically stained tissue sections.Biocybernetics and Biomedical Engineering 33(1):63–76
DOI 10.1016/S0208-5216(13)70056-1.
Rabinovich A, Krajewski S, Krajewska M, Shabaik A, Hewitt SM, Belongie S, Reed JC, Price JH. 2006.Framework for parsing, visualizing and scoring tissue microarray images.IEEE Transactions on Information Technology in Biomedicine10(2):209–219
DOI 10.1109/TITB.2005.855544.
Redondo R, Bueno G, Cristobal G, Vidal J, Deniz O, Garcia-Rojo M, Murillo C, Relea F, Gonzalez J. 2012.Quality evaluation of microscopy and scanned histological images for diagnostic purposes.Micron43(2–3):334–343DOI 10.1016/j.micron.2011.09.010.
Rexhepaj E, Agnarsdottir M, Bergman J, Edqvist P-H, Bergqvist M, Uhlen M, Gallagher WM, Lundberg E, Ponten F. 2013.A texture based pattern recognition approach to distinguish melanoma from non-melanoma cells in histopathological tissue microarray sections.PLoS ONE 8(5):1–15DOI 10.1371/journal.pone.0062070.
Roszkowiak L, Korzynska A, Lejeune M, Bosch R, Lopez C. 2016. Improvements to segmentation method of stained lymphoma tissue section images. In: Burduk R, Jackowski K, Kurzyński M, Wożniak M, Żołnierek A, eds.Proceedings of the 9th International conference on computer recognition systems CORES 2015. Advances in intelligent systems and computing, vol. 403. Berlin, Heidelberg: Springer International Publishing, 609–617.
Seidal T, Balaton AJ, Battifora H. 2001.Interpretation and quantification of immunos-tains.The American Journal of Surgical Pathology25(9):1204–1207
DOI 10.1097/00000478-200109000-00013.
Stromberg S, Bjorklund MG, Asplund C, Skollermo A, Persson A, Wester K, Kampf C, Nilsson P, Andersson A-C, Uhlen M, Kononen J, Ponten F, Asplund A. 2007.A high-throughput strategy for protein profiling in cell microarrays using automated image analysis.Proteomics7(13):2142–2150DOI 10.1002/pmic.200700199.
Thallinger GG, Baumgartner K, Pirklbauer M, Uray M, Pauritsch E, Mehes G, Buck CR, Zatloukal K, Trajanoski Z. 2007.TAMEE: data management and analysis for tissue microarrays.BMC Bioinformatics8(1):1–12DOI 10.1186/1471-2105-8-81.
Werner M, Chott A, Fabiano A, Battifora H. 2000.Effect of formalin tissue fixation and processing on immunohistochemistry.The American Journal of Surgical Pathology 24(7):1016–1019DOI 10.1097/00000478-200007000-00014.
Yaziji H, Barry T. 2006.Diagnostic immunohistochemistry: what can go wrong?
Advances in Anatomic Pathology13(5):238–246