Vol-7, Special Issue-Number4-June, 2016, pp653-664 http://www.bipublication.com
Research Article
Study the air pollution due to Dorud Cement Plant (in Iran)
Vahid Mokhtari1, Seyed Hadi Khatami2 and Bahareh Lorestani3
1
Islamic Azad University, Hamedan Branch, Department of the Environment, Hamedan, Iran
2
Environment PhD, Assessment Office of Environmental Protection Agency E-mail: [email protected]
3
Faculty member of Islamic Azad University,
Hamedan Branch, Department of the Environment, Hamedan, Iran
ABSTRACT:
Cement industry is one of the most important industries in the country. Dorud Cement Plant is one of the largest and oldest Iran's cement factories, which is working in the center of the city of Dorud. In this study, aimed to investigate air pollution resulting from Dorud cement plant, the parameters of CO, CO2, O2, NO, NO2, NOx, SO2, dry dust particles, particles weight and environmental particulates of PM10 and PM2.5 were measured with conventional methods of measuring emissions from industrial chimneys and by using automatic measuring equipment, and the rates of emissions from the chimneys of the plant were calculated during a working year. These measurements were made over three months, from February 20, 2015 to May 21, 2015, at 3 stations of Link1-k1, Link2-k1 and Link3-k1, which are the chimneys of the three-lines of the plant. It was found in this study that the chimney No. 3 enters the maximum contaminant into the environment. The results also showed that based on the standards defined for the cement industry, Dorud cement plant meets the relative optimal conditions in terms of comparing performance with the standards, and the emissions from the factory are less than the enacted standards for this industry. Also, the preventive measures and equipment for reducing emissions established in this industrial unit have a relative utility. In this study, the factors including type of raw materials used, old production lines and old factory equipment, type of producing cement and proximity to the city were determined as main reasons for the emissions produced by this industry. Also, some management solutions such as the use of environment designing inside the manufacturing process of the plant and outside the plant, using flame-reducing, construction of a new phase and relocating the plant were suggested to reduce emissions from Dorud cement plants.
Keywords: Cement, Cement plant, Cement plant emissions, Air po llution
INTRODUCTION
Environmental pollutants (water, soil, air, etc.) arise from different natural and human sources.When it comes to air pollution,all attentions are focused on human activities. However, cases of catastrophes of air pollution have been also recorded in the history originated from the nature's activity. Before the industrial revolution, air pollutions were limited to the human activities, and the natural self-purification activities and processes would make them go away. With the onset of the industrial revolution and the increasing consumption of fossil fuels in industry, the levels of air
people worldwide lose their lives due to air pollution that 90% of them live in the developed countries. In some countries, the number of people dying due to same factors are more than the traffic accident victims (Hatami et al.,2007). The cement industry is among the polluting industries, in which in each of the different stages of cement production, including pre-heating, clinker building, clinker cooling, crushing operations and storage, large quantities of gas and dust with different physicochemical properties will be produced (Chehregani, 2005). The gases of NOX, SO2, CO and particulatesare among the output contaminants from the cement industry that would have side effects such as decreased oxygen carrying capacity of blood by combination with hemoglobin, heart attack, fibrinolysis (Ghiasedin, 2009), lungs poor performance and reduced breathing depth (Naddafi, 2009), warming, an increasedrate of cardiovascular diseases and change in the deterioration factor(Gurjar et al.,2008). Among these pollutants, particulates (dust) are the major constituents of air pollutants resulting from the activities of the cement production units (Riahi Samani, 2008).Many studies have been done regarding air pollution due to cement plants.In a study entitled as "Evaluatingthe rate of emitted pollutants from the chimney of Saman Cement factory, Kermanshah during 2012-2013, the amount of emissions from cement plant flue system of Saman Cement factory, Kermanshah was tested studied, and the output parameters of particulate matter and levels of SO2, NO, NO2 and CO were examined. The results suggested that the air pollution protection system had a satisfactory performance in terms of suspended material in all monitored outlets. However, due to higher levels of emissions standard, more controls should be done in this area (Almasi et al.,2014).Darabi et al. showed in their study that the radius of pollutants expansion varies depending on the type of contaminants and environmental conditions. They also concluded that usually dust and particulate matter are filtered very fast, and in contrast, gaseous pollutants, sulfur dioxide, fluoride, hydrogen and nitrogen dioxide are filtered at a slower pace but faster than nitric oxide and carbon monoxide
(Darabi et al.,2013). In a study,Shivaram examined the parameters of CO2, CO, NOX and SO2resulting fromcement industry, and reported the average concentrations of them respectively as 16.1, 222.6, 112.7 and3.8 milligrams per cubic meter (mg/Nm3) under normal conditions. It was also demonstrated in this study that these concentrationshave led to emission of 160.1 tons per hour of CO2, 123 kg per hour of CO, 623 kg per hour of NOX and 2.1 kg per hour of SO2 (Shivaram, 2014).In their study,Mishra et al. reported that sulfur oxides exist in all kinds of cement raw materials, and SO2 emissions of sulfur content due to raw material are lower than SO2 emissions from the sulfur content in the fuel (Mishra et al.,2014).Dorud city is located in the south-western of Iran in Lorestan province. The cement company of this city is among the most important industries of Lorestan province. Along with revenue-generation of this industry in the province, attention its pollution in terms of environmental conditions is of great importance. The present study was performed with the aimto determine the amount of pollutants of the air around Dorud cement factory and compare theconcentrations of these contaminants with the standards of open air.
MATERIALS & METHODS Studyarea
This study was conducted within the surrounding of Dorud cement factory located in the city of Dorud. The city of Dorud is located in the south and southeast of Silakhor plain and in the hillside of Boher KallehQandi (Takhtkooh) and Rangineh (Pariz) mountains. The city has an average elevation of 1522 meters above sea level, and is one of the eleven cities of Lorestan province with an area of 1348 km2, which accounts for about 4.8% of the province. Geographically, the city is located between the orbits of 33°17´ to 33°45´ north latitude and 48°46´ to 49°19´ east longitude in the north-eastern of Lorestan province (Statistical Yearbook of Lorestan, 2014).
Methodology
cement factory chimneys, and the samplings were performed monthly, in three consecutive months of March, April and May and in duration of 10 minutes for each measurement. In this
study, sampling was done nine times. In this study, samplings were done for measuring parameters in three stations of Link1-k1, Link2-k1 and Link3-Link2-k1 (Table 1).
Table 1:Sampling stations
Row
Station
name
Location Selection objective
1
Link1-k1 Chimney of the production line unit 1 Sampling, measuring the performance of the electro-filter in the chimney
2
Link2-k1 Chimney of the production line unit 2 Measuring the performance of bag-house and electro-filter in the chimney
3
Link3-k1 Chimney of the production line unit 3 Measuring the performance of the electro-filter in the chimney
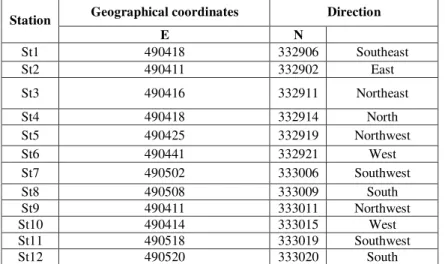
Also, 12 stations were considered for
measurement of PM10 and PM2.5 particles around the plant. Selecting these stations was done considering the prevailing wind direction, which blows from the south of the province as
well as the factory.The coordinates of the twelve stations are provided in Table 2.In Figure 1, the satellite image of sampling stations for the measurement of particulate matter has been specified.
Table 2: Coordinates of PM10 and PM2.5 sampling stations
Station
Geographical coordinates Direction
E N
St1
490418 332906 Southeast
St2 490411 332902 East
St3
490416 332911 Northeast
St4
490418 332914 North
St5
490425 332919 Northwest
St6 490441 332921 West
St7
490502 333006 Southwest
St8
490508 333009 South
St9
490411 333011 Northwest
St10
490414 333015 West
St11
490518 333019 Southwest
St12
490520 333020 South
Sampling tool and method of parameters analysis
The portable DUST TRAK device (model TSI-8520; made in USA) was used for testing the environment particulate matter. This device measures environmental particles of PM10 and PM2.5 by Light Scattering or Laser Scattering approach based on BS-EN-12341 standard method through direct counting (Ghaderi et al.,2015). To use the device, the device is automatically calibrated. After setting the current and locating in the proper position, slightly above the ground at 5.1 meters near the breathing level, it performs sampling and measurements within 10 minutes (Joziet al.,2012).In this study, the TCR-Tecora device (made in Italy) was also used for sampling, which is an automatic sample collector operating by gravimetric method in isokinetic
conditions based on the ISO9096 standard. This device has an internal calibration, with measurement accuracy of ± 2 mg and the response time about a minute (Akbari et al.,2013).In the present study,the measurement of pollutant gases concentrations was conducted by TESTO device (Model XL-350)according to
ASTMD5522-EPACTM-030-41 standard
mean of each parameter than to each chimney.Then, to standardize the values of parameters'concentrations than to the temperature of 25°C and 1 atmosphere pressure, the concentration of each parameter in normal conditions in terms of pressure and temperature was obtained by the following equation:
PPMPT=PPMNTP( )( )
PPMPT: Concentration of the pollutant at the moment of ambient pressure and temperature measurement PPMNTP: Parameter concentration in normal
conditions in terms of temperature and pressure P: Pressure in measurement environment in
terms of millimeters of mercury (mmHg) 760: Normal atmospheric pressure in terms of
millimeters of mercury
T: Temperature in the measurement
environment in Kelvin degrees (K) 298: Normal temperature in Kelvin degrees After converting and normalizingthe concentrations with the following formula, the obtained concentrations' values were converted from PPM to mg/m3.
C =
C: Parameter concentration in terms of milligrams per cubic meter (mg/m3) PPM: Average concentration of parameter in
normal and standard conditions MW: Parameter molecular weight
The figure 24.45 is related to the volume of one mol of gas at a temperature of 25 °C and 1 atmosphere pressure or 760 mmHg, or the measurement standard conditions. And normalizingand converting the concentrationsby using the following formula, the output rate from each chimney was calculated.
Q =V S
Q: Output rate in terms of cubic meters per second (m3/s) V: Flue gas velocity in meters per second (m/s) S: Chimney area in terms of square meters (m2),which was calculated by the following equation given the circular shape of the chimneys outlet cross-section
S = r2
S: Area in terms of square meters (m2)
: Pi number equal to 3.14
r: Radius of the circle in terms of centimeters (cm)
Following the calculating the output rate of each chimney, the emission rate of every parameter was calculated using the following formula: E = C Q
E: Emission rate in terms of milligram per second (mg/s)
C: Parameter concentration in terms of milligrams per cubic meter (mg/m3) Q: Output rate in terms of cubic meters per
second (m3/s) The resulting values of emission rate for each parameter in the sampling period, 10 minutes, are in milligrams. Thus, for calculating the emission rate in a year and given the three working shifts, after conversion the units in grams and using the proportion, first, the rates of emissions from each chimney were separately calculated; then, they were calculated and announced as the sum of the total amounts of pollutants released from Durod Cement Plant in tons.In this study, the Kolmogorov - Smirnov test was used to evaluate the normal distribution of data related to each of the research variables. Also, due to non-normal distribution of data of the two variables of dry particles mass and the amount of CO2, the non-parametric Kruskal-Wallis test was used to assess the significance of differences between the mass of dry particles and the amount of CO2of the three outputs. The Kruskal-Wallis test was also used to assess the significance of differences between the environmental particles of PM10 and PM2.5 of the studied stations.
RESULTS
of none of the research variables among the three studies output is significant. The Kruskal-Wallis test results showed that at confidence level of 95%, the difference between particles mass and the amount of CO2 in the three study
outputs is not significant.The Kruskal-Wallis test results showed that at confidence level of 95%, there is no significant difference between the rates of environmental particles of PM10 andPM2.5 in the studied stations.
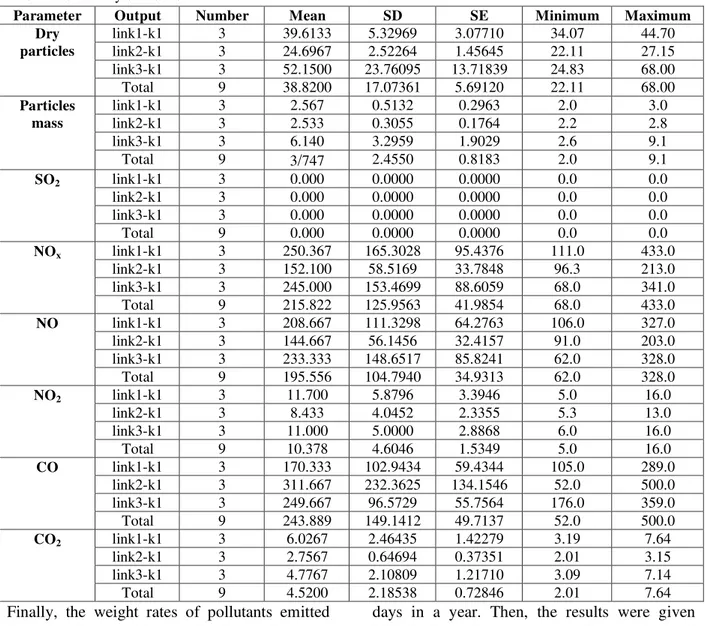
Table 3: Summary of results
Parameter
Output Number Mean SD SE Minimum Maximum
Dry particles
link1-k1 3 39.6133 5.32969 3.07710 34.07 44.70
link2-k1 3 24.6967 2.52264 1.45645 22.11 27.15
link3-k1 3 52.1500 23.76095 13.71839 24.83 68.00
Total 9 38.8200 17.07361 5.69120 22.11 68.00
Particles mass
link1-k1 3 2.567 0.5132 0.2963 2.0 3.0
link2-k1 3 2.533 0.3055 0.1764 2.2 2.8
link3-k1 3 6.140 3.2959 1.9029 2.6 9.1
Total 9 3/747 2.4550 0.8183 2.0 9.1
SO2 link1-k1 3 0.000 0.0000 0.0000 0.0 0.0
link2-k1 3 0.000 0.0000 0.0000 0.0 0.0
link3-k1 3 0.000 0.0000 0.0000 0.0 0.0
Total 9 0.000 0.0000 0.0000 0.0 0.0
NOx link1-k1 3 250.367 165.3028 95.4376 111.0 433.0
link2-k1 3 152.100 58.5169 33.7848 96.3 213.0
link3-k1 3 245.000 153.4699 88.6059 68.0 341.0
Total 9 215.822 125.9563 41.9854 68.0 433.0
NO link1-k1 3 208.667 111.3298 64.2763 106.0 327.0
link2-k1 3 144.667 56.1456 32.4157 91.0 203.0
link3-k1 3 233.333 148.6517 85.8241 62.0 328.0
Total 9 195.556 104.7940 34.9313 62.0 328.0
NO2 link1-k1 3 11.700 5.8796 3.3946 5.0 16.0
link2-k1 3 8.433 4.0452 2.3355 5.3 13.0
link3-k1 3 11.000 5.0000 2.8868 6.0 16.0
Total 9 10.378 4.6046 1.5349 5.0 16.0
CO link1-k1 3 170.333 102.9434 59.4344 105.0 289.0
link2-k1 3 311.667 232.3625 134.1546 52.0 500.0
link3-k1 3 249.667 96.5729 55.7564 176.0 359.0
Total 9 243.889 149.1412 49.7137 52.0 500.0
CO2 link1-k1 3 6.0267 2.46435 1.42279 3.19 7.64
link2-k1 3 2.7567 0.64694 0.37351 2.01 3.15
link3-k1 3 4.7767 2.10809 1.21710 3.09 7.14
Total
9 4.5200 2.18538 0.72846 2.01 7.64
Finally, the weight rates of pollutants emitted from the factory chimneys in the environment were calculatedin the course of three 8-hour shifts, and in total, for 24 hours a day, and for all
days in a year. Then, the results were given initially for each chimney, and then, as the total output of the plant in Table 4:
Table 4: Weight rates of output pollutants fr om the factory chimneys
Parameter
(Tons per year)Weight rate of emission
Link1-k1
Link2-k1 Link3-k1 Total
CO
1.1 2.49 1.74 5.33
CO2 616.3 345.6 523.5 1485.4
NO2 0.116 0.110 0.126 0.352
NO 1.45 1.23 1.74 4.42
NOx 2.33 1.73 2.44 6.5
Figure 3: Comparison chart of mean dry particles with standard values for Grade 1 and 2
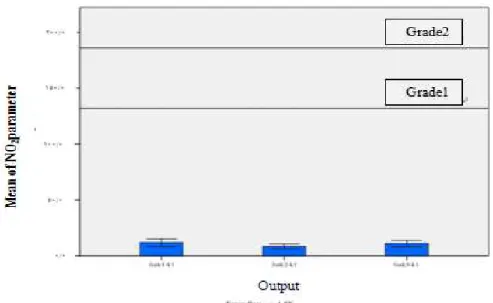
Figure 4:Comparison chart of mean NOXparameter with standard values for Grade 1 and 2
Figure 6:Comparison chart of mean NO2 parameter with standard values for Grade 1 and 2
Figure 7:Comparison chart of mean CO parameter with standard values for Grade 1 and 2
Figure 9: Comparison chart of mean PM2.5 parameter with standard values for Grade 1 and 2
DISCUSSION & CONCLUSION
In the current study,the greatest concentrations of parameters were seen as follows:
CO2 in the first station in May at a rate of 7.64 %
CO in the second station in April at a rate of 500PPM
NO2, respectively, in the first and third stations in April and May at a rate of 16 PPM
NO in the third station in April at a rate of 328 PPM
NOx in the first station in May at a rate of 433 PPM
Dry particles and dust particles in the third station in April with values of 68 mg per cubic meter and 9.12 mg, respectively
PM10 particles in the tenth station in March with the value of 0.105 mg
PM2.5 particles in the third station in May with the value of 0.037 mg
Quantitatively,the highest volume
concentrations of pollutants were in order related to CO2, CO and NOx emissions, while numerically,the greatest rate of pollutantswas related to parameter CO with a concentration of 500 PPM at the second stationin April. These results are consistent with the results of Almasi et al.(2014)studies on Saman Cement Factory,Kermanshah, which reported the
greatest amounts of emissions for CO2, CO and NOx. They are also consistent with the results of Daraie et al. research in 2012, suggesting that50% of the country's cement plant emissions are related to pollutants CO, NOx, SO2regarding the CO and NOx emissions.The highest value of O2parameter was seen in the second station as 17.31% in March, while the lowest value was in the first station, again in March, at a rate of 7.05%. It is necessary to mention that the O2 parameters was not among the main parameters of the study, but considered in the measurements for two reasons:
1- Using this parameter to calculate the amount of CO2.
2- If the values of parameter O2 is less than 2%at time of measurement, the conditions for measurement and obtaining results at standard conditions would not be met, and obtained values by the device lack scientific validity and are not reliable. For this reason, and given the obtained values for parameter O2, one can conclude that the results have been obtained under standard measurement conditions.
station, while its lowest value was observed in February at the second station.However, no significant differenceswere observed between the mean values average of the three outputs (P˃ 0.05). The parameter increase in May is due to use of raw materials containing high levels of calcium carbonate, which will be converted toCaO and CO2to produce clinker at high temperatures of the furnace.The results of this study are consistent with the results Khani Abadi et al. (Khani Abadi et al.,2014).The SO2 parameter was measured at very low values close to zero level in all stations and in all three months of measurement. In Allaban R et al. (2011) study, the value of SO2 was obtained in very low amount as 0.005 PPM, which are consistent with the results of this study. But, Khani Abadi et al. reported the result of measuring the amount of SO2 from the cement production process at Dorud factory in the winter of 2014 very high. However, this was due to the temporary use of Mazut instead of gas, which is an alternative fuel, and is oxidized due to having 1.5% sulfur during the process and produces SO2.In this study,the dry dust and particles parameter values were less than standard at all stations. The mean of this parameter was also below the standard level of grade 1 and 2. At confidence level of 95%, there is a significant difference between the mean values of dry particles (38.82) and standard values for Grade 1 and 2, and thus,they are far below the limit and in good condition. The mean values of this parameter compared with the results of Alamsi et al. studies in 2013 in Kermanshah Saman Cement Factory (with an average of 68.60 milligrams per cubic meter),Alizadeh et al.(2010) in Kerman Cement Factory (with an average of 380 milligrams per cubic meter) andAkbari et al.in (2013) Behbahan Cement Factory (with an average of 152 milligrams per cubic meter) are in proximity, and lower than all of the listed studies.The values of NOx parameter were higher than the standard Grade 1 in the first station in March and May, in the second station in May and in the third station in April and May, while they were higher than the standard Grade 2 in the first and second stations in May and in
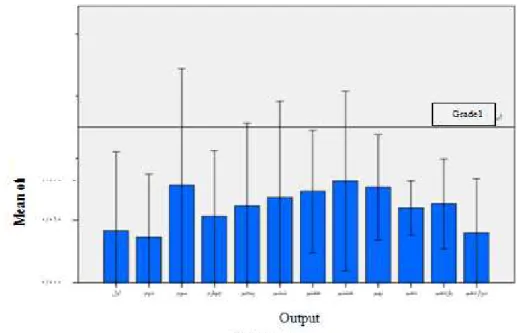
very close to the standard Grade 1, but lower. For this reason,one can say that the parameter is generated within the permitted range. Almasi et al. 2013stated that in Saman Cement Factory,the gas CO has the highest rate of emissions, which corresponded with the results of this study. Also, Khani Abadi et al. (2015) announced that in the next rank after CO2, the greatest amount of emissions is related to CO. However, given that CO is a toxic, dangerous and deadly gas, this amount of generation is a much greater health concern than the CO2 gas.The analyses on parameter PM10 showed thatamong the twelve stations, only the mean values of seventh, eighth, ninth and tenth stations are higher than the mean daily standard limit of these materials, but in comparing the total mean of this parameter (0.0442 milligrams per cubic meter)with daily standard limit (0.050 milligrams per cubic meter), we come to the conclusion that the release rate of this parameter is less than the allowed level and at an acceptable level.As for the parameter PM2.5 in the twelve stations, only the parameter valuesin the third, fifth, sixth, seventh and eighth stations in May are more than the daily standard. However, regarding the mean, the values of all stations are less than daily standard, and in terms of the total mean, the parameter (0.0115 mg per cubic meter) is much less than the daily limit (0.025). Regarding the evaluation of environmental dust and particles in Ardebil Cement Factory, Hazarati et al. (2010) reported in their study that the concentrations of environmental particles of PM10 and PM2.5are respectively as 0.0157 and 0.0272, which are higher than the valuesobtained in this research.In this study, the weight rates of output pollutants of the factory chimneys in the environmentwere calculated in the course of three 8-hour shifts and a total of 24 hours per day and for all the days of a year.The results showed that in one year continuous operation of Dorud cement plant, in three shifts with 525 600 minutes of performance, 5.33tons of CO, 1485.4 tons of CO2, 0.352 tons of NO2, 4.42 tons of NO, 6.5 tons of NOX and 6.11 tons of dry dust and particles are entered into the environment. Comparing the values,we find out that the
chimney 3 enter more pollution load into the environment than the other two chimney. This could be the subject of further research for its impacts on the environment. There is no doubt that the suspended solids would have effects on plants and soil of the surrounding environment of the factory.According to the description above and the values and the results obtained in this research, one can conclude that through measures taken, the air quality around Dorud cement plant is relatively appropriate based on the air quality standards, and the environmental preventive measures meet the pollution generated by the plant and have reduced the emissions from the factory to their environmental standards. However, the following suggestions are made to improve the current conditions and further reductionof the risks and pollutionsof this factory:
1- Moving the factory outside the city
2- Construction of the new line and development phase of the plant as soon as possible and replacing old lines with no new technology
3- Changing the mines that are currently used as the raw material supplier due to the type of extractives, closeness to the town and failure to observe the correct and standard model of these mines as well as making changes in extraction method and type of loading process of the raw materials from the current mines
4- Creating incentive programs to further use of pollution reduction technologies for the factory such as full exemption from payment of tax in case of reduced production and release of emissions
5- Using combined filter with conversion of electrostatic precipitator to electrostatic combined fabric precipitating filter in the same body or installing a bag filter in the downstream of the electrostatic precipitator 6- The use of reducing flame to reduce the
in reducing CO2 and, in general, reducing the NOx compounds. These fuels include tires, urban solid waste products, plastics, fuels derived from liquid waste, bio-waste fuels (food waste, sewage sludge, fats and meat of animals).
7- Use of the scrubbers to separate output particles and pollutant gases and considering the useful role of these devices in reducing the amount of gas emissions from industrial chimneys
8- Education and information providing regarding the implementation of new projects to reduce the amount of producing pollution, such as the use of alternative fuel 9- Reviving the poor existing green space and
creating new green space
10-Use of environment design to reduce pollutants in the cement industry for decreasing the costs due to pollutions and prevention of unwanted relevant costs In this study, the best ways and approaches to reduce dust and particles are suggested as follows:
Use of filter bags with efficiency of 99.7%
Creating alkaline conditions in the furnace with 95% efficiency to reduce SO2
Adjusting the air-fuel ratio to reduce CO
Using the stable operation process of the furnace, involving the setting of rotary kiln burners, creating a burning platform for pre-calciner, furnace gas recirculation for reuse and supplying the oxygen needed to reduce NOx levels
REFERENCES
1. Abu-Allaban, M., Abu-Qudais, H., (2011), Impact Assessment of Ambient Air Quality by Cement Industry: A Case Study in Jordan, Aerosol and Air Quality Research, 11, 802– 810.
2. Akbari A, Borhan diani S, an Evaluation of pollutant gases outlet cement factory behbahan Andcompared with the standard. 1th National Conference on Planning and Environmental Hamadan – Islamic Azad University 2011 Mar:1-8. (in Persian).
3. Alizadehdakhel, A., Ghavidel, A., Panahandeh, M., (2010), CFD Modeling of Particulate Matter Dispersion from Kerman Cement Plant, Iran, J. Health & Environ; 3(1): 67-74, (in Persian).
4. Almasi A, Asadi F, Mohamadi M, Farhadi F, Atafar Z, Khamutian R, et al. Survey of Pollutant emissions from stack of Saman ce ment factory of Kermanshah city from year 2011 to 2012. Journal of Health's in TheField 2013;1(2):36-44.
5. Binam, Statistical Yearbook of Lorestan province, (2014), Office of Statistics and Information of Lorestan Governor
6. Chehregani H. Environmental engineering in
cement industry, Tehran, Hazegh
Publications 2004; 135-278. (in Persian). 7. Darabi, H., Khanipour, A., (2013),
Application of environment design to reduce and control of pollutions in the cement industry, First International Conference on Cement Industry, Energy and Environment, Tehran, Tehran University
8. Daraie, H., Motasadi Zarandi, S., Piraste, M., (2011), Study of monitoring, maintenance, and problems of electrostatic precipitators in some cement plants in Iran, Knowledge Horizons, Journal of the Medical and Health Sciences, University Gonabad;3(17):66-74. (in Persian).
9. Ghiasedin M. Sanitary affects air pollution, air and sound pollution in law Iran. Tehran, Studies&Schematization Center Publications 2008; 58-62. (in Persian).
10.Ghiasedin, M., (2009), Air pollution, Translation by Perkins, Tehran, Tehran University Press, Third edition, pp. 410-415. 11.Gurjar B.R., Butler T.M., Lawrence M.G.,
Lelieveld J. (2008), Evaluation of emissions and air quality in megacities,Atmospheric Environment, 7:1593–1606.
12.Hatami, H., Razavi, S.M., Eftekhari Ardebili, H., Majlesi, F., (2007), Public health comprehensive book, Arjmand Publication, Vol. I, pp. 325-340
13.http://www.skcinc.com/catalog/infopage.php ?id=9000
environmental risk of polyethylene unit of Arya cell Polymer Company by EFMEA method, Tehran, Journal of Natural Resources, Science and Technology, Issue IV, pp. 147-159
15.Khani Abadi,Y., Rashidi, R., Godarzi. Gh., Zarea, S., (2014), Measurement and assessment of mass release of output gases emissions from Dorud cement factory chimney, Journal of Health in area, Shahid Beheshti University of Medical Sciences, School of Public Health, Volume 2, No. 2, pp. 36 -42
16.Mishra, Sh., Siddiqui, N., A., (2014), A Review On Environmental and Health
Impacts Of Cement Manufacturing
Emissions, International Journal of Geology, Agriculture and Environmental Sciences, 2(3): 26-31.
17.Naddafi K, Heydari M, Hasanvand MS, Qaderpour M. a comparative study of Tehran
air quality in 2006 to 2007. 11th Hamayeshe mohite behdashte. (Zahedan) 2008; 46-47. (in Persian).
18.Ryahi Samani M. Investigation of application precipitations in treatment output gas in cement factories,American Journal of Environmental Sciences 2007; 3 (3): 166-174.(in Persian).
19.Sepideh Ghaderi ; Azarnoosh
Rahimi; Mohsen Hedayatifar; Seyed
Mohammad Arab Najafi, (2015),
Environmental risk management and assessment of Tehran urban & suburban metro by using EFMEA method (Case study: Sadeghieh terminal), Volume 17, Issue 2, Page 61-71