Abstract—more accurate algorithm based on analytical approach for probabilistic security evaluation is proposed in this paper. New software named PSD-PRE is developed using Visual FORTRAN and Visual C++. It achieves calling of PSD-BPA which is the basis of PSD-PRE for state evaluation. Trait of PSD-PRE is that it can evaluate bulk power system probabilistic security considering bus arrangement. It makes the calculation results more accurate. Accelerating algorithm is adopted to alleviate the calculation burden of PSD-PRE. Not only the single or double faults of line or transformer but also the multi-fault caused by protection failure to operate or rejection can be modeled to get the probabilistic security risk indices. PSD-PRE has been tested by IEEE-RTS79 test system. Simulation results show that PSD-PRE is valid, available and indices can be used as the basis of transmission network planning.
Index Terms—Bulk power system, Bus arrangement,
Security, Probabilistic evaluation, Analytical method.
I. INTRODUCTION
In recent years, blackout occurs one by one in the world [1]. These events expose weakness of power grid. In order to prevent this kind blackout occurring, it’s needs to insist overall reliability evaluation on transmission network planning, design and operation. With this starting point, reliability research is gradually developed from adequacy evaluation to probabilistic security evaluation [2]-[9]. Existing reliability assessment software like TPLAN, GATOR, CONFTRO etc. are adequacy evaluation software [10]. So, evaluating system probabilistic security needs to adopt the manual method which calculation burden is very heavy. In the power market environment, risk assessment as well as cost / benifit analysis has become the important basis for transmission network planning and operation. Its evaluation result must ensure precision.
Raise calculation precision will naturally increase calculation quantity. Calculation burden is heavy especially when power grid has large scale. Therefore it’s very hard to evaluate bulk power system probabilistic security
Hailei He is with the power system department of China Electric Power Research Institute (CEPRI), District Haidian, Beijing, 100085, China(e-mail: [email protected])
Jianbo Guo is with the China Electric Power Research Institute (CEPRI), District Haidian, Beijing, 100085, China(e-mail: [email protected])
Yunting Song is with the power system department of China Electric Power Research Institute (CEPRI), District Haidian, Beijing, 100085, China (e-mail: [email protected])
Dongxia Zhang is with the power system department of China Electric Power Research Institute (CEPRI), District Haidian, Beijing, 100085, China(e-mail: [email protected])
considering bus arrangement. General method that evaluation indices are lower than the actual indices is evaluating high voltage power grid only. There is another more precise method which divides bulk power system into two parts: high voltage power grid and bus arrangement; then evaluates each part. But this method still exist obvious error. When evaluating bus arrangement probabilistic security, it is normally assumed that outlet is completely reliability [11]. Actually, outlet is not completely security.
New probabilistic security evaluation software named PSD-PRE is developed in this paper. It can evaluate bulk power system probabilistic security considering bus arrangement. Like failures caused by protection failure to operate or rejection can be modeled to get precise probabilistic security indices. These indices can provide logical and precise gist for transmission network planning and analysis.
II. GENERAL FUNCTION OF SOFTWARE
A. Principle of Software Design
PSD-PRE software is designed by following four steps: (1) Calling of PSD-BPA
Power flow data file *.DAT and transient stability data file *.SWI of PSD-BPA can be used as original input file through calling of PSD-BPA.
(2) Deposit parameter of research system
Parameters of elements such as line, node, generator, and transformer etc. getting from power flow data file are stored to get fault set. Then, PSD-BPA power flow program is executed to get result files.
(3) Carry out transient stability evaluation
On the foundation of *.BSE file, transient stability program is carried out under different fault condition and corresponding *.out file is saved up.
(4) Probabilistic security evaluation
Transient stability result file is analyzed to get the result set of probabilistic security evaluation. Then, risk indices are got through probabilistic security evaluation.
PSD-PRE software design process is as shown in Fig.1:
Probabilistic Security Evaluation Software for
Bulk Power System Considering Bus
Arrangement
Original input power flow data file *.DAT
End Start
Original input transient stability data file*.SWI
Evaluat all fault set ?
No
⑥es
Execute power flow program
Execute interface program, store parameters of elements to get fault set Execute transient stability program to get result file *.OUT
Probabilistic security evaluation
Fig.1 Flowchart of probabilistic security evaluation
B. Main Function of Software
Overall single element fault mode and part double elements fault mode are considered in risk assessment algorithm.
Single element fault modes are shown as follows: (1) Transmission line permanent short-circuit (including single phase to ground short-circuit, two-phase to ground short-circuit, phase to phase short-circuit, three-phase short-circuit); (2) Transmission line transient short-circuit; (3) Transmission line open circuit; (4) Short-circuit on bus-bar; (5) Short-circuit on transformer; (6) Fault of generator.
Double elements fault modes are shown as follows: (7) For dual circuit line, three-phase permanent short circuit on one circuit, and mal-operation of relay protection on the other; (8) Power transmission line short-circuit fault, one side switch failure to operate; (9) Short-circuit fault of bus, bus differential protection failure to operate; (10) Synonym phase fault of two circuits in dual circuit or multi-circuit on the same tower; (11) Simultaneous fault on any double circuits (including single phase to ground short-circuit, two-phase to ground short-circuit, phase to phase short-circuit, three-phase short-circuit).
As far as the calculation burden of analytical method is very heavy, accelerating algorithm is adopted to improve software efficiency. According to the severity degree of each fault, calculation order is determined. If system keep stability after calculating serious fault, next fault which severity degree lower than calculating fault do not need to calculate. According to fault above, fault 7-11 which relatively severity than other faults need to be calculated. Other faults calculation order is as follows:
Define Line fault: Three-phase short-circuit Three-phase open circuit Two-phase open circuit Single phase open circuit Two-phase to ground short-circuit Phase to phase short-circuit Single phase to ground short-circuit, auto-reclosing successful Single phase to ground short-circuit, auto-reclosing unsuccessful.
Severity degree of fault above is:
(1) if fault occur, system keep stability, faults behind are not calculated ; else fault and need to be calculated; (2) if fault occur, system keep stability, faults behind are not calculated; else fault needs to be calculated; (3) if fault occur, system keep stability, faults behind are not calculated; else fault needs to be calculated. Other faults calculation order is similar to the above.
PSD-PRE software can realize four functions: (1) carry out deterministic analysis of single or multi-fault; (2) carry out entire system security evaluation, and give dynamic probabilistic risk indices; (3) optimization assessment of many planning schemes; (4) for single planning scheme, weak links can be discovered by analyzing dynamic probabilistic risk indices.
Function (1) and (2) can get through directly calculation by PSD-PRE software. Function (3) and (4) can be used to supervise transmission network planning.
C. Input Interface
If user wants to carry out deterministic analysis, button “deterministic fault analysis” is just needed to be clicked. Then, the interface as shown in Fig.2 is pop-up.
On this interface, the following steps must be complied. First, select path of power flow data file; second, select path of transient stability data file; third, select zone needing to be calculated.
At this time, if user clicks the button “calculation”, software will calculate fault with default parameters.
Fig.2 main interface of deterministic fault analysis
If user clicks the button “detailed calculating parameter / self-defining”, another interface will be pop-up. This interface allows user to set up detailed calculating parameter, as shown in Fig.3.
First, user sets up fault type; second, fault cut time including single-phase auto-reclosing time; fault cut time; bus unites element cut time; bus switch cut time; back up protection cut time; cut time of bus failure, breaker failure to operate; last, set voltage grade: 110 kV, 220 kV, 330 kV, 500 kV, 750 kV. Click the button “calculation” after setting up all parameters, then, PSD-PRE will calculate fault of selecting zone.
If user wants to carry out probabilistic security evaluation, clicking the button “probabilistic security evaluation” is just
needed. Then, the interface as shown in Fig.4 is pop-up. On this interface, the following steps must be complied. First, select path of power flow data file; second, select path of transient stability data file; third, select zone that needs to be calculated; then, set up fault type, fault cut time, and voltage class; last, click the button “calculation”. PSD-PRE will calculate fault of selecting zone and give probabilistic security risk indices.
Fig.3 main interface of deterministic fault detailed parameter
Fig.4 main interface of probabilistic security evaluation
D. Output of Software
Judgment system stability is a very important step in probabilistic security evaluation. PSD-PRE defines system stability as biggest swing angle among unit no more than 300, bus-bar voltage no lower than 0.75p.u and duration no more than 1 sec.
When carrying out deterministic analysis, PSD-PRE exports result of text form. This result includes: the stability condition of system under different fault situation; minimum voltage and duration of node; biggest swing angle among unit.
When carrying out probabilistic security evaluation, PRE software not only exports the indices above, but also exports system probabilistic risk indices.
III. RISK INDICES
When PSD-PRE evaluate bulk power system probabilistic security, risk indices are as shown in 1-13, where 1-6 are basic indices which describe the system probabilistic security level;7-10 are dynamic load curtail indices.
For a system containing J elements, M kind of load scenarios, the probabilistic index of system lose of transient stability (LOTS) is
P
LOTS:LOTS US
P pk
k = ∑
∈ (1)
where USis set of system lose transient stability,
P
kis the probability of system in scenarios k..If faults 1-6 occur, the probability index of loss of system transient stability is “(2)”:
0
1 1 1
k M m J I
m j i
s
P p pj pji F
= = =
= ∑ ∑ ∑ × × (2)
where
k
=
1, 2...6
;p
m0 is the probability of scenarios m in all scenario; I is the number of total fault type;p
jiis the probability of fault i occurs at element j;F
is the value of the system testing function which value is 1 as system lose transient stability, else is 0:p
jis the normal operation probability of element j;p
sjis the probability of system state as element j fault which can be calculated aspsj =∏p1×p2× × −... (1 pj) ...× ×pJ ;
If fault 7 occurs, the probability index of loss of system transient stability is “(3)”:
0 7
1 1 1
M m J I
m j i
s
P p prf pj pji F
= = =
= ∑ ∑ ∑ × × × (3)
where prf is the probability of line protection equipment unwanted operation;
If fault 8 occurs, the probability index of loss of system transient stability is “(4)”:
0 8
1 1 1
M J I
s
m cr j ji
m j i
P p p p p F
= = =
=
∑ ∑∑
× × × (4)where pcris the probability of breaker failure to operate; If occur fault 9, the probability index of loss of system transient stability is “(5)”:
0 9
1 1 1
M J I
s
m bdrpr j ji
m j i
P p p p p F
= = =
=
∑ ∑∑
× × × (5)where
p
bdrpr is the probability of bus breaker failure to operate;The probability index of loss of system transient stability with double elements fault is “(6)”:
1
0
1 1 M
k m
J I s
P pm pj pji F
j i
=
= ∑ ∑ ∑ × ×
= = (6)
where k=10,11,
p
sj is the probability index of system state with double elements fault..[12], the risk index based on fault enumeration method can be described by “(7)”:
Risk X( f) P Er( i) Sev E X( i, f)
i
=∑ ⋅ (7) where P Er( i)is the happening probability of each system
state
X
i∈
Ω
, Sev E X( i, f) is the index function obtained by calculation, and it denotes the reliability index like probability, power or time.Security risk indices are divided into node indices and system indices. For fault i occur at element j in the scenario m, nelements need to curtail load.
Then node indices are shown as follows:
Probability of Node Dynamic Load Curtailments (PNDLC):
0 PNDLC
J s
Px Pj pji Fx
j
= ∑ × ×
= (8)
where x=1, 2, ...n;Fxis the node testing function which value is 1 when element xneeds to curtail load, else is 0;
Node Expected Power Not Supplied (NEPNS):
0
/ J
NEPNS PNDLC
j
s
Px Pj pji Fx pj Px
=
= ∑ × × × Δ (9)
Expected Energy of Node Not Supplied (EENNS):
0
/ EENNS NEDLC
J
PNDLC j
Px Px Tj
s
Pj pji Fx pj Tj Px
=
= × Δ
= ∑ × × × Δ × Δ (10)
where
Δ
T
j is the repair time of element j.System indices can get according to node indices: Probability of Dynamic Load Curtailments (PDLC):
0 PDLC
J s
P Pj pji Fj
j
= ∑ × ×
= (11) where
F
jis the system testing function which value is 1 when system exists curtailing load under the condition of element j fault, else is 0.Expected Dynamic Power Not Supplied (EDPNS):
0
/
N
EPNS NEPNS PDLC x
P px P
=
= ∑ (12)
Expected Dynamic Energy Not Supplied (EDENS);
0
/ EENS N EENNS PDLC
x
P px P
=
= ∑ (13)
IV. THEORY OF EVALUATE PROBABILISTIC SECURITY
CONSIDERING BUS ARRANGEMENT
On the single-line diagram of bulk power system, station and substation are usually described by single bus. But the actual bus arrangement is very complex. The single-line diagram and detailed bus arrangement for bus-bar 1 of IEEE-RTS79 are as shown in Fig.5.
a single-line diagram b detailed bus arrangement
Fig.5 diagrammatic sketch for bus-bar of IEEE-RTS79
Seen from Fig.5, diversity between them is obvious. It is not appropriate to use one single bus-bar denoting the detailed bus arrangement. There are two reasons: equivalent bus-bar is very easy confused with the actual bus-bar; different bus arrangements have different influence on system stability.
Seen from three representative bus arrangement structures in Fig.6, internal elements (major as circuit breaker and bus) fault causes different feeder outage. For single bus-bar structure, all feeders connect on bus-bar. If this bus-bar faults, all feeders will be outage. Probability of power plant blackout is very great. So the probability index of loss of system transient stability must include the probability index of this fault.
For double bus-bar or single bus-bar subsection, part feeders connect on one bus-bar and others connect on the other bus-bar. Like single bus-bar structure, outage probability of feeders connected on same section is much great, but outage probability of feeders connected on different section is very small. For 3/2 arrangement, the situation is completely different. If circuit breaker and protection system operate naturally, bus-bar fault will cause no feeder outage. For example, bus-bar W1 fault, all feeders can operate through bus-bar W2. For power transmission line short-circuit fault, one side switch failure to operate or short-circuit fault of bus, bus differential protection failure to operate, the same fault cause different result under different bus arrangement. For example, on 3/2 arrangement, line F5 short-circuit fault, one side switch failure to operate;if switch QF1 fails to operate and QF2 is tripped off successfully, line F1 can still operate through bus-bar W2; if switch QF2 fail to operate, then switch QF1 and QF3 need to trip off, line F1 can’t operate.
F2 F3
1
F1 F4 F1 F2
2
F3 F4
3
F1 F2 F3 F4
QF1
QF2
QF3 W1
W2
F5
Fig.6 diagrammatic sketch of typical bus arrangement
Theory of evaluating probabilistic security considering bus arrangement is as shown below.
When short-circuit fault occur on bus-bar, the bus-bar arrangement is considered to analysis outage result and get probabilistic risk indices. As PSD-PRE achieves calling of PSD-BPA power flow and transient stability program,
evaluating probabilistic security for bulk power system can be realized by following steps. First, modify power flow data *.DAT file. According to actual bus arrangement, separate corresponding bus-bar node into two or more new nodes which connect by little switch lines; then, connect the feeders to the right bus node. At last, modify transient stability data file. The old node of *.SWI file must be replace by the corresponding new node as define in *.DAT file.
V. CASE STUDY
A. Test system
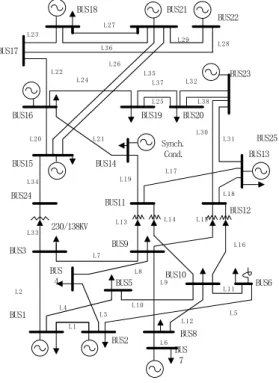
The single line diagram of IEEE-RTS 79 is as shown in Fig.7. It has 24 nodes, 34 lines, 32 generators. The total system load is 2850 MW and the installed generation capacity is 3405 MW. The bus arrangement are all most 3/2 arrangement or polygon arrangement, so bus fault will cause no feeder outage.
B②S17
B②S18 B②S21
B②S22
B②S23
B②S20 B②S19 B②S16
B②S15 B②S14 B②S13
B②S24
B②S11
B②S12
B②S3 B②S9
B②S10
B②S8
B②S 7 B②S2
B②S1 B②S
4 B②S5 B②S6
Synch. Cond.
230/138K③
B②S25
L 1 L2
L 3 L 4
L 5
L 6 L 7
L 8 L 9
L 1 0
L 1 1
L 1 2 L 1 3 L1 4 L 1 5
L 1 6 L 1 7
L 1 8 L 1 9
L 2 0 L 2 1 L 2 2 L 2 3
L 2 4
L 2 5 L 26 L 2 7
L 2 8 L 2 9
L 3 0 L 3 1 L 3 2
L 3 3 L 3 4
L 3 5 L 3 6
L 3 7
L 3 8
Fig.4 IEEE-RTS diagram
B. Basic Data for Probabilistic Security Evaluation
The basic data for probabilistic security evaluation are as shown in Tables I-III.
TABLE I
THE AVERAGE VALUE OF DIFFERENT FAULT TYPES OVER THE COUNTRY DURING 2000-2004
Fault types Proportion (%)
Single phase to ground short-circuit 88.94 Two-phase to ground short-circuit 4.348
Phase to phase short-circuit 2.986
Three-phase short-circuit 1.038
Open circuit 0.876
Others 1.808
TABLE II
THE AVERAGE VALUE OF PROBABILISTIC INDICES IN NATIONAL-WIDE 220KV
COMPONENT DURING 2000-2004
Lines Success rate of reclosing (%) 77.07
Bus-bar protection failure to operate (%) 2.7
Relay protection device Incorrect operation rate (%) 0.868
TABLE III
TRANSMISSION LINE RELIABILITY DATA OF IEEE RTS 79
line Failure rate (occs./year)
repair time/h line
Failure rate (occs./year)
repair time/h
1-2 0.24 16 11-13 0.4 11
1-3 0.51 10 11-14 0.39 11
1-5 0.33 10 12-13 0.4 11
2-4 0.39 10 12-23 0.52 11
2-6 0.48 10 13-23 0.49 11
3-9 0.38 10 14-16 0.38 11
3-24 0.02 768 15-16 0.33 11
4-9 0.36 10 15-21 0.41 11
5-10 0.34 10 15-24 0.41 11
6-10 0.33 35 16-17 0.35 11
7-8 0.3 10 16-19 0.34 11
8-9 0.44 10 17-18 0.32 11
8-10 0.44 10 17-22 0.54 11
9-11 0.02 768 18-21 0.35 11
9-12 0.02 768 19-20 0.38 11
10-11 0.02 768 20-23 0.34 11
10-12 0.02 768 21-22 0.45 11
C. Results Analysis
With PSD-PRE software, 24 short-circuit on bus-bar and 24 short-circuit fault of bus, bus differential protection failure to operate, 29 line three-phase short-circuit failure, single-phase protection equipment unwanted operation, 29 line short-circuit fault, one side switch failure to operate etc. 576 fault patterns have been calculated. Following with the application of accelerating method used in PSD-PRE, total calculation quantity has reduced by 69.2% as probabilistic security evaluation decreased 1297 times. At the same time, evaluating one system probabilistic security artificially is larger than 90 seconds, but PRE takes no more than 30 seconds. Thus calculation time is greatly reduced and efficiency is greatly enhanced by PSD-PRE software.
According to above fault result and risk assessment algorithm, the probabilistic indices with and without considering bus arrangement of IEEE RTS 79 are as shown in Table IV and the node indices are as shown in Tables V-VI.
TABLE IV
SYSTEM PROBABILITIC INDICES OF IEEE RTS 79
System risk indices
Without considering bus arrangement
Considering bus arrangement
Error proportion (%)
LOTS 0.0000583 0.000041 42.2
PDLC 0.0001682 0.0001659 1.37
EDPNS 403.8885Mw 403.0493Mw 0.21
TABLE V
NODE PROBABILISTIC INDICES OF IEEE RTS79WITHOUT CONSIDERING BUS ARRANGEMENT
Node EENNS(Mwh) NEDLC(Mw) PNDLC
10 568.2453 32.89478 8.017538E-05
18 542.55 48.69321 6.720671E-05
15 502.1865 44.39969 8.535032E-05
13 399.5125 34.52377 4.776947E-05
8 393.6066 25.13773 9.464344E-05
9 389.318 26.31327 1.251057E-04
6 380.533 19.94648 8.754858E-05
14 323.2038 28.3544 1.085765E-04
3 321.331 24.49608 1.362187E-04
7 307.29 30.23307 1.522992E-05
19 264.4091 23.46406 1.210885E-04
2 238.6546 12.98052 5.149069E-05
5 189.1355 10.46227 8.105940E-05
20 188.8235 16.76508 8.915811E-05
4 170.5551 10.8653 1.014419E-04
16 161.5939 14.35877 1.092920E-04
TABLE VI
NODE PROBABILITIC INDICES OF IEEE RTS 79 CONSIDERING BUS ARRANGEMENT
node EENNS(Mwh) NEDLC(Mw) PNDLC
10 566.2712 32.83795 8.130786E-05
18 545.803 48.70604 6.799459E-05
15 504.591 44.42944 8.616417E-05
13 399.0499 34.52223 4.827312E-05
8 391.1227 25.0814 9.577592E-05
9 389.1003 26.30349 1.265312E-04
6 353.347 19.38625 8.560751E-05
14 327.9944 28.24737 1.106674E-04
3 327.9638 24.51844 1.376443E-04
7 306.984 30.18935 1.528812E-05
19 269.6927 23.47363 1.220670E-04
2 240.9563 12.98208 5.205131E-05
20 188.0269 16.75137 9.011065E-05
5 188.393 10.43071 8.128711E-05
4 169.9734 10.8437 1.017783E-04
16 160.0188 14.34587 1.104017E-04
Seen from Table IV, indices of system lose transient stability changes very much as considering bus arrangement. It is means that traditional probabilistic security model without considering bus arrangement is not accurate, especially when evaluate system probabilistic stability. Seen from Tables IV-VI, dynamic load curtailment indices changes very little because statistical load curtailment only under scenario of system stability which quantity is very large. So the risk indices show that PSD-PRE can makes the probabilistic security evaluation results more accurate.
VI.
CONCLUSIONNew probabilistic security evaluation software named PSD-PRE is developed. It achieves the probabilistic security evaluation for bulk power system considering bus arrangement. This makes calculating results more accurate. Accelerating algorithm is adopted to alleviate the calculation burden of PSD-PRE. Simulation results show that PSD-PRE is valid and available for bulk power system considering bus arrangement and indices can be used as the basis of transmission network planning.
ACKNOWLEDGMENT
Hailei he is grateful to her advisor, Prof. Jianbo Go, not only for his valuable guidance and advices, but also for providing her with inspiration and support. Hailei he would like to express her gratitude to Dr. Yunting Song and Dr. Dongxia Zhang for them help during the past two years.
REFERENCES
[1] Wang meiyi, Wu jingchang, Meng dingzhong. Bulk power system technology. Beijing: Water Conservancy and Electric Power Publishers, 1991.
[2] Billinton R, Kuruganty P R S. “A probabilistic index for transient stability”, in Proc. 1978 IEEE PES Winter Meeting, pp. 231~233. [3] Ju Ping, Ma Daqiang. “Probabilistic analysis of power system stability”,
automation of electric power systems, Vol.3, pp:18-23, Apr.1990. [4] Billinton R, Allan R N. Reliability assessment of large electric power
systems, Boston: Kluwer Academic Publishers, 1988.
[5] A.C.G.Melo, G.C.Oliveira, M.Morosowski M.V.F.Pereira. “A hybrid algorithm for Monte carlo/enumeration based composite reliability evaluation”, in Proc. 1991 IEEE Summer Power Meeting, pp:70 - 74 [6] R.Caglar, A.ozdemir. “Composite electric power system adequacy
evaluation via transmission losses based contingency selection algorithm”, in Proc. 1999 IEEE Summer Power Meeting, pp: 84. [7] M.E.Khan. “Bulk load points reliability evaluation using a security
based model”, IEEE Trans. On Power System, Vol.13, pp:456~463 May.1998.
[8] S.Nikolovski, B.Stefic. “State enumeration approach in reliability assessment of the eastern Croatia bulk power system”, in Proc.1999 IEEE Summer Power Meeting, pp:138
[9] Lu Zongxiang, Guo Yongji. “Study on basic framework of probabilistic security evaluation of composite generation and transmission systems”, Power System Technology, Vol.28, pp:19-22, Apr.2004.
[10] Ding Min. “A survey of composite generation and transmission reliability analysis software package”, Power System Technology, Vol.1, pp: 51-54, Jun.2002.
[11] Guo Yongji. Power system reliability analysis. Beijing: Tsinghua university press, 2001.
[12] Ming Ni, McCalley J D,Vittal V et al. “Online risk-based security assessment”. IEEE Trans on Power Systems, 2003, 18(1):258-265.
[13] Shi Hui-jie, Ge Fei, Ding Ming. “Research on on-line assessment of transmission network operation risk”, Power System Technology, Vol.29, pp:43-49, Mar.2005.
[14] Zhang Bao-hu, Wang Li-yong etc. “Research of power system security and reliability considering risk under environment of electricity market”, Power System Technology, Vol.29, pp:44 -50, Feb.2005. [15] Wenyuan Li. Risk assessment of power systems. Beijing: Science