A DPSIR Model for Ecological Security
Assessment through Indicator Screening: A
Case Study at Dianchi Lake in China
Zhen Wang1,2*, Jingqing Zhou1, Hugo Loaiciga2, Huaicheng Guo3, Song Hong1
1School of Resource and Environmental Sciences, Wuhan University, Wuhan, Hubei, China,2Department of Geography, University of California Santa Barbara, Santa Barbara, California, United States of America, 3College of Environmental Science and Engineering, Peking University, Beijing, China
Abstract
Given the important role of lake ecosystems in social and economic development, and the current severe environmental degradation in China, a systematic diagnosis of the ecological security of lakes is essential for sustainable development. A Driving-force, Pressure, Status, Impact, and Risk (DPSIR) model, combined with data screening for lake ecological security assessment was developed to overcome the disadvantages of data selection in existing assessment methods. Correlation and principal component analysis were used to select independent and representative data. The DPSIR model was then applied to evaluate the ecological security of Dianchi Lake in China during 1988-2007 using an ecological security index. The results revealed a V-shaped trend. The application of the DPSIR model with data screening provided useful information regarding the status of the lake’s ecosystem, while ensuring information efficiency and eliminating multicollinearity. The modeling approach described here is practical and operationally efficient, and provides an attractive alternative approach to assess the ecological security of lakes.
Introduction
Many lakes and reservoirs in China have suffered severe eutrophication in recent decades. A national monitoring database revealed that eutrophication occurred in 41% of all major lakes in the 1980s, and 77% in the 1990s [1]. A national survey that started in 2006 indicated that 85% of the lakes with a surface area larger than 10 km2were eutrophicated at different levels of severity [2]. Eutrophication causes the degradation of aquatic ecosystems, with frequent algal blooms, which endanger water supplies and fisheries in the impacted lakes. The public and sci-entists have combined to appeal for a safer and healthier water-quality environment in lakes throughout China. This prompted the Ministry of Environmental Protection of China (MEP) to launch a nationwide project in 2008, the Ecological Security Assessment for Lakes and Res-ervoirs (ESAL). ESAL uses“ecological security”as the core concept to address the relationships between lakes/reservoirs and social and economic sectors as ecosystems. ESAL’s purpose was OPEN ACCESS
Citation:Wang Z, Zhou J, Loaiciga H, Guo H, Hong S (2015) A DPSIR Model for Ecological Security Assessment through Indicator Screening: A Case Study at Dianchi Lake in China. PLoS ONE 10(6): e0131732. doi:10.1371/journal.pone.0131732
Editor:Jian Liu, Shandong University, CHINA
Received:October 23, 2014
Accepted:June 4, 2015
Published:June 24, 2015
Copyright:© 2015 Wang et al. This is an open access article distributed under the terms of the Creative Commons Attribution License, which permits unrestricted use, distribution, and reproduction in any medium, provided the original author and source are credited.
Data Availability Statement:All data are uploaded to Figshare. DOI:http://dx.doi.org/10.6084/m9. figshare.1444497.
to obtain a better understanding of the past and current status of lakes and the stresses imposed on them by human activities. Dianchi Lake was one of the pilot lakes selected by ESAL to estab-lish an analytical framework that could be expanded to other key lake assessments.
The goal of ecological security is to conserve ecosystems in an unthreatened state while still experiencing human activity, and to provide the necessary resources to maintain their health and ability to adapt to environmental changes [3–7]. Current ecological assessments of lakes and reservoirs rely primarily on an index-based assessment approach [4,8,9] or the ecological footprint approach [10]. In most cases, the indicators selected for index evaluation of lake and reservoir ecosystems are critical to the success of conservation programs. The judicious selec-tion of indicators increases the scientific credibility of ecological assessments [11]. In current practice, indicators for ecological assessments are often selected based either on historical prac-tice or on the judgment of experts [12], which may bias the assessment results due to data mul-ticollinearity (i.e., statistical redundancy) or the duplicitous use of information. We propose an integration of the ecological security assessment with a statistical indicator selection procedure that measures the inter-relation of ecological indicators as part of the indicator selection process.
The first part of this paper presents a brief introduction of the ESAL assessment framework for Dianchi Lake, followed by a description of the indicator selection process. The second part demonstrates the merits of the proposed model for lake ecosystem assessment using a case study of its implementation in the Dianchi Lake watershed.
Ecological security assessment model
2.1 DPSIR framework for ecological security
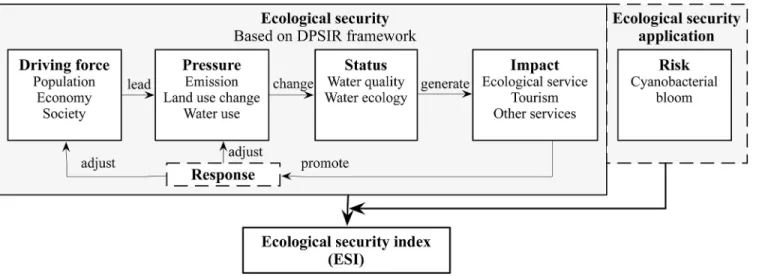
The concept of ecological security emphasizes the sustainability of ecosystems, focusing on reducing the probability or risk of ecological disaster caused by human-induced stresses [13]. In the specific case of Dianchi Lake, it is essential to investigate the lake itself and the surround-ing social and economic sectors, which are often the drivsurround-ing forces behind ecological degrada-tion [12]. As seen inFig 1, a change in a lake’s ecological health, driven by anthropogenic activities, generates benefits or losses of ecological services. One task of ESAL was to identify the dynamic links that exist between a lake ecosystem and its surrounding social and economic
Fig 1. Conceptual model and evaluation method of ecological security assessment.
doi:10.1371/journal.pone.0131732.g001
sectors. In this study we introduced disaster evaluation as part of the ecological security assess-ment of lakes. The DPSIR indicators are as follows:
Driving-force(D) indicators describe the social and economic developments in the
commu-nities surrounding the lake as well as the corresponding changes in lifestyle, consumption, and production patterns. These indicators include the regional population, population density, gross domestic production, per capita income, Gini coefficient, and other factors that directly or indirectly influence lake ecosystems and water quality.
Pressure(P) indicators measure the impacts that human activities exert on a lake, especially
on its water quality and quantity. With regard to water quality, pollutant emissions are the main stressor. Thus, various sources of pollutants should be considered. Conflicts between human and aquatic functions often occur in water-deficient areas [14]. Therefore, the total water-resource utilization, water-quantity ratio of inputs and outputs in a lake, per capita water-resource use, and ecological water demand and related data should be included in any index of a lake’s ecological evaluation.
Status(S) indicators reflect the ecological health and include water quality and water
eco-logical factors. Water quality indicators can be obtained from conventional water monitoring. The water-ecology indicators reveal both the community and system status. The phytoplank-ton biomass (Bp), zooplankton biomass (Bz), large zooplankton biomass (Bmacroz), small
zoo-plankton biomass (Bmicroz), ratio of zooplankton and phytoplankton biomass (Bz/Bp), and ratio
of large zooplankton and small zooplankton biomass (Bmacroz/Bmicroz) are community
ecologi-cal indicators. Energy quality (Ex) and energy quality structure (Exst) are used to evaluate a
sys-tem’s ecological status [8,15].
Impact(I) indicators represent the variation in lake services (e.g., fishery output and
tour-ism) caused by a lake’s change of status.
Risk(R) indicators are used to express the chance of the occurrence of an ecological disaster. In eutrophic lakes, the major risk is an algal outbreak, with consequent health hazards to humans and ecological hazards to organisms. The indicators are bloom duration, time, area, and the population or biomass affected through drinking water or exposure to the bloom.
In Dianchi Lake, nutrient concentrations have largely surpassed the commonly accepted threshold that triggers a cyanobacterial bloom [16,17], and weather conditions are the key fac-tor that influences the occurrence of a bloom [18]. Formula (1) can be used to quantify the risk of a cyanobacterial bloom:
xi;r¼1
ni nTi
ni
ni nTPi
ni
ni nTNi
ni
ð1Þ
wherexi,ris the risk of a cyanobacterial bloom in theithyear, which is used as the indicator
var-iable for the risk component (R) in the DPSIR model;niis the number of all data entries in the
ithyear;nTiis the number of data entries in theithyear with temperature below the lowest
tem-perature recorded when cyanobacterial blooms occur; andnPiandnNidenote the number of
data entries in theithyear with total phosphorous (TP) and total nitrogen (TN) concentrations, respectively, below the lowest concentration observed when cyanobacterial blooms occur. The riskxi,rin Eq (1) varies between 0 and 1.
2.2 Data screening
◆ 1. Relevancy: indicators should reflect changes in ecological quality, status, management, or other security domains.
◆ 2. Availability: the indicator data should be available, accessible, and consistent within the period of analysis.
◆ 3. Independence: indicators must be independent of each other to eliminate multicolli-nearity (statistical redundancy or duplicity).
◆ 4. Representativeness: each indicator used in the model must represent a category or phe-nomenon of its own, and must provide superior information to other indicators in a simi-lar category.
Criteria 1 and 2 can be easily achieved by searching every available database for their period of applicability and their information content. A correlation test can be used to evaluate the independence of data sets. If a significant correlation is identified among indicators, multicolli-nearity may arise in the ecological assessment model, which would affect the accuracy of the ecological security index. Data multicollinearity is common among socio-economic indicators. When such statistical redundancy occurs, one or a few indicators with the highest information content should be selected from among the correlated indicators. A principal component anal-ysis (PCA) is helpful for selecting the most significant ecological indicators. The field studies were carried out in the monitoring stations controlled or supervised by Kunming Environmen-tal Monitoring Center. Kunming EnvironmenEnvironmen-tal Monitoring Center has all authority to permit our access to the data of Dianchi Lake.Detailed data screening process as well as an example was given inS1 Text.
2.3 Ecological security index
The ecological security index (ESI) is herein proposed to evaluate a lake’s deviation from a background condition (the monitoring data for 1988 was chosen as the background condition in this work). To calculate the ESI, the data are first standardized using Eqs2and3to trans-form the DPSIR data into“the-higher-the-better”numbers by normalization as follows:
x0i;j¼
xi;j
x1988;j
ð2Þ
when the indicatorxijhas a value reflecting improved conditions relative to the 1998 baseline
value (x1998,j); and:
x0i;j¼
x1988;j
xi;j
ð3Þ
when the indicatorxijhas a value reflecting a worsening condition relative to the 1998 baseline
value. In Eqs (2) and (3),idenotes the year andjdenotes the ecological indicators. The normal-ized variablesx0ijdefined by Eqs (2) and (3) lead to DPSIR index values and an ecological
secu-rity index (ESI), in which a rising (declining) magnitude reveal an improving (worsening) condition, thus“the-higher-the-better”numbers appellative are used to characterize them.
The index of each DPSIR component is calculated with the following averaging formula:
Indexk;i¼
Y
j2k ðx0i;jÞ
wk;j ð4Þ
of thek-th component. For example, the weighting for a componentkwith 3 indicators is (1/3, 1/3, 1/3) andIndexk;i ¼
Y
j2k ðx0i;jÞ
1=3 .
The ESI for thei-th year is calculated using the following averaging formula:
ESIi ¼
Y
k
ðIndexk;iÞ
wk ð5Þ
whereESIirepresents the ecological security index ofi-th year.wkis the weighting for thefive
DPSIR components, that is (wk= 1/5, 1/5, 1/5, 1/5, 1/5, fork= 1, 2, 3, 4, 5, respectively).
Case study: application to an assessment of Dianchi Lake
3.1 Background of Dianchi Lake
Dianchi Lake is located within the City of Kunming, the capital of Yunnan province, at an alti-tude of 1887.4 m (Fig 2). It is the sixth largest lake in China, with a water surface area of 292 km2, extending from 24º280to 25º280N and 102º300to 103º000E. Rapid urbanization and indus-trialization in Kunming since the 1980s have resulted in increased pollution discharges into Dianchi Lake. As a result, both the water quality and ecosystem health have deteriorated dra-matically. The area covered with aquatic plants was approximately 20% of Dianchi Lake surface in the 1970s [19]. By the late 1990s only 1.8% of the water area was covered by aquatic plants [20]. Over the last 30 years, 29 species of aquatic plants and 21 species of indigenous fishes went extinct in the lake. Meanwhile, cyanobacteria, specificallyMicrocystis aeruginosa, became the dominant algae, and has bloomed throughout the year after 1998 [18]. Dianchi Lake gradu-ally lost its ecological service functions for drinking water supply, fisheries, and irrigation. The ESAL project’s objective for Dianchi Lake was to evaluate its current status and aid decision making in the“12thfive year national environmental plan”as well as in the“Dianchi Water-shed Planning Project”.
3.2 Data screening in the Dianchi Lake watershed
Data were obtained from the local bureau of statistics, environmental monitoring stations, and fisheries authorities. Data that did not cover the period from 1988 to 2007 were excluded. The data screening process is shown inFig 3. The numbers inFig 3denote the correlation between indicators and relevant indicators.
Driving (D) factors, such as population growth and economic development, were strongly correlated in the past 20 years. The PCA indicated that one indicator provided enough infor-mation asFig 3showed. Population growth explained the rapid urbanization and industrializa-tion in the Dianchi Lake watershed [21], whereas economic activity did not explain the population increase. Thus, population was selected as the sole driving factor.
The area of construction land, emission of TP, and chemical oxygen demand (COD) from industrial sources were selected as the pressure (P) indicators. The area of construction land has expanded substantially to fulfill the residential and industrial building needs. The emission of TP was due to industry and agriculture. More recently, industrially derived TP has been reduced to become a minor source of pollution. Agricultural sources of TP are more difficult to control, and have become the most harmful regular pollutant of aquatic ecosystems in the study area. Most COD from industrial sectors was emitted into the Caohai area, causing foul odors and the mass death of fish. These three indicators (construction area, TP, and COD) con-stitute three pressure pathways from the increasing population on the lake’s ecosystem.
of the TP concentration to Chlorophylla(Chl-a) = 0.75). The TN concentration was used as the status indicator instead of COD because it had a more important role in phytoplankton growth. DO is vital to aquatic organisms. When cyanobacterial blooms occur, DO may drop dramatically, leading to the suffocation of aerobic aquatic species, especially fishes.
Fish production and per capita tourism income were chosen as the impact (I) indicators, without screening, due to the lack of consistent data for evaluation. Ecological degradation, especially cyanobacterial blooms, leads to a reduction in fishery production. Foul odor, death of fishes, and other problems caused by pollution also reduce the economic output from tour-ism at Dianchi Lake. The cyanobacteria bloom index (formula 1) was used as the risk
indicator.
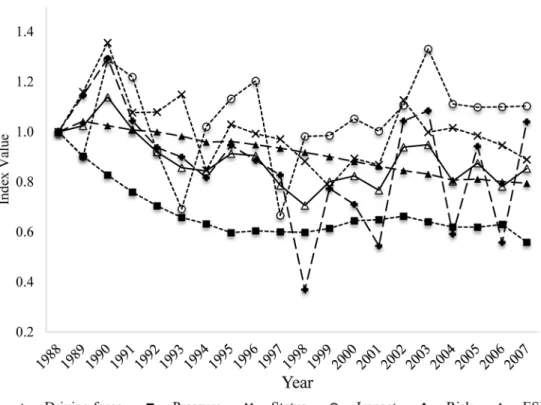
3.3 The ESI index
The calculated ESI and the indices of the components of the DPSIR model are shown inFig 4. The ESI indicates that Dianchi Lake exhibited a fluctuant V-shaped ecological security trend. In the period 1988–1998, the ESI declined and reached the lowest value (0.7061) in 1998. In the following decade, the ESI increased slightly, exhibiting erratic fluctuations. The driving-force indicator declined steadily over the period of analysis (1988–2007) and reached its lowest value (0.7947) in 2007. The pressure indicator had low values in the period around 1995–1998 and in 2007, as shown inFig 4. Industrial COD emissions, nutrient loading to Dianchi Lake and the area of construction land together shaped the pressure indicator. The local government started to cut down on industrial COD emissions in preparation for the International Garden Festival (IGF) in 1999. Industrial COD emissions were identified as the main reason for the foul odor and scenic degradation in Caohai at that time. Four wastewater treatment plants were built and came into operation in 1995, 1997, 2002, and 2005. Therefore, industrial COD emission started
Fig 2. Location of Dianchi Lake.
to decline in 1996, asFig 5shows. In contrast, the sources of agricultural pollution did not receive sufficient attention. The flower-planting area in Kunming expanded rapidly after 1995 due to the rising market prices of flowers. The flower-planted area increased from 567 hm2in 1996 to 6900 hm2in 2007. Simultaneously, the application of fertilizer used for flower growing reached 567 kghm-2yr-1, i.e., three times the level used in wheat fields. As a result, the nutrient loading to Dianchi Lake increased. The area of construction land also increased to meet resi-dential, commercial, and industrial needs. Combining the favorable changes in COD emissions with the worsening nutrient loading and changes in land cover, the pressure index experienced
Fig 3. Data screening of Dianchi Lake ecological security assessment.(*Correlation is significant at 0.01 level (P = 0.01);**Correlation is significant at 0.05 level (P = 0.05)).
a slight favorable turn around 1995–1998, but declined slightly during 2002–2007. The status, impact, and risk indexes displayed similar patterns to the ESI, with the lowest indicator values in 1997–1999. There are several reasons for this. (1) The TP concentration increased dramati-cally from 1997 to 1999 (seeFig 6). This was identified as the main reason for cyanobacterial
Fig 4. Ecological security index and DPSIR indices of Dianchi Lake.
doi:10.1371/journal.pone.0131732.g004
Fig 5. COD emission by industry during 1988–2007.
blooms at that time. Emerging environmental protection measures, including a new industrial wastewater treatment plant and dredging in Caohai, were implemented before the IGF opened in 1999. Other long term polices for environmental protection were initiated at about the same time. As a result, the TP concentration began to fall after 1999. (2) There were two impact indi-cators: fish production reached its lowest outcome at 1997, and per capita tourist income reached its point of inflexion in 1999 (seeFig 7). Noticeably, per capita tourist income started to decline after 1999 in Dianchi Lake’s scenic area due to the impact of the frequent cyanobac-terial blooms on recreational activities. (3) The risk index reached its worst level in 1998 (see Fig 4: a lower risk index value indicates a worsening condition, as implied by Eqs (2) and (3)). Compared to the seasonal events during April to November in previous years, 1998 was the first year when cyanobacterial blooms occurred year round. The variability of the DPSIR
Fig 6. TP concentration in Dianchi Lake.
doi:10.1371/journal.pone.0131732.g006
Fig 7. Fish production and per capita tourism income in the Dianchi Lake watershed.
components increased over time, which reflects the influence of human activities on ecological security through complex biochemical cycles.
3.4 Discussion
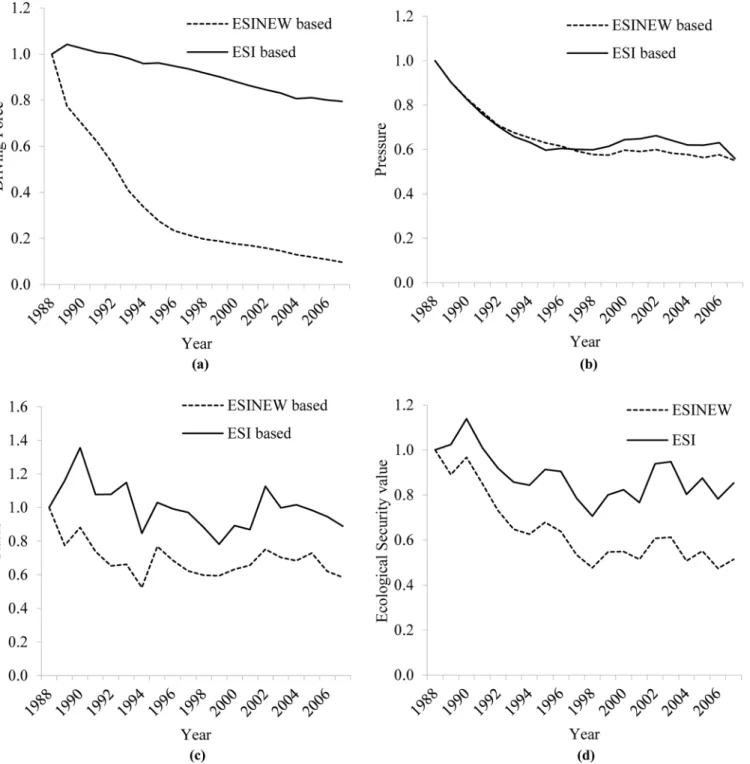
Data screening is essential to exclude redundant information and to determine the accuracy of ecological assessments. To demonstrate this assertion, the ESI was calculated without data screening (herein called the ESINEW), and was obviously lower than the previous results, as depicted inFig 8. The key reason why the ESI performed better than the ESINEW was the mul-ticollinearity of the driving force factors in the latter index. The strong correlations among pop-ulation and economic indicators (correlation coefficient>0.95, p<0.05) provided redundant information, which undesirably enhanced the decreasing trend into steeper curves for the indi-cator shown inFig 8. Data screening was useful to produce“unbiased”information with less data, i.e., similar trends in the driving force (Fig 8A), pressure (Fig 8B), status (Fig 8C) and eco-logical security (Fig 8D) indexes had R2= 0.79, 0.90, 0.71, and 0.86, respectively (linear regres-sion coefficient of determination, excluding 1988.). In brief, data screening in an ESI will eliminate the interference of excessive information, and assist in the diagnosis of various prob-lems. It is clear that rapid urbanization caused a population increase in the watershed area, as well as the need for land and economic activity, and this was the motive power for deterioration of the lake environment. Therefore, in addition to routine end-of-pipe treatments and lake water quality management, long-term strategic population control/evacuation from the upstream of Dianchi Lake, as opposed to the current plans for a large population expansion, will be important [21]. In addition, land use control and policies to promote an adjustment of industrial structure should also be implemented alongside the existing lake management policies.
To eliminate just the redundant information, using the principal components as indicators might be a better alternative. It can transform the original data into uncorrelated components and use them to calculate the ESI, but it has a disadvantage in that sometimes it is difficult to explain the realistic meaning of the components. Compared our work with others’findings in Diachi watershed, we had a longer monitor (1988–2007) than the literature [22] (1999–2007). And very similar trends were found during 1999–2007, although different indicators between our work and [22] were integrated into the DPSIR framework. Due to lack of research on eco-logical security in this area, we compared the results with an ecoeco-logical health index study from [23], because the ecological health and ecological security is somewhat correlated. [23] had dif-ferent evaluation technology and used difdif-ferent indicators from 1998–2001. But same decease trend of the indexes were found. These comparisons indicated that our model results were as accurate as other studies. Other ecological security or ecological health index focused on the spatial difference of Dianchi Lake, lacking long time series [24]. Compared to the literature regarding data screening [8,11], our data screening process was an executable method to select indicators for assessing socio-economic threats and the current status of the lake. Most indica-tors used in this model are easy to obtain, which extends the model’s range of applications.
method with a spatial approach to assess the spatial distribution and variety would be more useful for pinpoint management.
Fig 8. Evaluation of Driving force (a), Pressure (b), Status (c), Ecological security index (d) with and without data screening.(Notice that a lower value of an index implies a higher risk).
Conclusions
The ecological security of a lake requires an understanding of the integral health of the lake’s ecosystems, allowing the lake to consistently provide beneficial services and avoid ecological disasters caused by anthropogenic activities. Ecological security can be interpreted as a broadly defined sustainability, consisting of dynamic and beneficial cycles of human-environment interactions. To assess the variability of a lake’s ecological security requires large monitoring networks that track social, economic, and environmental-ecological components. Useful infor-mation can then be selected and utilized to derive unbiased ecological security indexes.
Eleven of thirty-two indicators were selected in the Dianchi watershed to assess the lakes ecological security status. Dianchi Lake experienced deterioration in 1988–1998 and a fluctuat-ing recovery in 1999–2007. Efforts to control emissions and water quality have mitigated the deterioration of Dianchi Lake, to which human activities had predominantly contributed. Cya-nobacterial blooms remain a high risk and continue to threaten Dianchi Lake. The application of the DPSIR model, combined with data screening, showed that it could eliminate the nefari-ous effect of data multicollinearity and provide useful information to assess the ecological secu-rity status of a lake. This work has produced a preliminary ecological secusecu-rity assessment for Dianchi Lake, China. Several associated studies are in progress: (1) the continuous monitoring of aquatic biological indicators; (2) the early warning of cyanobacterial blooms by building a more accurate risk evaluation model, considering weather conditions and aquatic biological indicators; and (3) an assessment of the ecological services affected by ecological degradation.
Supporting Information
S1 Text. Data screening process and example. (DOCX)
Author Contributions
Conceived and designed the experiments: ZW HG. Analyzed the data: ZW JZ. Contributed reagents/materials/analysis tools: HG SH. Wrote the paper: JZ ZW HL.
References
1. Ma JA, Li HQ. Preliminary discussion on eutrophication status of lakes, reservoirs and rivers in China and Overseas. Resources and Environment in the Yangtze Basin. 2002; 11: 575–578.
2. Yang G, Ma R, Zhang L, Jiang J, Yao S, Zhang M, et al. Lake status, major problems and protection strategy in China. Journal of Lake Sciences. 2010; 22: 799–810.
3. Hassani-Mahmooei B, Parris BW. Resource scarcity, effort allocation and environmental security: An agent-based theoretical approach. Econ Model. 2013; 30: 183–192.
4. Su S, Chen X, DeGloria SD, Wu J. Integrative fuzzy set pair model for land ecological security assess-ment: a case study of Xiaolangdi Reservoir Region, China. Stoch Environ Res Risk Assess. 2010; 24: 639–647.
5. Li Y, Sun X, Zhu X, Cao H. An early warning method of landscape ecological security in rapid urbaniz-ing coastal areas and its application in Xiamen, China. Ecol Modell. 2010; 221: 2251–2260. 6. Finnie B, Stuart J, Gibson L, Zabriskie F. Balancing environmental and industry sustainability: A case
study of the US gold mining industry. J Environ Manage. 2009; 90: 3690–3699. doi:10.1016/j. jenvman.2008.12.022PMID:19501452
7. Singh PK, Hiremath BN. Sustainable livelihood security index in a developing country: A tool for devel-opment planning. Ecol Indic. 2010; 10: 442–451.
9. Yu G, Zhang S, Yu Q, Fan Y, Zeng Q, Wu L, et al. Assessing ecological security at the watershed scale based on RS/GIS: a case study from the Hanjiang River Basin. Stoch Environ Res Risk Assess. 2014; 28: 307–318.
10. Wang H, Wang H, Sun H, Wang X, Liao X, Chen Z, et al. Assessment of the ecological security in the three gorges reservoir area by using the ecological footprint method. Journal of Mountain Science. 2012; 9: 891–900.
11. Niemeijer D, de Groot RS. A conceptual framework for selecting environmental indicator sets. Ecol Indic. 2008; 8: 14–25.
12. Heink U, Kowarik I. What are indicators? On the definition of indicators in ecology and environmental planning. Ecol Indic. 2010; 10: 584–593.
13. Jin XC, Wang SR, Xi HY. Lake ecological security and assessment methodology framework. Research of Environmental Sciences. 2012; 25: 357–362.
14. Hsu NS, Chiang CH, Cheng WM, Wei CC. Study on the Trade-Off between Ecological Base Flow and Optimized Water Supply. Water Resour Manag. 2012; 26: 3095–3112.
15. Ludovisi A. Energy degradation and ecosystem development: Theoretical framing, indicators definition and application to a test case study. Ecol Indic. 2012; 20: 204–212.
16. Kameyama K, Sugiura N, Lsoda H. Effect of nitrate and phosphate concentration on production of microcystins by Microcystis viridis NIES102. Aquat Ecosyst Health Manag. 2002; 5(4): 443–449. 17. Zhang W, Lin Y, Guo D, Fu J, Zhao Y. Influence of different nitrogen and phosphorus concentrations on
growth, photosynthesis and microcystin production of Microcysis Aeruginosa. Acta Hydrobiologica Sinica. 2006; 30: 318–322.
18. Liu Y, Wang Z, Guo H, Yu S, Sheng H. Modelling the effect of weather conditions on cyanobacterial bloom outbreaks in Lake Dianchi: a rough decision-adjusted logistic regression model. Environ Model Assess. 2013; 18: 199–207.
19. Drafting group of kunming water conservation annals. Water conservation annals of Dianchi Lake. Kunming: Yunnan People' s Publishing House; 1996.
20. Gong Z, Li Y, Shen J, Xie P. Diatom community succession in the recent history of a eutrophic Yunnan Plateau lake, Lake Dianchi, in subtropical China. Limnology. 2009; 10: 247–253.
21. Wang Z, Gao W, Cai Y, Guo H, Zhou F. Joint optimization of population pattern and end-of-pipe control under uncertainty for Lake Dianchi water-quality management. Fresen Environ Bull. 2012; 21: 3693– 3704.
22. Feng N, Mao F, Li X, Zhang A. Research on ecological security assessment of Dianchi Lake. Environ-mental Science. 2010; 31(2): 282–286.
23. Xu W, Xu S. Entropy weight comprehensive health index method for assessment of lake ecosystem health. Research of Soil and Water Conservation. 2008; 15(1): 125–127.