UNIVERSIDADE FEDERAL DE MINAS GERAIS
Curso de Pós-Graduação em Engenharia Metalúrgica e de Minas e Materiais
Tese de Doutorado
“Development of nano-sized Mn3O4 magnetic composites:
application in wastewater treatment”
Autora: Gabriela Cordeiro Silva
Orientadora: Professora Virgínia S. T. Ciminelli Co-orientador: Professora Angela de Mello Ferreira
UNIVERSIDADE FEDERAL DE MINAS GERAIS
Curso de Pós-Graduação em Engenharia Metalúrgica e de Minas e Materiais
Gabriela Cordeiro Silva
“Development of nano-sized Mn3O4 magnetic composites: application in wastewater
treatment”
Tese de Doutorado apresentada ao Curso de Pós-Graduação em Engenharia Metalúrgica e de Minas da Universidade Federal de Minas Gerais
Área de Concentração: Tecnologia Mineral Orientadora: Professora Virgínia S. T. Ciminelli Co-orientador: Professora Angela de Mello Ferreira
Belo Horizonte
iii
Agradecimentos
Durante o desenvolvimento deste trabalho pude contar com a ajuda e o apoio de diversas pessoas as quais gostaria de agradecer.
Agradeço primeiramente a Deus pelas oportunidades que apareceram no meu caminho.
À professora Virgínia, por ter me orientado, pelas sugestões e críticas, pela avaliação do meu trabalho e pelos recursos e infra-estrutura disponibilizados.
Ao professor Wolfgang Höll e a todos os pesquisadores com os quais tive contato no KIT por me recepcionarem tão bem e motivaram a linha de pesquisa dessa tese.
Ao grupo de pesquisa do Laboratório de Hidrometalurgia pela convivência harmoniosa do dia-a-dia. À Ilda pela disposição e alegria. À Sica pelo bom humor e ajuda nas análises de meus resultados. À Cláudia pela convivência agradável e disposição em ajudar. À Christina, tia Chris, pela gentileza e eficiência. Aos companheiros, Fernando, Júlio, Gra, Adélia, Daniel, Clauson, Carol, Douglas e Rodrigo, pelo convívio amigável, troca de experiência e momentos de descontração. Aos funcionários do Laboratório de Análises Químicas pela disponibilidade em me atender. Ao Roberto pela boa vontade em fazer as imagens de MEV de minhas amostras.
Ao grupo de pesquisa do CEFET-MG por terem me acolhido tão bem. À Ângela pelo apoio e pelas dicas importantes. À Fabi e à Nath pela ajuda indispensável no laboratório e convívio amigável. Ao Paulo pelo trabalho e aprendizado com o Rietveld e medidas de DRX, e convivência agradável.
iv
À Capes, ao INCT-Acqua, à Fapemig e ao CNPq pelo apoio financeiro e ao Laboratório Nacional de Luz Síncrotron e ao Centro de Microscopia pelo uso de suas instalações.
A todos os meus queridos amigos da graduação e às amigas de sempre, Caju, Sisa e Munique por ser uma fonte extra de energia.
À minha família que sempre me deu força e apoiou minhas decisões, em especial aos meus pais e a minha irmãzinha, que estão ao meu lado em todos os momentos, me aconselhando e incentivando.
v
Summary
CHAPTER 1. Introduction ... 01
1.1 Overview ... 01
1.2 Magnetic Composites ... 02
1.3 Manganese Oxides ... 05
1.4 Potential applications of magnetic manganese oxide composites ... 08
1.5 Characterization Techniques ... 10
1.6 Relevance and Objectives ... 16
1.7 Thesis Structure ... 17
CHAPTER 2. Synthesis of manganese oxide magnetic composites: Evaluation of different synthesis parameters ... 19
2.1 Introduction ... 19
2.2 Experimental ... 20
2.3 Results and Discussion ... 24
2.4 Conclusion ... 29
CHAPTER 3. Preparation and application of a magnetic composite (Mn3O4/Fe3O4) for removal of As(III) from aqueous solutions ... 31
3.1 Introduction ... 31
3.2 Experimental ... 32
3.3 Results and Discussion ... 36
3.4 Conclusion ... 47
CHAPTER 4. Raman and IR spectroscopic investigation of As-loaded Mn3O4 magnetic composites ... 49
4.1 Introduction ... 49
4.2 Experimental ... 50
vi
4.4 Conclusion ... 59
CHAPTER 5. Magnetic Mn3O4 Nanocomposites for Degradation of Methylene Blue ... 61
5.1 Introduction ... 61
5.2 Experimental ... 62
5.3 Results and Discussion ... 65
5.4 Conclusion ... 77
CHAPTER 6. Final Considerations... 79
6.1 Summary of results ... 79
6.2 Original contribution from this Thesis ... 80
6.3 Future Perspectives ... 81
REFERENCES. ... 82
vii
List of Figures
Fig. 1-1: Eh-pH diagrams of manganese species for (a) [MnT] = 10-5mol.L-1 and (b)
[MnT] = 10-3mol.L-1. The water stability field is shown for pO2=1.0atm and
pH2=1.0atm (HSC 6) (Appendix).. ... 07
Fig. 2-1: Schematic representation of the manganese oxide magnetic composites ………...20
Fig. 2-2: Eh-pH diagram (298K) constructed using the conditions of magnetic composite synthesis with O2: 45mL of MnCl2 ([MnT] = 4.0x10⁻²mol.L-1). The
water stability field is shown for pO2=1.0atm and pH2=1.0atm (HSC 6)
(Appendix)..………...22
Fig. 2-3: (a) X-ray powder diffraction pattern and (b) Raman spectra (two different regions) of the magnetic composite synthesized by using permanganate. ... 26
Fig. 2-4: Raman spectra of the magnetic composites synthesized with O2 (samples
1, 2 and 3 – Table 2-1) ... 27
Fig. 2-5: Eh versus pH curves of manganese oxides reductive reactions considering [Mn2+] = 4x10⁻⁴mol.L-1. ... 29
Fig. 3-1: Powder X-ray diffraction pattern of: (a) magnetite particles (mag) and (b) synthesized Mn3O4 and magnetic Mn3O4 composites (Mnmag). ... 39
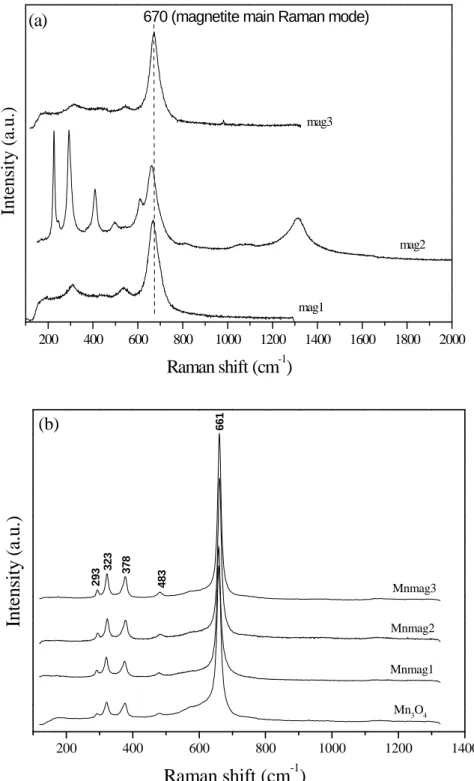
Fig. 3-2: Raman spectra of: (a) magnetite particles (mag); (b) Mn3O4 and magnetic
Mn3O4 composites (Mnmag).. ... 40
viii
Fig. 3-4: Adsorption isotherms of As(III) on Mn3O4, on the Mn3O4 magnetic
composites (Mnmag) and on the synthesized magnetite sample (mag3). Best fittings are shown. Experimental conditions: pH 5.0, 200rpm, 24h, (25±0.5)ºC. Error bars represent the error calculated considering an error of 5% in concentration. ... 44
Fig. 3-5: Relation between arsenic in the Mnmag1 composite and Mn in solution...46
Fig. 3-6: Derivative of As K-edge XANES spectra of the Mnmag composites and synthesized Mn3O4 sample (after contact with As(III) solution); As(III) and
As(V) standards (AsNaO2 and AsHNa2O4.7H2O, respectively). ... 46
Fig. 4-1: Raman spectra of the magnetic Mn3O4 composite after As(III) sorption
tests: (a) Blank sample (solid in contact with a pH 5 solution) and As-loaded samples from 5mgAs.gsolid-1 until 16mgAs.gsolid-1; (b) Sample containing
35mgAs.gsolid-1; inset showing a Raman microscope image of the sample. ... 55
Fig. 4-2: Raman spectra peak fitting of the blank sample and As-loaded samples. Peaks are numbered from 1 to 10 and are described in Table 4-1 ... 56
Fig. 4-3: Derivative of As K-edge XANES spectra of the As-loaded samples (after contact with As(III) solution); As(III) and As(V) standards (AsNaO2 and
AsHNa2O4.7H2O, respectively)... ... 57
Fig. 4-4: Schematic representations of monodentate and bidentate mononuclear forms of As(V) complexed to Mn3+ octahedra.. ... 58
Fig. 4-5: IR spectra of the magnetic Mn3O4 composite containing 14mgAs.gsolid-1
and blank sample. ... 58
Fig. 4-6: Peak fitting of the IR spectrum of the sample containing 14mgAs.gsolid-1.
ix
Fig. 5-1: (a) Raman and (b) FTIR spectra of synthesized magnetite nanoparticles...66
Fig. 5-2: Powder X-ray diffraction pattern of: (a) synthesized magnetite (mag3- Chapter 3), (b) synthesized magnetic Mn3O4 composite (Mnmag3-Chapter 3)
and (c) Mn3O4 particles. ... 67
Fig. 5-3: Magnetization curves of: (a) synthesized magnetite and (b) magnetic Mn3O4 composite (Mnmag). ... 67
Fig. 5-4: Room temperature magnetization curves of: (a) synthesized magnetite (mag3-Chapter 3) and (b) magnetic Mn3O4 composite (Mnmag3-Chapter 3). 70
Fig.5-5: Magnetic Mn3O4 composite (Mnmag3-Chapter 3) dispersed water solution
and magnetic separation. ... 71
Fig. 5-6: Methylene blue (MB) and its N-demethylated derivatives. ... 73
Fig. 5-7: UV-vis spectra of 1.4x10⁻⁵mol.L-1 MB solution before and after charging (a) Mn3O4 nanoparticles suspension (0.7g.L−1) and (b) 0.7g.L-1 and (c) 1.4g.L-1
magnetic Mn3O4 composite suspensions at pH 3.0...74
Fig. 5-8: UV-vis spectra of 1.4x10⁻⁵mol.L-1 MB solution before and after charging Mn3O4 nanoparticles suspension (0.7g.L−1) at (c) pH 4 and (d) pH 6. ... 74
Fig. 5-9: Discoloration efficiency (%) versus time of 1.4 x 10⁻⁵mol L-1 MB solution in interaction with (a) 0.4g.L-1, 0.7g.L-1 and 1.4g.L-1 Mnmag suspensions at pH 3.0, and (b) with 0.7g L-1Mn3O4 nanoparticles at pH 3.0, 4.0 and 6.0. ... 76
x
List of Tables
Table 1-1: List of some magnetic adsorbents found in the literature. ... 04
Table 2-1: Summary of the syntheses parameters ... 22
Table 2-1: Summary of the As(III) removal tests results ... 27
Table 3-1: BET specific surface areas of the samples. ... 37
Table 3-2: Mössbauer hyperfine parameters of commercial magnetite and Mnmag1 magnetic composite. ... 41
Table 3-3: Isotherm parameters for As(III) on the composites and Mn3O4 sample. ... 44
Table 4-1: Raman peaks of As-loaded samples. ... 57
Table 4-2: IR peaks of 14mgAs.gsolid-1 sample……….59
xi
List of Acronyms
AA Azure A
AAS Atomic Absorption Spectrometry
AB Azure B
AC Azure C
BET Brunauer-Emmett-Teller CCD Charge Couple Device
CONAMA Conselho Nacional do Meio Ambiente
DRIFTS Diffuse Reflectance Infrared Fourier-Transformed Spectroscopy EDS Energy Dispersive Spectroscopy
EXAFS Extended X-ray absorption fine structure spectroscopy HGMS High Gradient Magnetic Separation
ICP-OES Inductively Coupled Plasma Optical Emission Spectrometry ICDD International Centre for Diffraction Data
IR Infrared Spectroscopy
LNLS Laboratório Nacional de Luz Síncrotron
MB Methylene Blue
SEM Scanning Electron Microscopy TEM Transmission Electron Microscopy
Th Thionine
UV-vis Ultraviolet-visible Spectroscopy
XAFS X-ray Absorption Fine Structure Spectroscopy XANES X-ray Absorption Near Edge Structure
xii
xiii
Resumo
xiv
Abstract
Composites with magnetic properties have been successfully synthesized by means of the deposition of manganese oxide, Mn3O4, precipitated by using O2 (an
eco-friendly oxidant), onto magnetite particles. The magnetite particles in the composites (~40m2.g-1) form agglomerates with Mn3O4 particles. Solid-liquid
separation by means of the application of a magnetic field is possible. The application of the magnetic composite in the oxidative adsorption of As3+ was evaluated. The arsenic sorption isotherm fits return values of b>1 for the Langmuir constant, demonstrating high affinity of the composites for As(III), which is desired for the removal of trace and sub-trace contaminants from water. The maximum adsorption capacity is ~14mgAs.gsolid-1 (0.0048mmolAs.m-2solid). During the As
oxidation-adsorption process, iron is not released and part of the Mn(II) released to solution is being adsorbed or precipitated, or both, which implies in a less contaminants release to solution. XANES of the As-loaded composites show that the arsenic adsorbed is in the oxidized arsenic form, As(V), demonstrating that As(III) is successfully oxidized by Mn3O4. Raman and IR spectral data of
As-loaded (5.0 to 16mg.g-1) samples suggest the presence of As-O bands referring to the formation of inner-sphere monodentate and bidentate complexes, elucidating arsenic surface complexes on the composite. The magnetic Mn3O4 composite was
also applied to oxidize and remove methylene blue (MB) from water. UV-vis results show that Mn3O4 composite is capable of oxidizing MB forming its partially
1
Chapter 1 Introduction
1.1
Overview
The increased demand of quality water for human and industrial consumption, allied to stringent environmental laws has stimulated the development of materials and methods for the treatment of contaminated aqueous solutions. Adsorption and catalytic or direct oxidation are often involved in applied technologies for water treatment. As desired features, the adsorbent/catalyst should be low-cost, should have considerable contaminant uptake capacity or present high catalytic activity, and be easily recovered and regenerated for reuse. The performance of powder adsorbents/catalysts is sometimes limited when trace or sub-trace concentrations are concerned. In general, the best performance of the adsorbent/catalyst is associated with smaller particles, which possess large specific surface areas. Nanosized sorbents and catalysts have then been designed and evaluated in view of their superior sorption capacity and reactivity in these systems. However, the smaller the particles of the adsorbent/catalyst, the more difficult their separation from the aqueous solution is (Qu, 2008).
Magnetic separation is an effective technique for separating magnetic particles and has been used for several applications in areas such as biochemistry, analytical chemistry, mining and environmental engineering. It has the advantage of being rapid, easily applied in large scale operations and easily automated (Velsen van and Vos van der, 1991; Ebner et al., 1999). Therefore, the challenge of separating high specific surface area powder adsorbents/catalysts from solution could be addressed with the use of magnetic composites. Magnetic composites can be conveniently recovered by magnetic separation, avoiding the filtration steps, which may represent a barrier to the application of high performance advanced materials in environmental remediation processes and treatment of great volumes of aqueous solutions.
2
manganese oxides are the most studied ones (Chaudhury et al., 2003; Ladeira and Ciminelli, 2004; Deschamps et al., 2005; Oliveira et al., 2006; Tripathy et al., 2006). Manganese oxides stand out for their properties, such as high surface areas and strong oxidation capacity, being mostly used at oxidation of many inorganic trace contaminants, volatile organic compounds and phenothiazine dyes (Driehaus et al., 1994; Stobbe et al., 1999; Sekine, 2002; Barret and Mcbride, 2005; Deschamps et al., 2005; Ahn et al., 2006; Chen et al., 2007; Chen and He, 2008; Dias et al., 2008; Chowdhury et al., 2009; Zaied et al., 2011; Chen et al., 2011). Magnetic manganese oxide composites can be seen as potential adsorbents/catalysts since they join the high sorptive and oxidation properties of manganese oxides with the recovery facility of magnetic materials. Therefore, the development of magnetic manganese oxide composites with high sorptive and catalytic capacities is a subject of relevance.
1.2 Magnetic composites
The magnetic particle technology has a high potential to be applied in sorption and catalysis systems, when joint with the use of magnetic separation process. The magnetic particles can be combined with functional groups or inorganic compounds yielding magnetic composites (Velsen van and Vos van der, 1991; Ebner et al., 1999). The main concern of magnetic separation processes is to generate magnetic forces on the magnetic particles large enough to overcome opposing forces, such as Brownian motion, viscous drag, and sedimentation. In a field gradient, there is a proportion between the magnetic force acting on a particle and the particle volume. Therefore, the magnetic attractive forces of ultrafine particles in a field gradient will not be large enough to overcome opposing forces, and no separation will occur. For the case of an isolated particle of magnetite, the critical size for separation is ~50nm, assuming very large applied fields that turns magnetic separations extremely expensive. In low magnetic gradients, the critical size of iron oxide magnetic particle for capture increases substantially (Yavuz et al., 2006).
3
character, greater magnetic susceptibilities, and the emergence of superparamagnetic behavior. Magnetite particles are composed of small regions called magnetic domains (1-100µm), within each the local magnetization is saturated but not necessarily parallel. Domain walls are interfaces between regions in which the magnetization has different directions. As the grain size decreases, a critical size will be reached where the grain can no longer accommodate a wall. Below this critical size, the grain contains a single domain, which is uniformly magnetized to its saturation magnetization (Moskowitz, 1991). In external fields, the single-domain nanoparticles aggregate effectively forming larger and more magnetically responsive particles. Magnetite nanocrystals less than ~16nm in diameter behave as superparamagnets. Superparamagnetic particles have no remanence, which turns their interaction with the external field reversible, thus facilitating their removal from the column matrix in low-field magnetic separators. Therefore, for optimum magnetic separations at low fields, the largest magnetite nanoparticles that still show superparamagnetic properties should be used (Yavuz et al., 2006).
A series of magnetic composites, which could be separated by magnetic separation technology, have been prepared to remove a wide range of contaminants from water. Magnetic carbon composites, chitosan and alginate-bound magnetic adsorbents, magnetic synthetic polymers, magnetic clays and magnetic metal oxides, which exhibit a large specific surface area or selective functional groups, have been developed and possess great potential to remove organic and inorganic pollutants in sorption processes due to the high sorption capacities and conveniently magnetic separation (references in Table 1-1).
4
Table 1-1: List of some magnetic adsorbents found in the literature.
Magnetic Adsorbent
Specific Surface
Area (m2 g-1) Contaminant Sorption capacity Reference
Magnetic carbon composite 1885 658 148 organic dyes organic dyes As(V) and As(III)
83-91% 13.15 and 22mg.g-1
5.83 and 13.10mg.g-1
Si et al.,2012 Sun et al., 2011 Chandra et al., 2010
Magnetic chitosan - - - - - Methyl orange Cu2+, acid dyes
Co2+
Fluoride Au3+ and Ag1+
1651mg.g-1 20mg.g-1
27.4mg.g-1
15.08mg.g-1
3.79 and 1.93mmol.g-1
Hu et al., 2012 Chang and Chen (2005a, 2005b)
Chang et al., 2006a Ma et al., 2007 Donia et al., 2007
Magnetic alginate 174 312.94 313 - Ni2+
As(V) and Cu2+
Cu2+
organic dyes
0.52mmol.g-1
6.75 and 60.24mg.g-1
0.99mmol.g-1
(2.4 - 15.9) x10-3mmol.g-1
Ngomsik et al., 2006 Lim and Chen, 2007 Lim et al., 2008 Rocher et al., 2008
Magnetic synthetic polymer
- 0.065
Cu2+, Cd2+, Pb2+
Cu2+
6.5, 20.3, 41.6mg.g-1
2.26eq.kg-1
Denizli et al., 1998 Dahlke et al., 2006
Magnetic clay
55 353 134
Ni2+, Cu2+, Cd2+,Zn2+
Cr3+, Cu2+, Zn2+
Pb2+, Cu2+
40, 50, 74, 75mg.g-1
49, 87, 114mg.g-1
0.51, 0.71mmol.g-1
Oliveira et al., 2003 Oliveira et al., 2004
Peng et al., 2006
Magnetic metal oxides and hydroxides
(MnO2)
(Fe3O4)
42, 76 (Al(OH)3)
79.6 (ZrO2)
92 (MnO2)
As(V), As(III) U6+ Fluoride Sulfate Cd2+ 0.68mg.g-1 52mg.g-1
38, 8g.kg-1
9.29, 9.78g.kg-1
35mg.g-1
Dlugosch, 2001 Fan et al., 2012 Chang et al., 2006b
5
576.4 (MnO2)
70, 96 (MnOx)
Congo Red Methylene Blue
85-94% 44.2%, 90%
Zhai et al., 2009 Chen et al., 2011
1.3 Manganese oxides
Manganese (Mn) is the third most abundant transition metal and the 10th most abundant element on the Earth's crust. Close to the Earth's surface, Mn is effortlessly oxidized, giving rise to more than 30 identified Mn oxide/hydroxide minerals. These oxides occur in three different oxidation states: +2, +3, and +4. These are the major players in the story of mineralogy and geochemistry of Mn in the upper crust and the major sources of industrial Mn. High levels of Mn are found in the soils of the Iron Ore Province (IOP) of Minas Gerais State, in the form of different manganese oxides (Carvalho Filho et al., 2011). Mn oxides/hydroxides are highly chemically active and strong scavengers of heavy metals. Manganese is not toxic; however, it causes problems in drinking water, such as turbidity and precipitation in pipes, which leads to a bad taste of the water (Dlugosch, 2001; Martins and Lima, 2001). The EPA limit for soluble Mn in drinking water is 0.05mg.L-1. In Brazil, CONAMA establishes that the limit for soluble Mn is 0.5mg.L-1 in drinking water and 1.0mg.L-1 in effluents (CONAMA, 2011). The redox chemistry of manganese II-IV have significant roles and impact in the environment, such as oxidation of metal oxides and organic compounds, thus the study of Mn oxide precipitation and dissolution rates and mechanisms involved are relevant (Martin, 2005). Manganese is difficult to remove. It needs highly oxidizing and high pH (above 9) conditions for manganese oxide/hydroxide formation (Lovett, 1992; Johnson and Younger, 2005; Johnson and Hallberg, 2005; Martin, 2005). This precipitation condition results in high consumption of an alkaline reagent (often Ca2+ based) and in formation of large amounts of sludge to be disposed of.
Fig. 1-1 shows the Eh-pH diagrams for 10-5mol.L-1 and 10-3mol.L-1 MnT at 25ºC, where
MnT is the sum of all the manganese aqueous and solid species. The manganese
6
is the unique dominant species at a wide Eh-pH range (Fig. 1-1). By increasing pH, Mn2+ precipitates. Moreover, by increasing Mn concentration, pH for precipitation decreases. Eh-pH diagrams establish the thermodynamically favorable pathways for transformations, but to predict the transformation rates, a kinetic analysis is required. Kinetic analysis of manganese transformations in natural waters shows that the manganese dissolution rate is slow. Similarly, the precipitation rate is quite slow in the absence of catalysis. The least thermodynamically favored solid is the first solid to form. This phenomenon is called Ostwald`s rule of stages (Martin, 2005).
In natural waters, aqueous Mn2+ is oxidized by reaction with dissolved O2. The reaction
rate becomes appreciable only for pH>8 and it proceeds through the aqueous Mn(OH)2
species (homogeneous oxidation). Mn2+ oxidation rate is catalyzed by metal oxide surfaces terminated by hydroxyl groups (>OH), which bind Mn2+. The (>O2Mn)
7
Fig. 1-1: Eh-pH diagrams of manganese species for (a) [MnT] = 10-5mol.L-1 and (b)
[MnT]= 10-3mol.L-1. The water stability field is shown for pO2=1.0atm and pH2=1.0atm
8
When the contacting aqueous solution is strongly undersaturated, manganese oxides dissolve. The more acidic is the pH, the greater are the dissolution rates. The rates depend on crystalline phase, initial chemical or physical preparation and often pass through initial transients of rapid dissolution. Proton-promoted, ligand-promoted, reductive, and synergistic dissolutions are parallel pathways of increasing dissolution rates. Reductive dissolution is faster than ligand-promoted dissolution; and proton-promoted dissolution is the slowest of all. Protons attach to the oxygen in the hydroxyl groups that bridge the metals, removing electron density and weakening the bond strength of the metal-oxygen linkage. Ligands bind to the surface groups of manganese oxides forming inner-sphere complexes and, thus, increasing dissolution rates. The greater the ligand surface concentration and the ligand binding strength, the greater the increase in dissolution rate. Manganese oxide dissolution is rapidly accelerated by reductants. A surficial Mn2+ ion locked inside an oxide lattice is formed when an electron is transferred to a Mn3+/Mn4+ oxide and rapid depolymerization occurs followed by Mn2+ release to the aqueous phase. Manganese oxides are reduced by common organic matter, such as ascorbic acid, hydrogen sulfide, and phenols, and also by inorganic compounds, such as arsenite. Moreover, dissolution rate increases above the sum of individual dissolution rates when some species interact cooperatively. This is called synergistic dissolution (Martin, 2005).
1.4 Potential applications of magnetic manganese oxide composites
9
Over the last few decades, adsorption has gained increased importance as an effective purification and separation technique used in wastewater treatment. The removal of heavy metals from metal-laden tap or waste water is considered an important application of adsorption processes using a suitable adsorbent (Han et al., 2006; Tripathy et al., 2006). Manganese oxide has been described as a good adsorbent for heavy metals such as Cd2+, Co2+, Pb2+, Cu2+, Ni2+ and Zn2+ from aqueous solutions or waste water due to its relatively high surface area, micro porous structure, and hydroxyl functional groups capable of reacting with metals, phosphate and other specifically sorbing ions (Han et al., 2006; Tripathy et al., 2006).
Only a few works have been focusing on magnetic manganese oxide composites to be used in water treatment (Dlugosch, 2001; Zhai et al., 2009; Rosas et al., 2010; Chen et al., 2011). Most of these works focus on manganese dioxides (Dlugosch, 2001; Zhai et al., 2009; Rosas et al., 2010) and only one work (Chen et al., 2011) investigates manganese oxides with higher standard reducing potential, such as Mn3O4 and Mn2O3.
However, in the aforementioned work, the Mn3O4 and Mn2O3 are synthesized using
high temperature (250oC) and long time (24h). Furthermore, the combined effect of oxidation/sorption is not investigated.
Considering the aforementioned context, the development of a less complex synthesis (temperature, reagents, time) of magnetic manganese oxide composites with high standard reducing potential manganese oxide phases, such as Mn3O4, to be investigated
10
1.5 Characterization Techniques
1.5.1 X-Ray Diffraction (XRD)
X-ray diffraction of powders is a technique frequently used for phase identification of a crystalline material and can provide information on unit cell dimensions, space group and quantitative analysis by Rietveld refinement. X-ray diffraction technique is based on constructive interference of monochromatic X-rays and a crystalline sample when conditions satisfy Bragg's Law (nλ=2d sin θ), which relates the wavelength of
electromagnetic radiation to the diffraction angle and the lattice spacing in a crystalline sample. The random orientation of powdered materials makes it possible to attain all diffraction directions of the lattice by scanning the sample through a range of 2θ angles,
allowing the identification of the minerals present by comparison with standard reference patterns (Dutrow and Clark, 2012).
11
analyses by Rietveld refinement can be used even to address the amorphous content of materials (Jansen et al., 2011).
1.5.2 Vibrational Spectroscopy
Vibrational spectroscopy includes infrared (IR) and Raman spectroscopy and provides characteristic fundamental vibrations that are employed for the elucidation of molecular structure. Raman and IR spectroscopy are complementary techniques and measure the vibrational modes of a molecule. Although some vibrations may be active in both Raman and IR, these two forms of spectroscopy arise from different processes and different selection rules. In general, Raman spectroscopy is best at symmetric vibrations of non-polar groups while IR spectroscopy is best at the asymmetric vibrations of polar groups (Larkin, 2011).
IR spectroscopy measures transitions between molecular vibrational energy levels as a result of the absorption of mid-IR radiation. Raman spectroscopy is a two-photon inelastic light-scattering event. Here, the incident photon is of much greater energy than the vibrational quantum energy, and loses part of its energy to the molecular vibration with the remaining energy scattered as a photon with reduced frequency (Larkin, 2011).
12
Dias et al., 2008; Müller et al., 2010; Duarte et al., in press). Raman spectroscopy is a nondestructive technique that requires no sample preparation. With this technique, diatomic homonuclear molecules, aqueous solutions and heterogeneous complex mixtures can be analyzed. In Micro-Raman, the spectrometer has a microscope that is used to select the area to be analyzed (even single particles) (Ferraro et al., 2003). Most of the minerals or compounds have a unique Raman spectrum, composed by narrow and well defined bands associated to local or net vibrations. The technique also allows the identification of oxyanions (i.e., SO42-, CO32-, PO43-, AsO43-, and others), as these are
good in dispersing the light, and may be present in the form of compounds adsorbed in a matrix (Teixeira et al., 2007; Dias et al., 2008; Müller et al., 2010; Duarte et al., 2012).
1.5.3 Mössbauer Spectroscopy
Mössbauer spectroscopy is a versatile technique that can be used to provide information in many areas of science. The technique is widely used to examine the valence state of iron, which is found in nature as Fe0 (metal), Fe2+, and Fe3+, as well as the type of coordination polyhedron occupied by iron atoms (trigonal, tetrahedral, octahedral, etc.) (Silva et al., 2009; Vasconcelos et al., 2010; Solti et al., 2012), and also in the identification of Fe oxide phases and characterization of synthesized nanoparticles (Rodriguez et al., 2010; Silva et al., 2012)
13
identification of some phases if the phase is magnetically ordered (Rodriguez et al., 2010). Mössbauer spectroscopy is also also used to identify minerals (Silva et al., 2012). Nevertheless, this application is limited, since many different minerals can have site geometries that are the same and their Mössbauer spectra and the parameters will also be the same (Gütlich, 2012). In addition to identification, the relative intensities of the various peaks reflect the relative concentrations of compounds in the sample and can be used for semiquantitative analysis (Navarra et al., 2010; Presniakov et al., 2012). Also, since ferromagnetic phenomena are size-dependent, in some cases spectra can provide insight into the crystallite size and grain structure of a material (Rocha et al., 2012).
1.5.4 Electron Microscopy (SEM and TEM)
Electron microscopy uses a beam of electrons to illuminate samples and produce magnified images. Electron microscopes achieve better than 50pm resolution and magnifications of up to about 10,000,000 times and use electrostatic and electromagnetic "lenses" to control the electron beam and focus it to form an image. Electron microscopy is used to observe a wide range of biological and inorganic samples. Industrially, the electron microscope is often used for quality control and failure analysis (Erni et al., 2009).
14
Unlike the TEM, the scanning electron microscopy (SEM) produces images by probing the samples with a focused electron beam that is scanned across a rectangular area of the specimen. The electron beam loses energy interacting with the samples, which is converted into heat, low-energy secondary electrons and high-energy backscattered electrons, light or X-ray emissions, which provide signals carrying information about the properties of the sample surface, such as its topography and composition. The image resolution of a SEM is about an order of magnitude poorer than that of a TEM. The SEM image relies on surface processes rather than transmission and, therefore, it is able to image bulk samples up to many centimetres in size and has a great depth of field, producing images that are good representations of the three-dimensional shape of the sample (McMullan, 1993). There is a variety of SEM called environmental scanning electron microscope (ESEM), which produces images of sufficient quality and resolution with the samples being wet or contained in low vacuum or gas (McMullan, 1993; Rosas et al., 2010).
1.5.5 Ultraviolet-visible Absorption Spectroscopy (UV-vis)
UV-vis absorption spectroscopy typically probes electronic transitions from valence bands or low molecular electronic levels into the conduction bands or unoccupied orbitals of solids or molecules. UV-vis absorption spectroscopy is used broadly to study chemistry in solutions and is routinely used in analytical chemistry for the quantitative determination of different analytes, such as transition metal ions, highly conjugated organic compounds, and biological macromolecules. However, it is not commonly employed for the study of liquid/solid interfaces, since weak UV-vis absorption signals from species at liquid/solid interfaces are easily obscured by the much more intense broad bands due to the liquid phase (Zaera, in press).
15
coefficients), or more accurately, determined from a calibration curve (Solomons, 1996).
Many studies of adsorption kinetics using UV-vis absorption spectroscopy rely on the indirect measurement of the concentration of the adsorbate molecules in solution before/after the uptake, mainly the ones related to dye adsorption and degradation (Chowdhury et al., 2009; Chen et al., 2011; Zaied et al., 2011). UV-vis absorption spectroscopy can also be used to obtain more detailed kinetics, or even fast dynamic, information. For this, the absorption of light of fixed energy, often from a pulsed laser, is followed as a function of time; the use of picosecond lasers affords the study of the dynamics of fast electronic transitions this way (Zaera, in press).
1.5.6 X-ray Absorption Spectroscopy (XAS)
16
1.6 Relevance and Objectives
High surface area and powerful oxidants metal oxides, such as manganese oxides, are of great interest in the removal of trace contaminants from aqueous solutions due to their adsorption, oxidation and chemical catalysis properties. Magnetic separation is a consolidated technology that can be applied to remove ultrafine particles from aqueous solutions. Therefore, magnetic manganese oxide composites have potential to be applied in advanced water treatment systems, since they combine the sorptive, oxidative and catalytic properties of ultrafine manganese oxide particles with the recovery facility of magnetic separation technology.
The few works that developed magnetic manganese oxide composites to be used in water treatment (Dlugosch, 2001; Zhai et al., 2009; Rosas et al., 2010; Chen et al., 2011) have focused on manganese dioxides or other manganese oxide phases, such as Mn3O4 and Mn2O3, which are synthesized by complicated routes using high temperature
and long time. Moreover, the combined oxidation/sorption effect of using the manganese oxide composites to remove organic and inorganic contaminants from water is overlooked.
17
1.7 Thesis Structure
The Thesis is organized in 6 chapters. In Chapter 1 the work is contextualized by means of a review on magnetic composites, manganese oxides and potential applications for manganese oxide composites. A brief description of the characterization techniques applied, as well as the relevance and objectives are also presented.
In Chapter 2, the synthesis of manganese oxide composites with commercial magnetite by two different routes - one using permanganate as oxidant and the other using air - are described and the different products are compared by means of characterization techniques and As(III) removal tests. The best route was shown to be the one which used air as oxidant and yielded Mn3O4 as the unique Mn oxide phase with no exposed
magnetite particles.
In Chapter 3 the magnetic composites (Mn3O4/Fe3O4) synthesized by the best route
according to Chapter 2, but with three different magnetic particles (commercial, ball-milled commercial and synthesized), are evaluated for the removal of As(III) from aqueous solutions. Part of the results of this chapter was published as a paper by the journal “Materials Research”. The Mössbauer analyses were carried out at Centro Brasileiro de Pesquisas Físicas (CBPF) by Dr. Pablo Muñoz. XANES measurements were performed at Laboratório Nacional de Luz Síncroton (LNLS) in collaboration with Drª Maria Sylvia Dantas and Drª Graziele Duarte from UFMG.
Chapter 4 investigates the mechanism of arsenic immobilization in the Mn3O4 magnetic
18
In Chapter 5 UV-vis spectroscopy is used to evaluate the degradation of methylene blue by the Mn3O4 magnetic composites (with synthesized magnetite nanoparticles). The
degradation tests and UV-vis analyses were carried out at Centro Tecnológico de Minas Gerais (CEFET-MG), at the Chemistry Department. The XRD analyses were also performed at CEFET-MG with collaboration of Dr. Paulo Renato Paiva. The results will be submitted to the journal “ACS Nano”.
19
Chapter 2 Synthesis of manganese oxide magnetic composites:
Evaluation of different synthesis parameters
2.1 Introduction
The use of inorganic magnetic micro- or nano-composites technology to minimize environmental problems has received considerable attention. Magnetic inorganic composites can be used to remove contaminants from aqueous effluents and the loaded material can be separated from the medium by a simple magnetic process. Activated carbon, carbon nanotubes, clay materials and zeolites have been combined with maghemite or magnetite to produce magnetic composites (Peng et al., 2006; Fan et al., 2012; Si et al., 2012).
Manganese oxides, which stand-out for their high oxidation potential and surface areas, are commonly used to remove organic and inorganic contaminants, such as dyes and arsenite, by oxidative adsorption (Dias et al., 2008; Vaclavikova et al., 2008; Zhang et al., 2010; Zaied et al., 2011). Magnetic materials prepared from manganese oxide can be produced by means of the oxidation of manganese ions due to the action of an oxidizing agent in presence of magnetic particles such as magnetite (Rosas et al., 2010). The most commonly used oxidizing agent to precipitate manganese oxides is potassium permanganate (KMnO4). KMnO4 can oxidize Mn2+ directly to Mn4+ producing
manganese dioxides (MnO2). Manganese dioxides are usually used to remove heavy
metals from water due to their high surface areas. These compounds have also been employed to oxidize As(III) to As(V), thus improving As(III) removal from water (Dias et al., 2008; Rosas et al., 2010; Vaclavikova et al., 2008). Other manganese oxides, such as Mn3O4 (Mn2+/Mn3+ oxide) and Mn2O3 (Mn3+ oxide) have been mostly used in
organic degradation due to their high standard redox potentials (Chowdhury et al., 2009). These manganese oxides are usually obtained by calcination and solvothermal methods (Yang et al., 2006). Aqueous Mn2+ is oxidized by dissolved O2 in natural
waters at pH>8 through the aqueous Mn(OH)2 species or by metal oxide surfaces
20
dissolved O2 could be an environmentally friendly oxidant to produce magnetic
manganese oxide composites. The present work proposes a method for the production of manganese oxide magnetic composites with O2 as the oxidant. The performance of
these composites has been compared with that of the material produced with the addition of potassium permanganate. Both products have been characterized with respect to surface areas (BET) and manganese oxide phases (Raman Spectroscopy). Moreover, their oxidation and adsorptive capacities have been evaluated in the removal of As(III) from water.
2.2 Experimental
2.2.1 Synthesis of the manganese oxide magnetic composites
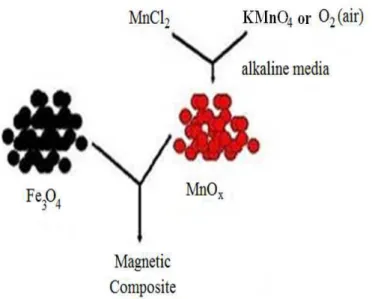
The synthesis of the manganese oxide magnetic composites was based on the oxidation of manganese ions by permanganate (Eq. 2-1) (Rosas et al., 2010) and oxygen, O2, at
room temperature, in presence of commercial magnetite, Fe3O4 (Fig. 2-1).
3MnCl2(aq) + 2KMnO4(aq) + 4KOH(aq) = 5MnO2(s) + 6KCl(aq) + 2H2O (2-1)
21
Magnetite, provided from Sigma-Aldrich (<5µm, 98%), was described as synthetic iron oxide, Fe3O4. After the synthesis, the resulting magnetic composites were separated
from the solutions and washed using deionized water with a conductivity of 18.2µ.cm-1 obtained with a Milli-Q water purification system (Milipore). Solutions of 1.0mol.L-1 MnCl2.4H2O, 1.0mol.L-1 KOH and 0.2mol.L-1 KMnO4 were used for the preparation of
the composites. KMnO4 and MnCl2.4H2O were standardized by using sodium oxalate
and an already standardized KMnO4 solution, respectively. The pH and the Eh (redox
potential) were constantly monitored during synthesis (713 pHMeter, Metrohm). All chemicals were of analytical grade and used without further purification.
The syntheses of the composites prepared with KMnO4 (sample 0, Table 2-1) were
carried out by mixing, in 500mL of deionized water, 23mL of potassium permanganate with 14mL of KOH (initial pH 12) in the presence of 1.0g of magnetite particles. 14mL of MnCl2 was added and the mixture was stirred (700rpm) during 30min (final pH 4.0)
(Rosas et al., 2010).
For the preparation of the composite by using O2 (samples 1 to 3, Table 2-1), 1000mL
of deionized water pre-saturated with O2 by flowing air was put in contact with different
volumes (5, 15 and 45mL) of MnCl2.4H2O in presence of 1.0g of magnetite particles.
The Eh-pH diagrams (species and thermodynamic data are listed in the Appendix) for the Mn-H2O system (Fig. 2-2) show that the oxidation of aqueous Mn2+ with dissolved
O2 is stable at pH>8. Therefore, the reaction was carried out under alkaline conditions
(pH 8.0 to pH 12) by addition of KOH, and constant input of air (567L.h-1) and stirring (700rpm) during 30min. Since the Eh-pH diagrams for conditions of samples 1, 2 and 3 are mainly the same, the Eh-pH diagram chosen to be shown in Fig. 2-2 is for the synthesis conditions of sample 3.
Table 2-1 summarizes the parameters investigated in the synthesis of the magnetic composite and illustrates typical results. When 5.0mL of MnCl2 and 10mL of KOH are
mixed (sample 1, Table 2-1), the pH drops from 10.2 to 7.6 and Eh increases from 0.22V to 0.48V. To decrease magnetite particles exposure in the composite, the MnCl2
22
synthesis with permanganate, the volume of KOH was also increased (sample 2, Table 2-1). The final pH reach 11.5 and the Eh varied from 0.1V to 0.2V. With the aim to further improve the coverage of the magnetite particles, the volume of MnCl2 was
increased (sample 3, Table 2-1). The pH and Eh remained constant at ~12 and at 0.1V.
Table 2-1: Summary of the synthesis parameters.
Fig. 2-2: Eh-pH diagram (298K) constructed using the conditions of magnetic composite synthesis with O2: 45mL of MnCl2 ([MnT] = 4.0x10⁻²mol.L-1). The water
stability field is shown for pO2 = 1.0atm and pH2 = 1.0atm (HSC 6) (Appendix).
Oxidant Sample
KOH volume
(mL)
MnCl2 volume
(mL)
Initial pH/Eh (V)
Final pH/Eh (V)
Surface Area (m2.g-1)
KMnO4 0 14 14 12.0/ - 12.0/ - 59
1 10 5.0 10.2/0.22 7.6/0.48 28
O2 2 30 15 12.0/0.10 11.5/0.20 47
23
2.2.2 Characterization of the materials
Characterization of magnetic composites were obtained by Raman spectroscopic analysis on a Horiba Jobin Yvon LABRAM-HR 800 spectrograph, equipped with a 633nm helium-neon laser, 20mW of power, coupled to an Olympus BHX microscope equipped with lenses of 10, 50 and 100X. Raman-scattered radiation was collected with 600g.mm-1 grating, in a 180° backscattering configuration. The spectra were collected in a frequency range of 100 to at least 1100cm-1 with a step size of 1.1cm-1. In order to suppress extra noise and to obtain sufficiently accurate results, a N2 cooled charge
couple device (CCD) detector was used as the detecting device. To reduce noise ratio, spectra were acquired at acquisition time of one minute twenty times. X-ray diffraction analyses (XRD) were performed on a Philips-PANalytical PW 1710 X-ray difractometer, using a copper anode (Cu Kα1 radiation) and graphite crystal
monochromator. Analyses were run by step-scanning from 4o to 90o 2θ, increments of 0.06 2θ and continuous count time of 1s. Measurements of the specific surface area were made by the BET (Brunauer-Emmett-Teller) – Multipoint method using a nitrogen gas sorption analyzer NOVA 1000 Quantachrome. Prior to the measurements the samples were massed, degassed by placing them into a glass cell under vacuum for at
least 24h at 100ºC, and massed again.The BET analyzer was configured and its Dewar flask filled with liquid nitrogen and set into place. Each degassed sample was load and the results of the analysis collected.
2.2.3 Arsenic oxidation and removal
In the batch arsenic sorption experiments, 0.2g of the adsorbent material (magnetic composite) were added into the 250mL Pyrex erlenmeyers flasks, filled with 100mL of As(III) solution, and the vessels sealed with laboratory parafilm (Pechiney plastic packaging, USA). The As(III) stock solution was prepared by dissolving AsNaO2
24
measured and the samples were separated from the liquid. The filtrates were assayed for total arsenic directly by flame Atomic Inductively Coupled Plasma Optical Emission
Spectrometry, ICP-OES (Perkin-Elmer Optima 7300 DV). The tests were carried out in
triplicate.
2.3 Results and Discussion
Fig. 2-3(a) shows the XRD diagram of the magnetic composite synthesized by using permanganate. The diffraction pattern of the solid has shown the lines corresponding to the diffraction pattern of commercial magnetite powder and a broad peak in the region 20-30 degrees, indicating the presence of an amorphous phase. Raman technique is useful for identification of manganese oxides, especially for samples with poor crystallinity. Fig. 2-3(b) shows the Raman spectra in two different regions of the composite. Spectrum A is quite similar to the spectrum of magnetite and spectrum B is characteristic of manganese oxides having the birnessite-type structure (δ-MnO2). The
birnessite-type manganese oxides (δ-MnO2) are a group of layered manganese dioxides,
which can be found in nature or synthesized. They present a layered structure consisting of edge-sharing MnO6 octahedra, with water molecules and metal cations occupying the
interlayer region (Julien et al., 2003). Birnessite- type MnO2 present low Raman
activity. They show three major bands at 500-510, 575-585 and 625-650cm-1. The two high-wavenumber bands dominate all spectra, while bands in the low-frequency region exhibit weak intensity. The Raman band at 625-650cm-1 can be viewed as the symmetric stretching vibration ν2 (Mn-O) of MnO6 groups and the band located at 575-585cm-1 is
usually attributed to the ν3 (Mn-O) stretching vibration in the basal plane of [MnO6]
sheets. Significant spectral modifications can be observed as a function of the nature of ions located within the basal MnO6 sheets. Nevertheless, the general similarity of the
25
The Raman spectra of the magnetic composites synthesized with O2 are shown in Fig.
2-4. For sample 1, the Raman spectrum shows the presence of Mn2O3 (bixbyite),
MnOOH (groutite) and Mn3O4 (hausmannite). Bixbyite is a sesquioxide that has two
polymorphs, the cubic α−Mn2O3 and the tetragonal γ−Mn2O3. Hausmannite is a spinel
manganese oxide containing Mn2+ ions in tetrahedral coordination and Mn3+ ions in distorted octahedral coordination. Groutite also presents oxygen atoms forming distorted octahedra around the Mn3+ atoms (Julien et al., 2004). The composite (sample 1) shows specific surface area of 28m2.g-1 and an As loading of ~0.06mg.m-2 (Table 2-2). For sample 2, Raman spectrum presents bands related to Mn2O3, MnOOH, Mn3O4
and also MnO2 (Fig. 2-4). The MnO2 phase formed is R-MnO2 (ramsdellite), a
metastable form of MnO2 (Julien et al., 2004). The surface area of the composite
(sample 2) increased to 47m2.g-1 and the As uptake is ~0.03mg.m-2 (Table 2-2). For the magnetic composites described (samples 1 and 2), micro-Raman spectra of some regions show the presence of characteristic magnetite Raman bands (data not shown), which indicates that the magnetic particles are exposed. However, for sample 3, Raman spectra of different regions only showed the characteristic Raman bands of Mn3O4 (Fig.
2-3 and Fig. 2-4), which indicates that the magnetic particles are not exposed. Moreover, sample 3 presents a surface area of 39m2.g-1 and the highest specific As uptake of (~0.10mg.m-2, Table 2-2).Therefore, Mn3O4 plays an important role in As
26
Fig. 2-3: (a) X-ray powder diffraction pattern and (b) Raman spectra (two different regions) of the magnetic composite synthesized by using permanganate.
10 20 30 40 50 60 70 80 90
(4 4 4 ) (5 3 3 ) (6 2 0 ) (4 4 0 ) (5 1 1 ) (4 2 2 ) (4 0 0 ) (2 2 2 ) (3 1 1 ) (1 1 1 ) (2 2 0 ) Composite (KMnO4 synthesis)
Commercial magnetite (a) In te n si ty ( a. u .)
2θ (degree)
100 200 300 400 500 600 700 800 900 1000 1100 1200 (b)
(A) magnetite (Fe3O4) (B) birnessite (δ-MnO2)
5 4 0 5 7 6 2 9 9 3 1 1 5 0 8 6 4 9 6 7 0 In te n si ty ( a. u .)
27
Fig. 2-4: Raman spectra of the magnetic composites synthesized with O2 (samples 1, 2
and 3 - Table 2-1).
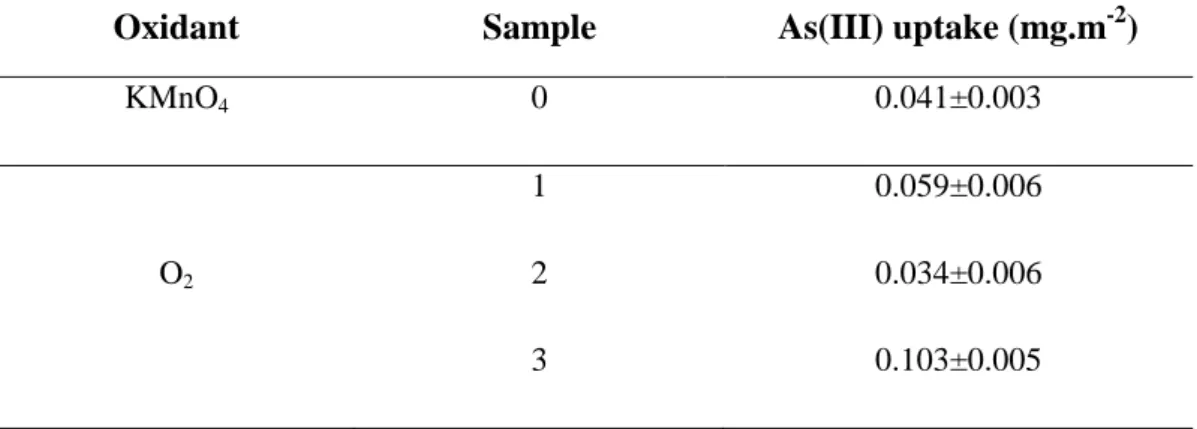
Table 2-2: Summary of the As(III)removal tests results.
Oxidant Sample As(III) uptake (mg.m-2)
KMnO4 0 0.041±0.003
1 0.059±0.006
O2 2 0.034±0.006
3 0.103±0.005
200 400 600 800 1000
*
Mn3O4 MnO2 Mn2O3 MnOOH
*
*
*
*
.
*
*
Sample 2
Sample 3 Sample 1
Raman shift (cm-1)
In
te
n
si
ty
(
a.
u
28
Plots of the redox potential (Eh) versus pH for MnO2, Mn2O3, MnOOH and Mn3O4
(Eqs. 2-2 to 2-5) with a Mn2+ concentration of 4.0x10⁻⁴mol.L-1 (based on the Mn2+ release during As sorption tests) are shown in Fig. 2-5. It can be seen that at pH<7 Mn3O4 presents higher redox potential than Mn2O3 and MnO2, and at pH<10 Mn3O4
presents higher redox potential than MnOOH, therefore being more effective to oxidize As(III) to As(V) in acidic media. In the present As oxidation and removal tests pH increases from 5.0 to 7.0, remaining in the range where Mn3O4 presents the highest
redox potential compared to the other studied manganese oxides. Therefore, the greater As uptake by sample 3, could be explained by Mn3O4 higher redox potential in acidic
media, which favors a rapid oxidation of As(III)to As(V) improving As adsorption.
MnO2 + 4H+ + 2e- = Mn2+(aq) + 2H2O (Eh0298 = 1.225V) (2-2)
Eh298 = 1.225 - 0.0295 log[Mn2+] - 0.118 pH
Mn2O3 + 6H+ + 2e- = 2Mn2+(aq) + 3H2O (Eh0298 = 1.497V) (2-3)
Eh298 = 1.497 – 0.059 log[Mn2+] – 0.177 pH
2MnOOH + 6H+ + 2e- = 2Mn2+(aq) + 4H2O (Eh0298 = 1.542V) (2-4)
Eh298 = 1.542 – 0.059 log[Mn2+] – 0.177 pH
Mn3O4 + 8H+ + 2e- = 3Mn2+(aq) + 4H2O (Eh0298 = 1.824V) (2-5)
Eh298 = 1.824 - 0.0885 log[Mn2+] - 0.236 pH
H2AsO4- + 2e- + 3H+ = H3AsO3 + H2O (Eh0298 = 0.641V) (2-6)
29
Fig. 2-5: Eh versus pH curves of manganese oxides reductive reactions considering [Mn2+] = 4x10⁻⁴mol.L-1.
2.4 Conclusion
Different experimental conditions for the synthesis of manganese oxide magnetic composite have been evaluated. The produced materials have been tested for As(III) oxidation and removal, a typical commercial application of manganese oxides. The diffraction pattern and Raman spectrum of the composite synthesized with KMnO4 have
shown the presence of magnetite (Fe3O4) and birnessite-type structure phase (δ-MnO2);
the magnetite particles were partially exposed. The synthesized birnessite-type magnetic composite has shown a relatively high specific surface area of 59m2.g-1 and As(III) removal of ~0.04mg.m-2. The synthesis with O2 produced MnOOH, Mn2O3 and Mn3O4
precipitates according to the Raman analyses. The composite specific surface area, magnetite coverage as well as As loading varied according to synthesis conditions. By controlling Eh and pH, magnetic composites with not exposed magnetite particles and specific surface areas of 39m2.g-1 were synthesized; arsenic uptake was ~0.10mg.m-2. Therefore, it is shown that is possible to replace KMnO4 by O2 in manganese oxide
-2 0 2 4 6 8 10 12 14 16
-1,5 -1,0 -0,5 0,0 0,5 1,0 1,5 2,0 2,5 MnOOH MnOOH pH 9.9
Mn3O4 Mn2O3 MnO2 MnO2
Mn2O3 Mn3O4
30
precipitation. The synthesis conditions can be adjusted to produce different manganese oxide phases. The Mn3O4 magnetic composites obtained in the synthesis with oxygen
31
Chapter 3 Preparation and application of a magnetic composite
(Mn
3O
4/Fe
3O
4) for removal of As(III) from aqueous solutions
3.1 Introduction
The presence of arsenic in drinking water is of great concern due to its toxicity and carcinogenic potential. Arsenic concentration below 10µg L-1 is the World Health Organization’s (WHO) recommendation for drinking water supplies (Mohan and Pittman, 2007). The increasing water quality demand for human consumption and industrial support, coupled with stringent environmental legislation, has stimulated the development of new materials and methods for the treatment of arsenic-contaminated aqueous solutions. Adsorption processes are commonly applied to water treatment. As desired features, adsorbents should be low-cost and should present a considerable contaminant adsorption capacity. When trace or sub-trace concentrations are of concern, powder adsorbents with small-sized particles and a large specific surface area are required. Separating small-sized particles of a highly specific surface area from a solution is a challenge that can be addressed with the use of magnetic adsorbents. Magnetic adsorbents can be conveniently recovered by magnetic separation, in turn avoiding the filtration steps, which represent a barrier to the application of high-performance, small-sized materials in environmental remediation processes and in the treatment of great volumes of aqueous solutions. Some investigations have shown that magnetic iron oxides, such as magnetite nanoparticles, lead to the efficient removal of arsenic from contaminated water (Yavuz et al., 2006). Nevertheless, the instability of these magnetic nanoparticles represents a problem, as magnetite is highly susceptible to oxidation when exposed to the atmosphere. To face this problem, magnetite nanoparticles are being combined with other compounds or covered by an active compound (Qu, 2008; Rosas et al., 2010; Chen et al., 2011). In both cases the magnetic property of magnetite is preserved.
32
the most toxic and mobile. Under oxidizing conditions, H2AsO4- is the dominant
inorganic arsenic species at low pH (from pH 2.0 to pH 6.9), while at higher pH, HAsO42- becomes dominant. The inorganic species H3AsO4 and AsO43- may be present
in extremely acidic and alkaline conditions, respectively. Under reducing conditions at a pH of less than approximately 9.2, the neutral As(III) species, H3AsO3, predominates
(Smedley and Kinniburgh, 2002). The most used arsenic removal techniques, such as adsorption on activated alumina and coprecipitation with ferric salts, are often more effective for As(V) than for As(III) removal, given that the predominant As(III) species at circumneutral pH is the uncharged H3AsO3, while for As(V) the predominant species
are the charged H2AsO4- and HAsO42- (Smedley and Kinniburgh, 2002). Therefore, an
oxidation step is often used to improve arsenic removal and fixation. Manganese oxides are known as effective oxidizers of As(III) to As(V) in natural environments and in water treatment units (Smedley and Kinniburgh, 2002; Deschamps et al., 2005; Ladeira and Ciminelli, 2004; Vaclavikova et al., 2008; Dias et al., 2008). Among the series of manganese oxides, Mn3O4 is particularly known to be an effective and inexpensive
catalyst in various oxidation and reduction reactions (Parsons et al., 2009; Zhang et al., 2010). The use of powder magnetic manganese oxide composites as adsorbents may combine the excellent adsorptive and oxidation properties of manganese oxide with good performance recovery of magnetic separation techniques. Nevertheless, very few works have been focusing on magnetic manganese oxide composites to be used in water treatment (Rosas et al., 2010; Chen et al., 2011). Moreover, in these published works, the magnetic composites are often synthesized by precipitation of manganese oxide, when in presence of magnetite, by using relatively costly oxidants, such as potassium permanganate and hydrogen peroxide. Considering the aforementioned context, the present work aims to synthesize relatively low-cost magnetic Mn3O4 composites, with
chemical stability and physical integrity, in stirred solid-aqueous systems. The magnetic sorbent is applied to As(III) removal in environmental systems.
3.2 Experimental
33
obtained with a Milli-Q water purification system (Millipore). To remove contaminants that had been potentially adsorbed onto the glass and plastic walls, all vessels and instruments were cleaned by soaking in detergent solution, then in 1M HNO3 solution,
and subsequently in deionized water, in each case for at least 24 hours. All parts of the spectroscopic equipment used to extract and fill the sample cells were cleaned and rinsed properly with acetone. The pH electrode (713 pHMeter, Metrohm) was calibrated everyday with three pH buffers (pH 4.0, 7.0, and 10.0).
3.2.1 Synthesis of the magnetic manganese oxide composites
For the preparation of the composite, 1000mL of deionized water was placed in contact with 1.0g of different obtained magnetite particles and 45mL of 1.0mol L-1 MnCl2.4H2O
(Sigma-Aldrich) solution at pH 12 (1.0mol.L-1 KOH – Sigma-Aldrich) in a 2000mL Pyrex beaker under stirring (mechanical stirrer, Fisatom 713 D) and constant air input (aquarium pump Power 500). This same reaction was also carried out in the absence of magnetite particles for comparison. The resulting solid was separated from the liquid by using a neodymium magnet (180x100x35mm, Imatec Produtos Magnéticos Ltda) and washed using deionized water. The solutions were analyzed by Atomic Absorption Spectrometry, AAS (Perkin Elmer Analyst A300), for iron and manganese content. Commercial magnetite microparticles (< 5µm) (mag1) were furnished by Sigma-Aldrich. Magnetite nanoparticles covered by hematite (mag2) were obtained by ball-milling of commercial magnetite microparticles during 4 hours. Magnetite nanoparticles (mag3) were prepared by mixing N2 saturated water solution of Fe3+: Fe2+ (2:1) and
adding KOH solution (5.0mol.L-1) at 70°C (Oliveira et al., 2004; Peng et al., 2005; Mürbe et al., 2008).
3.2.2 Evaluation of the sorbents chemical stability and physical integrity
34
placed in contact with 100mL aqueous solutions in different pH values (from 2.0 to 12) in 250mL Pyrex vessels sealed with laboratory parafilm (Pechiney plastic packaging, USA) and stirred for 24h in a thermostatic shaker (New Brunswick Scientific Edison, USA) at room temperature. The solids were separated from the solution by a neodymium magnet, while the supernatant solutions were vacuum-filtered through 0.22µm membrane filters (Fisher Scientific). The membrane filters were weighed on a precision balance (Mettler AE 200) before and after filtration to estimate the detachment. The solution was analyzed by AAS for Mn and Fe contents, whereas the solids were analyzed by EDS for Mn and Fe contents. The tests were carried out in duplicate.
3.2.3 Spectroscopic and image analyses techniques
Raman spectroscopic and X-ray diffraction (XRD) analyses were carried out for solid identification. Raman spectra were collected on a Horiba Jobin Yvon LABRAM-HR 800 spectrograph, equipped with a 633 nm helium-neon laser, 20mW of power, attached to an Olympus BHX microscope equipped with 10X, 50X, and 100X lenses. The diffractograms were obtained on a Philips-PANalytical PW 1710 X-ray diffractometer equipped with a texture chamber. The lattice constants of magnetite samples were calculated by using the following equation:
(3-1)
where d is the d-spacing; h,k,l are the Miller indices; and a0 is the cubic lattice constant.
35
mode under operation conditions of 1.37GeV and beam currents of approximately 250mA. The spectra were collected at room temperature using a Si (111) double crystal monochromator with an upstream vertical aperture of 0.3mm and calibrated with Au L1
-edge (11918eV). The samples were fixed onto acrylic holders, sealed with Kapton tape film, placed at an angle to the incident beam. Energy calibration was monitored during data collection by acquiring reference Au foil spectra simultaneously. AsNaO2 (Fluka)
and AsHNa2O4.7H2O (Fluka) were used as As(III) and As(V) standards, respectively.
Mössbauer spectroscopy data were collected on a conventional constant acceleration Mössbauer spectrometer (Halder) in transmission mode with a 57Co (Rh) source to identify the composite’s magnetic phase. Measurements of the specific surface area were made by the BET (Brunauer-Emmett-Teller) – Multipoint method using a nitrogen gas sorption analyzer NOVA 1000 Quantachrome.
3.2.4 Arsenic immobilization
In the batch arsenic sorption experiments, 0.2g of the adsorbent materials (magnetic composites or manganese oxide) was added into the 250mL Pyrex erlenmeyers flasks, filled with 100mL of As(III) solution at initial pH 5.0, and the vessels sealed with laboratory parafilm (Pechiney plastic packaging, USA). The As(III) stock solution was prepared by dissolving NaAsO2 (Fluka) in Milli-Q water. Initial As(III) concentrations
varied from 1.0 to 50mg.L-1. Agitation at 200 rpm was provided by a thermostatic shaker (manufactured by New Brunswick Scientific Edison, USA). The temperature was maintained at (25.0±0.5)ºC. After 24h, the pH of the solutions was measured, and the samples were separated from the liquid by using a magnet. The filtrate was directly assayed for total arsenic, iron and manganese using inductively coupled plasma optical
emission spectrometry, ICP-OES (Perkin-Elmer Opttima 7300 DV). The tests were
36
3.3 Results and Discussion
3.3.1 Evaluation of the composites chemical stability and physical integrity
The supernatants obtained after the magnetic separation of the solid samples stirred in pH 10 and pH 12 aqueous solutions were turbid (brown yellow) and had to be vacuum-filtered twice through a 0.22µm membrane filter (Fisher Scientific) to achieve clarification. EDS results have shown the presence of only manganese in the fine filtrate particles, indicating that the physical integrity of the magnetic composites were compromised in these pH values (22% of Mn3O4 was separated from magnetite
particles). When stirring at pH values from 3.0 to 9.0, no turbidity could be observed in the supernatants obtained after magnetic separation, which indicates that the physical integrity was preserved (less than 1% of Mn3O4 was separated from the magnetite
particles). Significant manganese dissolution (49%) could only be observed in pH 2.0. In pH values from 3.0 to 9.0, less than 1% of manganese was dissolved. Iron dissolution was not detected (< 10µg.L-1). It can be concluded that the composites have shown a good chemical stability and physical integrity in pH values ranging from 3.0 to 9.0, which is the commonly used range for arsenic adsorption in water treatment units.
3.3.2 Sorbents characterization
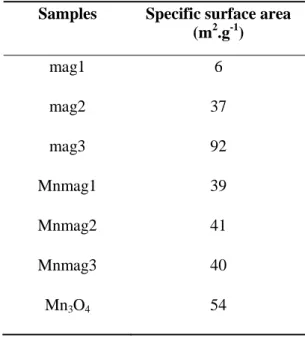
The values of specific surface areas for magnetite, manganese oxide, and magnetic manganese oxide composite samples are shown in Table 3-1. The different magnetite particles presented different specific surface areas. Sample mag3 presented the highest value, which was expected from the preparation route followed. The smallest specific surface area belongs to mag1, which is the commercial magnetite. The commercial magnetite increased its specific surface area approximately six times after being milled (mag2). The different composites present similar specific surface areas, indicating that different magnetite particles (with different specific surface areas) do not interfere in the Mn3O4 precipitation and Mn3O4 particles are contributing more in the composites’

![Fig. 2-2: Eh-pH diagram (298K) constructed using the conditions of magnetic composite synthesis with O 2 : 45mL of MnCl 2 ([Mn T ] = 4.0x10 -2 mol.L -1 )](https://thumb-eu.123doks.com/thumbv2/123dok_br/15128596.13112/36.892.144.737.385.973/diagram-constructed-using-conditions-magnetic-composite-synthesis-mncl.webp)

![Fig. 2-5: Eh versus pH curves of manganese oxides reductive reactions considering [Mn 2+ ] = 4x10 -4 mol.L -1](https://thumb-eu.123doks.com/thumbv2/123dok_br/15128596.13112/43.892.207.669.124.514/fig-versus-curves-manganese-oxides-reductive-reactions-considering.webp)